

Abstract
Brazilians consume excessive dietary sodium (4700 mg/d); hence, the reduction of dietary sodium intake has been a Brazilian government priority. A set of strategies has been implemented that includes food and nutrition education initiatives and the reduction in the sodium content of processed foods and foods consumed out of the households. Since 2011, the Ministry of Health has selected priority food categories that contribute to over 90% of sodium intake from processed foods and have set biannual voluntary targets for sodium reduction with food industries to encourage food reformulation. Three rounds of monitoring of the sodium content on food labels have been conducted for instant pasta, commercially produced breads, cakes and cake mixes, cookies and crackers, snacks, chips, mayonnaise, salt‐based condiments, and margarine. Between 90% and 100% of the food products achieved the first targets in the 2011–2013 period, and the average sodium content of food categories was reduced from 5% to 21% in these first 2 years. These data show that with close monitoring and government oversight, voluntary targets to reduce the sodium content in processed foods can have a significant impact even in a short time frame. The Brazilian strategy will be continuously monitored to maximize its impact, and, if necessary in the future, a transition to regulatory approaches with stronger enforcement may be considered.
Keywords: diet/nutrition, epidemiology, sodium
1. INTRODUCTION
Noncommunicable chronic diseases cause over 70% of deaths in Brazil, with excessive sodium consumption being estimated to be one of the main contributors.1 The average population sodium intake in Brazil has been estimated to be 4.7 g/d (≈12 g salt/d), which is more than twice the recommended value.2 In addition, almost 70% of Brazilian adolescents, 90% of men, and 70% of women consume more than the recommended 2 g/d of sodium.3 Despite the excessive sodium intake by most Brazilians, only 14.2% of the adults self‐report high sodium consumption.4 Therefore, salt awareness is also a very important issue to be addressed in Brazil, especially relating to discretionary salt and hidden sodium in processed foods, along with the reformulation of foods to reduce sodium content.
Main sodium sources may differ among countries. In Brazil and other Latin American and Asian countries, most sodium intake comes from discretionary salt and salt‐based condiments, while in most high‐income countries, processed foods are the main sources of dietary sodium.5 Nevertheless, an increasing proportion of dietary salt is from processed foods, which now account for up to a quarter of the sodium intake in some Brazilian population subgroups. Because of the diverse population and the relevance of different dietary sources of sodium, Brazil has worked on a multiple pronged strategy for dietary sodium reduction, which addresses consumer education and healthy diet promotion, processed food reformulation, health promotion in school and work settings, healthy food regulations, and healthcare services.6
It is important to also consider that, along with sodium reduction to <2000 mg/d, increases of dietary potassium and magnesium play important roles in reducing blood pressure and cardiovascular diseases and must be considered in population strategies.7 In this regard, the World Health Organization has stated a strong recommendation for an increase in potassium intake from food for adults for reducing blood pressure and risk of cardiovascular disease, stroke, and coronary disease and a conditional recommendation for an increased intake by children to control blood pressure.8
Brazil has developed a voluntary reduction program regarding food reformulation through an agreement with national food industries based on the successful experiences of other countries, such as the United Kingdom.9 Within the scope of a comprehensive cooperative agreement with the main food industry association in the country, Brazil has set progressively lower biannual sodium reduction targets for priority food categories. These categories were selected upon their contribution to population sodium intake and frequent consumption by vulnerable groups such as children and adolescents. The selected categories in aggregate account for over 90% of sodium intake from processed foods.
In Brazil, the sodium reduction in the food supply is regularly monitored in order to assess the compliance of the food industry to the voluntary targets and also to aid in the development of new reduction targets. We report the results of the three first rounds of official monitoring of sodium in processed foods (2011–2013), and the proportion of foods achieving the targets set by the Ministry of Health and the Brazilian Food Industry Association (ABIA).10
2. METHODS
2.1. Product selection criteria
Products were included if they were part of the three first rounds of the monitoring of national sodium reduction targets, which had deadlines at the end of 2012 and 2013. These food categories included instant pastas, breads, chips and snacks, cakes and cake mixes, cookies and crackers, margarine, salt‐based condiments, and breakfast cereals (Table 1). Included products were produced by member companies in the ABIA and hence were part of the national voluntary agreements on sodium reduction. The members of the ABIA are collectively responsible for over 70% of the national processed food market share in Brazil.
Table 1.
Targets for maximum sodium content established for processed foods in Brazil, 2012–2013
| Product | Target (mg/100 g) | Date for target to be achieved |
|---|---|---|
| Instant pasta (ramen) | 1920.7 | 2012 |
| Buns | 531 | |
| Loaf bread | 645 | |
| Cake without filling | 392 | |
| Cake with filling | 282 | |
| Cake roll | 221 | |
| Aerated cake mixa | 476 | |
| Creamy cake mixa | 349 | |
| Corn snacks | 1090 | |
| Potato chips | 650 | |
| Mayonnaise | 1283 | |
| Sweet crackers | 419 | |
| Salted crackers | 923 | |
| Filled cookies | 389 | |
| Breakfast cereals | 579 | 2013 |
| Margarine | 1089 | |
| Liquid and gel salt‐based condimentsb | 928 | |
| Cube and powder salt‐based condimentsb | 1100 | |
| Paste salt‐based condiments | 37 901 | |
| Rice salt‐based condiments | 32 927 | |
| Other salt‐based condiments | 23 775 |
The targets for cake mixes (aerated and creamy) were both set for the final product as consumed, prepared according to the manufacturer, and not for the product as sold.
The targets for liquid, gel, cube, and powder condiments (bouillons) were set considering the dilution established by National Health Surveillance Agency (Anvisa) on nutritional labels of these food categories (Resolution 359/2003).
2.2. Voluntary targets and food company commitment
Food companies that voluntarily participated and committed to the national sodium reduction targets were identified from the ABIA website. Information on sodium reduction targets was derived from the Ministry of Health's website.11, 12, 13, 14 According to the national food reformulation strategy, the biannual targets correspond to the maximum sodium content in each food category by the end of a given year (Table 1). Initially, during the negotiations for the first agreement, targets only took into consideration the national baseline sodium content of foods and its comparison to international targets for similar food categories. Additional criteria were added the target setting in following agreements to guarantee more transparency and accountability to the targets. These later criteria included setting maximum sodium levels that were as close as possible to the average or median sodium content of the whole food category at the initial assessment (baseline) within 4 years.
2.3. Data collection
Baseline data were collected between 2010 and 2011, prior to the negotiation of targets, and the monitoring data were collected in the first semester of both 2012 and 2013. Data were obtained directly from the mandatory food label information of products, mainly on food industry websites and, where website data were not available, by product food labels in the retail market and by information provided by food industries. Products had to be available in the market by the time of monitoring (not discontinued) and in the case of the same product with different package sizes, only one entry was considered. Baseline and monitoring data consisted of records of the manufacturer, brand, and commercial product name, as well as the sodium content per sizing and adjusted per 100 g. Data were independently verified for outliers, missing values and data entry accuracy by two study personnel and queries and discrepancies were reviewed from the websites and followed up directly with the food industries and their association.
2.4. Statistical analysis
For all food categories studied, the proportion of products with sodium content below national targets was calculated at baseline and between 2012 and 2013 when the target was to have been met. Central tendency measures of sodium content in each food category were also calculated at the same time points (means and medians, as well as their respective SDs and maximum and minimum sodium levels). Based on variable distribution, verified through the Kolmogorov‐Smirnov normality test, Student or Mann‐Whitney tests were used to verify the significance changes of the mean or median differences from baseline to the annual monitoring times (P<.05). All statistical analyses were conducted using Sigma Stat 3.02 (Systat Software Inc) and Stata 12 (Stata Corp).
3. RESULTS
3.1. Proportion of products meeting the voluntary targets
Twenty‐one food categories were included in the first three agreements for sodium reduction in Brazil. The sodium content of 1036 products from ABIA participant industries was collected at baseline (2011) and data from 1234 products were collected by the end of the first biennium after target setting (2012/2013). The proportion of products that achieved the national sodium reduction targets increased from 2011 to 2012 and 2013 in all food categories. In 2013 (the deadlines for the first sodium reduction target), over 85% of the products complied with the targets (Table 2). In eight food categories, all products in the market met the targets: buns, cake rolls, aerated cake mixes, corn snacks, salted and sweet crackers, and paste and rice condiments.
Table 2.
Proportion of food products with sodium content below the first sodium reduction targets at baseline (2011) and 2 years after target agreements (2012–2013)
| Food category | 2011, % | 2012/2013, % |
|---|---|---|
| First agreement | ||
| Instant pastas (ramen) | 36.6 | 94.9 |
| Buns | 69.2 | 100.0 |
| Loaf breads | 95.9 | 97.7 |
| Second agreement | ||
| Cakes without filling | 79.7 | 98.5 |
| Cakes with filling | 68.3 | 95.6 |
| Cake rolls | 87.1 | 100.0 |
| Aerated cake mixesa | 92.3 | 100.0 |
| Creamy cake mixesa | 88.5 | 95.0 |
| Corn snacks | 84.0 | 100.0 |
| Potato chips | 81.8 | 96.4 |
| Mayonnaise | 87.1 | 100.0 |
| Sweet crackers | 76.4 | 100.0 |
| Salted crackers | 79.5 | 100.0 |
| Filled cookies | 95.4 | 99.5 |
| Third agreement | ||
| Breakfast cereals | 81.5 | 85.7 |
| Margarines | 77.3 | 98.8 |
| Cube and powder salt‐based condimentsb | 74.4 | 96.1 |
| Paste salt‐based condiments | 85.7 | 100.0 |
| Rice salt‐based condiments | 80.0 | 100.0 |
| Other salt‐based condiments | 73.3 | 88.2 |
a and bTargets for these products were set based on their sodium content in the food as consumed and not as sold.
Even in food categories with higher sodium content (containing >400 mg/100 g sodium, eg, instant pastas, loaf bread, buns, mayonnaise, corn snacks, potato chips, breakfast cereals, salted crackers, and salt‐based condiments), the proportion of products meeting the official targets increased in 2012 and 2013.
3.2. Change in mean sodium content for each food category over time
The mean sodium content of the same 21 food categories was evaluated at baseline and 2 years after target setting.
Table 3 shows the measures of central tendency of sodium content of food products in 2011 and 2012/2013. All food categories had reductions in both sodium content means and medians, with the reduction achieving statistical significance in nine (P<.05): instant pastas, industrialized loaf breads, ready‐to‐eat cakes (with and without filling), aerated cake mixes, cake rolls, mayonnaise, sweet and salted crackers, paste salt‐based condiments, and rice salt‐based condiments.
Table 3.
Sodium content of food categories at baseline and at the first monitoring, Brazil 2011–2012 and 2013
| Food categories | Portion size, g | Sodium content at baseline (mg/100 g) | Sodium content after the first biennium (mg/100 g) | P Value | ||||
|---|---|---|---|---|---|---|---|---|
| No. | Mean±SD | Median (minimum–maximum) | No. | Mean±SD | Median (minimum–maximum) | |||
| Instant pastasa | 85 | 90 | 1960.0±384.5 | 1993.5 (1104.9–2729.1) | 97 | 1662.3±265.7 | 1670.0 (1057.5–2548.6) | <.001e |
| Loaf breadsa | 50 | 117 | 426.5±107.1 | 432.0 (118.0–796.0) | 87 | 380.3±122.1 | 380.0 (126.0–870.0) | <.001d |
| Bunsa | 50 | 8 | 436.1±121.4 | 462.0 (260.0–570.0) | 9 | 388.5±74.4 | 415.0 (270.0–462.0) | .353d |
| Cakes without fillingb | 50 | 64 | 335.7±66.7 | 355.0 (188.3–462.9) | 68 | 282.7±85.5 | 304.0 (117.00–398.3) | <.001e |
| Cakes with fillingb | 50 | 41 | 249.9±51.4 | 240.0 (106.9‐330.0) | 68 | 212.3±46.9 | 224.0 (108.30‐330.0) | <.001e |
| Cake rollsb | 50 | 14 | 204.5±32.2 | 210.0 (156.7–240.0) | 17 | 161.3±20.4 | 153.0 (121.7–220.0) | <.001d |
| Aerated cake mixesb | 35 | 125 | 372.3±173.4 | 313.9 (166.7–1111.5) | 201 | 310.6±72.7 | 327.0 (117.0–652.0) | .07e |
| Creamy cake mixesb | 35 | 26 | 268.4±76.3 | 280.0 (135.0–412.0) | 40 | 252.6±54.3 | 251.0 (69.0–404.0) | .24e |
| Corn snacksb | 25 | 65 | 831.9±226.1 | 840.0 (351.0–1288.0) | 39 | 753.9±140.1 | 756.0 (352.00–1032.0) | .10e |
| Potato chipsb | 25 | 22 | 547.6±123.6 | 598.0 (305.0–720.0) | 28 | 513.9±130.8 | 516.0 (276.0–700.0) | .35d |
| Mayonnaiseb | 12 | 31 | 1063.9±198.2 | 1058.3 (741.7–1566.7) | 41 | 891.7±157.8 | 925.0 (400.0–1075.0) | <.001d |
| Sweet crackersb | 30 | 17 | 359.2±81.3 | 386.7 (213.3–490.0) | 45 | 318.2±50.3 | 317.0 (236.7–416.0) | .05e |
| Salted crackersb | 30 | 39 | 695.8±260.8 | 686.7 (83.3–1136.7) | 94 | 660.9±147.1 | 633.0 (350.0–923.0) | .38e |
| Filled cookiesb | 30 | 176 | 259.5±65.9 | 251.7 (140.0–600.0) | 198 | 242.6±48.9 | 243.0 (127.0–390.0) | .03e |
| Breakfast cerealsc | 30 | 27 | 428.9±141.8 | 430.0 (132.0–676.7) | 21 | 406.6±129.9 | 392.5 (195.0–679.3) | .58d |
| Margarinesc | 10 | 93 | 737.1±364.6 | 720.0 (40.0–1660.0) | 83 | 684.6±350.6 | 710.0 (0.0–1660.0) | .33d |
| Powder and cube bouillonsc | 5 | 41 | 1.035.9±94.4 | 1015.0 (900.0–1247.0) | 26 | 985.5±105.8 | 1.019.0 (705.0–1183.0) | .04d |
| Paste condimentsc | 5 | 14 | 33.494.5±4054.4 | 33450.0 (26840.0–40700.0) | 14 | 32900.0±3173.6 | 33.850.0 (26840.0–37280.0) | .67d |
| Rice condimentsc | 5 | 5 | 31.425.2±3009.7 | 32120.0 (26.186.0–33800.0) | 4 | 29530.0±6140.7 | 3.2370.0 (20340.0–33040.0) | .56d |
| Other salt‐based condimentsc | 5 | 15 | 21157.3±3595.3 | 21820.0 (16360.0–25960.0) | 51 | 17697.7±5420.7 | 18420.0 (7540.0–36660.0) | .02d |
Considering the food categories of the first agreement, the mean sodium content was reduced 6.6% for instant pastas (1960.0–1662.3 mg/100 g), 10.8% for loaf bread (426.5–380.3 mg/100 g), and 12.2% for buns (436.1–388.5 mg/100 g) from 2011 to 2012. Figures 1 and 2 show that the interquartile range and its extreme upper values shift to lower sodium levels for all three categories.
Figure 1.
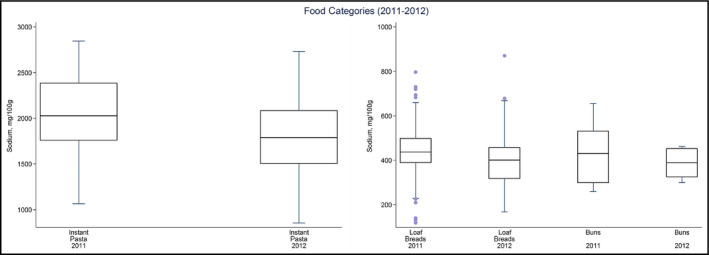
Distribution of sodium values from 2011 to 2012 for instant pastas, industrialized loaf bread, and buns. The box displays the interquartile range, and the median value is marked as a line within the box. The lines extending above and below the box indicate the most extreme value within the 75th percentile+1.5x (interquartile range) and the 25th percentile−1.5x (interquartile range), and additional values outside of this range are marked as circles
Figure 2.

Distribution of sodium values from 2011 to 2012 for corn snacks, potato chips, mayonnaise, cookies and crackers, cakes, and cake mixes. The box displays the interquartile range, and the median value is marked as a line within the box. The lines extending above and below the box indicate the most extreme value within the 75th percentile+1.5x (interquartile range) and the 25th percentile−1.5x (interquartile range), and additional values outside of this range are marked as circles
Similar results were found for the products of the second agreement, comparing 2011 to 2013. The mean sodium content was reduced 15.8% for ready‐to‐eat cakes without filling, 15.0% for ready‐to‐eat cakes with filling, and 21.1% for cake rolls. For aerated cake mixes, there was a 16.5% reduction in mean sodium content, and for creamy cake mixes there was a 5.9% reduction in mean sodium content. The mean sodium content was reduced 9.4% for corn snacks, 6.1% for potato chips, and 16.2% for mayonnaise. The mean sodium content fell 11.4% for sweet crackers, while it declined 5.0% for salted crackers and 6.5% for filled cookies. Figures 1,2 and 3display these mean reductions and also the diminution of interquartile ranges of sodium content for most food categories and the lowering of the extreme upper values of interquartile ranges for all analyzed categories.
Figure 3.

Distribution of sodium values from 2011 to 2013 for breakfast cereals, margarines, cube and powder bouillons, paste, rice, and other salt‐based condiments. The box displays the interquartile range, and the median value is marked as a line within the box. The lines extending above and below the box indicate the most extreme value within the 75th percentile+1.5x (interquartile range) and the 25th percentile−1.5x (interquartile range), and additional values outside of this range are marked as circles
The mean sodium content was also reduced in all food categories of the third agreement from 2011 to 2013: 5.2% for breakfast cereals, 7.1% for margarines, 4.8% for cube and powder bouillons, 1.8% for paste condiments, 6.0% for rice condiments, and 16.3% for other salt‐based condiments. The interquartile range of sodium content was reduced in all food categories, except rice condiments, while its extreme upper values of the interquartile range were lowered in all cases except for other salt‐based condiments (Figures 6 and 7).
4. DISCUSSION
Our study has found substantive reductions in the sodium content of Brazilian processed foods within 2 years of the setting of voluntary sodium reduction targets. The sodium content in all food categories decreased although the reduction in all food categories did not achieve statistical significance. Although the Brazilian program appears successful, it is estimated that serial biannual reductions will be required until 2020 to achieve optimal sodium levels.
Previous findings of the impact of sodium reduction in processed foods in Brazil15 acknowledge that sodium reduction in processed foods cannot lead by itself to the necessary reductions in dietary sodium intake of Brazilians, as much of the dietary sodium comes from discretionary sources. However, the possible impacts were underestimated because of limitations in food composition data for processed products (based on outdated tables or information from other countries) and considering targets as average sodium levels instead of maximum sodium content of food categories.16
The discussion about the effectiveness of voluntary and regulatory approaches to sodium reduction has been intense internationally, especially after countries such as Argentina and South Africa implemented legislation setting maximum sodium levels for strategic foods.17 Nevertheless, the difficulties in implementing these legislative processes have led most countries, including Brazil, to initiate sodium reduction through voluntary approaches with food industries, based on the successful experience of countries such as the United Kingdom18, 19 and Australia.20 There have also been important regional efforts to incentive countries to move forward in sodium reduction, as the Pan American Health Organization's regional targets for sodium reduction built from country targets existent in the Americas,21 followed by the adoption of these same targets by countries in regional markets such as Mercosul.22
The progress to this point regarding sodium reduction in Brazil is reflected by the high percentage of products that comply with the targets and by the lowering of mean sodium content of food categories and changes in their sodium content distribution, which have led to improvements in the overall nutrient profile of processed foods. Further, after the release of the monitoring results, all companies with products that had not been found to achieve the maximum sodium targets have clarified that the products had in fact achieved the targets when officially asked to justify their noncompliance.
Because of the large market share of the food companies that belong to the ABIA (60% to almost 100% of the market share depending on the food category), the voluntary targets are expected to have a large impact on processed food supply. According to information provided by food industries, all three agreements have reduced the use of sodium in food production by 11 297 tons until 2013 and 14 893 tons until the end of 2014. All agreements set until 2015 are estimated to reduce 28 562 tons of sodium in food supply until 2020.
Because of the complex functional roles of sodium in processed foods (eg, preservation and shelf life to sensorial characteristics, such as taste and crustiness, and performance of food processes [such as dough growth]), there are many technologic challenges and limitations to the extent of sodium reduction. Nevertheless, the process of setting maximum sodium levels in processed foods has also encouraged companies to develop new technologies in food production, including sodium substitutes and alternative production methods.
Although the initial results are encouraging, it needs to be considered whether the targets should be expanded to reach the whole market, by enrolling companies that are not in the ABIA. Argentina's experience in using the voluntary targets prior to setting regulatory levels for sodium content may provide new options for countries including Brazil in transiting to a mixed voluntary‐regulatory approach.23
National and international discussions, based on the experience of countries such as Canada,24 have also raised the possibility of also incorporating targets related to the mean sodium content of food categories and the use of sales‐adjusted analysis. As a result, there could be a more extensive impact of sodium reduction in the food supply.20
5. STUDY LIMITATIONS
The limitations of this study and of the impacts of voluntary sodium reductions in Brazil are that: (1) the agreements are limited to companies that belong to ABIA (the Brazilian Association of Food Industries), which correspond to over 60% of the national food supply but does not cover all food producers in the country; (2) results are based on food labels for sodium content, because of limited updated food composition data from laboratory analysis; (3) dietary sodium reduction through maximum targets for processed foods depends on keeping or reducing food consumption in relation to baseline in order to impact sodium intake; and (4) considering the first 2 years of monitoring, relatively small reductions in sodium content targets have been achieved, so further reductions will increase the impact of the targets on sodium consumption.
Processed food reformulation will contribute to reducing the sodium intake of the Brazilian population, but because much of the dietary sodium in Brazil is not from processed foods, a more comprehensive approach is required for achieving larger reductions. Other strategies for reducing dietary sodium and increasing potassium and magnesium from food may also contribute to the reduction of blood pressure and cardiovascular diseases. In Brazil, the more comprehensive approach includes the promotion of healthy diets (including the reduction of discretionary salt use), promotion of healthy environments (especially in schools), food regulation, and approaches regarding food services and restaurants.
6. CONCLUSIONS
The data presented here provide a synthesis of the initial objective evaluation of sodium reduction in processed foods in Brazil. These results show that the voluntary approach to setting sodium reduction targets is leading to a gradual reduction of sodium content in processed foods categories, although it is expected that optimal reductions will not be achieved until 2020. Ongoing monitoring will be used to set new targets as well as monitoring compliance with established targets. Our study does not clarify whether voluntary approaches will be more successful or less successful than regulatory approaches or whether voluntary approaches should evolve into regulations to help prevent loss of compliance to targets over time. For example, currently in the United Kingdom, threats to the continuity of the impact of voluntary sodium reductions have been identified.25 It is also likely, nevertheless, that starting with voluntary strategies may allow food industries to adapt their products and develop new technologies and alternatives, so regulation could follow in order to gradually reach the whole food supply and allow proper enforcement instruments to national and local surveillance agents. Therefore, policymakers, health authorities, and civil society must closely follow up and monitor the results of voluntary reductions to guarantee the continuity and sustainability of sodium reductions and ensure the correct timing in the case of need for more stringent, regulatory strategies.
CONFLICT OF INTEREST
The authors declare no conflicts of interest.
Nilson EAF, Spaniol AM, Gonçalves VSS, et al. The impact of voluntary targets on the sodium content of processed foods in Brazil, 2011–2013. J Clin Hypertens. 2017; 19:939–945. 10.1111/jch.13044
REFERENCES
- 1. Ministério da Saúde . Plano de Ações Estratégicas Para o Enfrentamento das Doenças Crônicas Não Transmissíveis (DCNT) no Brasil 2011‐2022. Brasília, Brasil; 2011. http://actbr.org.br/uploads/conteudo/918_cartilha_dcnt.pdf. Accessed December 30, 2016. [Google Scholar]
- 2. Sarno F, Claro RM, Levy RB, et al. Estimated sodium intake for the Brazilian population, 2008‐2009. Rev Saude Publica. 2013;47:571‐578. [DOI] [PubMed] [Google Scholar]
- 3. Instituto Brasileiro de Geografia e Estatística . Pesquisa de orçamentos familiares 2008–2009—aquisição domiciliar per capita. Brasil; 2010. [Google Scholar]
- 4. Oliveira MM, Malta DC, Santos MA, Oliveira TP, Nilson EA, Claro RM. Self‐reported high salt intake in adults: data from the National Health Survey, Brazil, 2013. Epidemiol Serv Saúde. 2015;24:249‐256. [Google Scholar]
- 5. Brown IJ, Tzoulaki I, Candeias V, et al. Salt intakes around the world: implications for public health. Int J Epidemiol. 2009;38:791‐813. [DOI] [PubMed] [Google Scholar]
- 6. Nilson EA. The strides to reduce salt intake in Brazil: have we done enough? Cardiovasc Diagn Ther. 2015;5:243‐247. [DOI] [PMC free article] [PubMed] [Google Scholar]
- 7. Houston MC, Harper KJ. Potassium, magnesium, and calcium: their role in both the cause and treatment of hypertension. J Clin Hypertens (Greenwich). 2008;10:3‐11. [DOI] [PMC free article] [PubMed] [Google Scholar]
- 8. WHO . Guideline: Potassium Intake for Adults and Children. Geneva: World Health Organization; 2012. [PubMed] [Google Scholar]
- 9. Wyness L, Butriss JL, Stanner SA. Reducing the population's sodium intake: the UK Food Standards Agency's salt reduction programme. Public Health Nutr. 2011;15:254‐261. [DOI] [PubMed] [Google Scholar]
- 10. Nilson EA, Jaime PC, Resende DO. Iniciativas desenvolvidas no Brasil para a redução do teor de sódio em alimentos processados. Rev Panam Salud Pública. 2012;32:287‐292. [DOI] [PubMed] [Google Scholar]
- 11. Brasil Ministério da Saúde . Termo de Compromisso com a Finalidade de Estabelecer Metas Nacionais Para a Redução do Teor de Sódio em Alimentos Processados no Brasil. Brasília; 2011. http://189.28.128.100/dab/docs/portaldab/documentos/termo_abia_abip_abima_abitrigo_2011.pdf. Accessed December 30, 2016. [Google Scholar]
- 12. Brasil Ministério da Saúde . Termo de Compromisso com a Finalidade de Estabelecer Metas Nacionais Para a Redução do Teor de Sódio em Alimentos Processados no Brasil. Brasília; 2011. http://189.28.128.100/dab/docs/portaldab/documentos/termo_5_dez_2011.pdf. Accessed December 30, 2016. [Google Scholar]
- 13. Brasil Ministério da Saúde . Termo de Compromisso com a Finalidade de Estabelecer Metas Nacionais Para a Redução do Teor de Sódio em Alimentos Processados no Brasil. Brasília; 2012. http://189.28.128.100/dab/docs/portaldab/documentos/termo_6_ago_2012.pdf. Accessed December 30, 2016. [Google Scholar]
- 14. Brasil Ministério da Saúde . Termo de Compromisso com a finalidade de estabelecer metas nacionais para a redução do teor de sódio em alimentos processados no Brasil. Brasília; 2013. http://189.28.128.100/dab/docs/portaldab/documentos/termo_nov_2013.pdf. Accessed December 30, 2016. [Google Scholar]
- 15. Souza AM, Souza B, Bezerra IN, Sichieri R. The impact of the reduction of sodium content in processed foods in salt intake in Brazil. Cad Saúde Pública. 2016;32:1‐7. [DOI] [PubMed] [Google Scholar]
- 16. Nilson EA, Spaniol AM, Gonçalves VS. Reducing sodium intake in Brazil—A redução do consumo de sódio no Brasil. Cad Saúde Pública [Internet]. 2016;32:e00102016. [DOI] [PubMed] [Google Scholar]
- 17. Webster J, Trieu K, Dunford E, Hawkes C. Target salt 2025: a global overview of national programs to encourage the food industry to reduce salt in foods. Nutrients. 2014;6:3274‐3287. [DOI] [PMC free article] [PubMed] [Google Scholar]
- 18. Sadler K, Nicholson S, Steer T, et al. National Diet and Nutrition Survey—Assessment of Dietary Sodium in Adults (Aged 19 to 64 Years) in England. London, England: Department of Health; 2011. [Google Scholar]
- 19. Collins M, Mason H, O'Flaherty M, Guzman‐Castillo M, Critchley J, Capewell S. An economic evaluation of salt reduction policies to reduce coronary disease in England: a policy modeling study. Value Health. 2014;17:517‐524. [DOI] [PubMed] [Google Scholar]
- 20. Trevena H, Neal B, Dunford E, Wu JHY. Na evaluation of the effects of the Australian food and health dialogue targets on the sodium content of bread. Breakfast cereals and processed meats. Nutrients. 2014;6:3802‐3817. [DOI] [PMC free article] [PubMed] [Google Scholar]
- 21. Campbell N, Legowski B, Legetic B, Nilson E, L'Abbé M. Inaugural maximum values for sodium in processed food products in the Americas. J Clin Hypertens (Greenwich). 2015;17:611‐613. [DOI] [PMC free article] [PubMed] [Google Scholar]
- 22. Mercosul . Mercosul/RMS/Acordo No 02/2015. Recomendações de Políticas e Medidas Regulatórias para a Redução do Consumo de Sódio; 2015. file:///D:/Users/eduardo/Downloads/ACORDO%20REDU%C3%87%C3%83O%20DO%20CONSUMO%20DE%20S%C3%93DIO_PT.pdf. Accessed December 30, 2016.
- 23. Allemandi L, Tiscornia MV, Ponce M, Castrouovo L, Dunford E. Sodium content in processed foods in Argentina: compliance with the national law. Cardiovasc Diagn Ther. 2015;5:197‐206. [DOI] [PMC free article] [PubMed] [Google Scholar]
- 24. Health Canada . Guidance for the Food Industry on Reducing Sodium in Processed Food; 2012. http://www.hc-sc.gc.ca/fn-an/alt_formats/pdf/legislation/guide-ld/2012-sodium-reduction-indust-eng.pdf. Accessed December 30, 2016. [Google Scholar]
- 25. MacGregor G, He F, Pombo‐Rodrigues S. Food and the responsibility deal: how the salt reduction strategy was derailed. BMJ. 2016;350:1‐5. [DOI] [PubMed] [Google Scholar]