

Abstract
Blood pressure (BP) changes and risk factors associated with pulse pressure (PP) increase in elderly people have rarely been studied using ambulatory blood pressure monitoring (ABPM). The aim is to evaluate 10‐year ambulatory blood pressure (ABP) changes in older hypertensives, focusing on PP and its associations with mortality. An observational study was conducted on 119 consecutive older treated hypertensives evaluated at baseline (T0) and after 10 years (T1). Treatment adherence was carefully assessed. The authors considered clinical parameters at T1 only in survivors (n = 87). Patients with controlled ABP both at T0 and T1 were considered as having sustained BP control. Change in 24‐hour PP between T0 and T1 (Δ24‐hour PP) was considered for the analyses. Mean age at T0: 69.4 ± 3.7 years. Females: 57.5%. Significant decrease in 24‐hour, daytime, and nighttime diastolic BP (all P < .05) coupled with an increase in 24‐hour, daytime, and nighttime PP (all P < .05) were observed at T1. Sustained daytime BP control was associated with lower 24‐hour PP increase than nonsustained daytime BP control (+2.23 ± 9.36 vs +7.79 ± 8.64 mm Hg; P = .037). The association between sustained daytime BP control and Δ24‐hour PP remained significant even after adjusting for age, sex, and 24‐hour PP at T0 (β=0.39; P = .035). Both 24‐hour systolic BP and 24‐hour PP at T0 predicted mortality (adjusted HR 1.07, P = .001; adjusted HR 1.25, P < .001, respectively). After ROC comparison (P = .001), 24‐hour PP better predicted mortality than 24‐hour systolic BP. The data confirm how ABP control affects vascular aging leading to PP increase. Both ambulatory PP and systolic BP rather than diastolic BP predict mortality in older treated hypertensives.
Keywords: aging, ambulatory blood pressure monitoring, ambulatory pulse pressure, blood pressure control, elderly
1. INTRODUCTION
Hypertension is one of the main cardiovascular (CV) risk factors for morbidity and mortality, particularly in older people.1 In this particular population, office blood pressure monitoring (OBPM) is less accurate than ambulatory blood pressure monitoring (ABPM) in reflecting actual blood pressure (BP) values.2 Indeed, ABPM has a stronger diagnostic and prognostic role in elderly.3, 4, 5 Nevertheless, few studies have evaluated BP changes over the years using ABPM in elderly people and the role of different CV risk factors on BP changes over time is still unclear in this particular population.6
Pulse pressure (PP) represents a relevant BP parameter, particularly in older populations.7, 8 PP increases with age and it is a well‐known independent predictor of CV events and mortality, especially in patients aged 60 years or older.9, 10 The determinants of PP change over time and their associations with outcome have not been clearly described yet, especially in older populations. An office cutoff point of at least 60 mm Hg for PP is considered a marker of increased arterial stiffness and an asymptomatic organ damage in older hypertensives, according to the latest European Society of Hypertension (ESH) guidelines.11 Ambulatory PP better predicts CV morbidity and mortality compared to office PP in elderly patients.12, 13, 14, 15, 16 Nevertheless, most of the scientific evidence on PP in elderly population comes from OBPM data.17 Therefore, we aimed to evaluate changes in ambulatory blood pressure (ABP) parameters over a period of 10 years, especially focusing on ambulatory PP and its associations with mortality, in older treated hypertensives.
2. METHODS
2.1. Study design and population
This observational study was conducted on 119 consecutive outpatients referred to our Hypertension Centre for BP evaluation. We considered all consecutive outpatients referred between January 2006 to December 2006 for the first medical visit (T0), according to inclusion and exclusion criteria. All surviving patients underwent a reevaluation 10 years later (T1) after recall. We considered the following inclusion criteria: age ≥ 65 years, a valid 24‐hour ABPM at baseline (T0), and diagnosis of essential hypertension, made after exclusion of secondary forms of hypertension according to the latest ESH guidelines.11 We excluded patients with atrial fibrillation, advanced cancer, and dementia. All participants were treated with antihypertensive drugs. Patients with low adherence to prescribed therapy were also excluded, after testing with the modified Morisky Medical Adherence Scale.18 We have considered medical examination, laboratory, and ABPM parameters both at T0 and T1. All participants gave their informed written consent and clinical investigations have been conducted according to the principles expressed in the Declaration of Helsinki. This study was approved by the local institutional ethics committee.
2.2. Clinical and laboratory parameters
We evaluated the following clinical parameters: patients' medical history, laboratory measurements, anthropometric measurements, and ABPM parameters. Smoking status was ascertained during recruitment and smoking habit was defined as current smoking or previous smoking of at least 100 cigarettes in a lifetime.19
We considered the following laboratory parameters from venous blood: creatinine, estimated glomerular filtration rate (eGFR), serum sodium and potassium, total cholesterol (TC), low‐density lipoprotein cholesterol (LDLc), high‐density lipoprotein cholesterol (HDLc), triglycerides, and fasting glycemia. The eGFR was estimated using the Modification of Diet in Renal Disease study equation20 taking into account the measurement of creatinine by Jaffe's reaction.21 Calculated LDLc concentration was estimated using the method proposed by Martin and colleagues.22
2.3. Blood pressure measurements and antihypertensive drug therapy evaluation
During the clinical visits, we performed 3 sequential oscillometric automatic BP measurements on both arms, using validated devices (Microlife® model BP3MQ1‐2D and BP A200 AFib, Widnau, Switzerland). Correct cuff sizes (range 22‐32 cm or 32‐42 cm) were selected according to arm circumference and BP measurements were performed after at least 5 minutes of rest in the sitting position. The patient's arm was kept at the heart level during the measurement. The arm with the higher reading was considered for the analysis and used to place the ABPM.12 A 24‐hour ABPM was performed using Spacelabs 90207 and 90217 (SpaceLabs Healthcare, Snoqualmie, WA), with appropriate cuff and bladder dimensions according to the arm circumference. Minimum quality criteria considered for a satisfactory ABPM recording were based on recommendations by Omboni and colleagues.23 For each patient, 24‐hour BP, daytime BP (defined as the BP values from 06:00 to 22:00 hour), nighttime BP (defined as the BP values from 22:00 to 06:00 hour), and PP (defined as the difference between systolic BP and diastolic BP) were considered. The definitions of “day” and “night” periods in our center were based on the most common answers to a questionnaire in which patients were asked about their sleeping behavior. Patients with mean 24‐hour BP < 130/80 mm Hg, mean daytime BP < 135/85 mm Hg, and mean nighttime BP < 120/70 mm Hg were defined as controlled by therapy.11 We considered dippers those patients with a decline in mean BP levels from day to night equal to or greater than 10%. Patients with controlled ABP both at T0 and at T1 were considered as having sustained BP control. A treatment intensity score (TIS) was calculated to allow comparison of drug regimens across patients taking many different combinations of medications. As previously reported,24 the daily dose taken recorded by the patient was divided by the maximum recommended daily dose to obtain a proportional dose (called “intensity”) for that medication. For example, a patient taking an 80‐mg daily dose of a drug for which 160 mg is the “maximum daily dose” recommended was considered to be taking 0.5 “intensity” units. For completeness, dual‐class drugs were separated into their components, and intensity was calculated separately for each chemical compound. The maximum recommended daily doses set by the Italian National Drug Agency (AIFA) were used for calculations. The sum of all the different values was recorded as TIS. We identified patients who have increased or decreased drug therapy (evaluated by ΔTIS, defined as mean TIS at T1—mean TIS at T0) and patients whose therapy remained unchanged.
2.4. Statistical analysis
Data were analyzed with the Statistical Package for the Social Sciences version 13 (SPSS Inc., Chicago, IL). A value of P < .05 was defined as statistically significant. Normal continuous variables were expressed as mean ± SD. Skewed variables were expressed as median and interquartile range. Categorical variables were expressed as absolute number and percentage. PP was considered a continuous variable. Change in 24‐hour PP between T0 and T1 (Δ24‐hour PP) was also used for the analyses. The chi‐square test was used to analyze the differences between categorical variables. The unpaired t test (or Mann‐Whitney test for nonparametric variables) was used to compare quantitative variables. The differences between T0 and T1 were assessed by paired t test, Wilcoxon signed‐rank test, and McNemar's test. Multiple linear regression and Cox regression analyses were used to create adjusted models. We have included in multivariate models those covariates with significant association identified on univariate analyses, plus age and sex, because of their clinical relevance. Therefore, age, sex, and 24‐hour PP at T0 were included in the multivariate linear regression for Δ24‐hour PP, whereas age, sex, HDLc, and eGFR were considered in Cox regression for mortality. We included 24‐hour PP at T0 as covariate in linear regression regarding Δ24‐hour PP in order to take into account the baseline values in this analysis. Moreover, we performed a repeated measures analysis of covariance (ANCOVA) for 24‐hour PP changes between T0 and T1. All variables included in multivariate tests were normally distributed. Area under the curve (AUC) of the receiver operating characteristic (ROC) curves was used to compare the predictive performance on mortality of 24‐hour PP and 24‐hour systolic BP at T0. Retrospective power calculation showed that our study was able to find the observed mean difference in 24‐hour PP change from T0 to T1 of 3.8 (SD = 10.9) and the observed mean difference in 24‐hour PP at T0 between survivors and deceased patients of 10.5 both with a power > 80% (α‐error of .05). All the analyses were conducted on survivors after the 10‐year period (87 patients), except for statistical analyses on mortality that were conducted in all studied population (119 patients).
3. RESULTS
3.1. Ten‐year changes in clinical and ABP parameters
Thirty‐two patients died during the 10‐year period; therefore, medical examination, laboratory tests, and ABPM at T1 were repeated only in 87 patients. Mean age of survivors (87 patients) at T0 was 69.4 ± 3.7 years, with female prevalence (57.5%). Main changes in general characteristics and laboratory parameters are summarized in Table 1. After 10 years, prevalence of type 2 diabetes mellitus significantly increased, whereas TC and LDLc levels decreased, coupled with an increase in statin use. The 10‐year changes in ABP parameters are summarized in Table 2. A significant decrease in 24‐hour, daytime, and nighttime diastolic BP coupled with an increase in 24‐hour, daytime, and nighttime PP after 10 years were observed. Prevalence of nondipper patients did not increase between T0 and T1 (42.4% and 52.9%, P = .211). Twenty‐one patients (24.1%) had no changes in antihypertensive treatment during the 10‐year period. Mean TIS significantly increased over 10 years (Table 1). Despite this increase, prevalence of uncontrolled ABP did not differ significantly between T0 and T1 (46.0% vs 50.6%, P = .585 for 24‐hour; 41.4% vs 36.8%, P = .585 for daytime; 55.2% vs 64.4%, P = .200 for nighttime, respectively). Sustained 24‐hour, daytime, and nighttime BP control were found in 51.8%, 64.8%, and 35.1% of patients, respectively. Ten‐year changes in ABP parameters of patients subgroups analyzed are described in supplemental tables (see Tables S1‐S16). Considering office BP, there were significant decreases in systolic BP (from 150.0 ± 15.2 to 145.9 ± 17.4 mm Hg; P = .046) and diastolic BP (from 86.4 ± 9.8 to 80.5 ± 10.5 mm Hg; P < .001), with no significant changes in office PP (from 63.6 ± 13.0 to 65.3 ± 13.5 mm Hg; P = .309) from T0 to T1.
Table 1.
Ten‐year changes in general characteristics and their associations with mortality
| 10‐y changes in general characteristics | General characteristics at T0 according to mortality | ||||||
|---|---|---|---|---|---|---|---|
| T0 (Survivors, n = 87) | T1 (Survivors, n = 87) | ΔT1 − T0 | P * | T0 (Survivors, n = 87) | T0 (Deceased, n = 32) | P ** | |
| Age (y) | 69.4 ± 3.7 | 79.3 ± 3.8 | +9.9 ± 1.2 | <.001 | 69.4 ± 3.7 | 76.3 ± 5.8 | <.001 |
| Smoking habit (%) | 38.8 | 32.9 | −5.9 | .125 | 38.8 | 37.5 | .906 |
| BMI (kg/m2) | 27.3 ± 3.2 | 27.3 ± 3.4 | +0.1 ± 1.3 | .518 | 27.3 ± 3.2 | 26.9 ± 2.8 | .646 |
| Type 2 diabetes mellitus (%) | 6.9 | 17.2 | +10.3 | .012 | 6.9 | 17.4 | .213 |
| TIA/stroke (%) | 8.0 | 11.5 | +3.5 | .375 | 8.0 | 9.5 | .826 |
| CAD (%) | 8.1 | 9.3 | +1.2 | 1.000 | 8.1 | 4.8 | .606 |
| PAD (%) | 75.0 | 82.7 | +7.7 | .289 | 75.0 | 90.9 | .205 |
| Lab parameters | |||||||
| TC (mg/dL) | 198.5 ± 37.7 | 177.1 ± 31.8 | −21.4 ± 33.9 | <.001 | 198.5 ± 37.7 | 183.4 ± 60.1 | .321 |
| HDLc (mg/dL) | 53.1 ± 16.7 | 54.7 ± 15.0 | +1.6 ± 12.6 | .436 | 53.1 ± 16.7 | 40.9 ± 10.8 | <.001 |
| LDLc (mg/dL) | 123.3 ± 31.1 | 99.8 ± 30.0 | −23.4 ± 29.7 | <.001 | 123.3 ± 31.1 | 116.1 ± 44.7 | .299 |
| Triglycerides (mg/dL) | 113.7 ± 47.1 | 119.8 ± 57.1 | +6.0 ± 60.0 | .517 | 113.7 ± 47.1 | 132.0 ± 63.9 | .387 |
| Glycemia (mg/dL) | 95 (90‐106) | 98 (89‐109) | \ | .861 | 95 (90‐106) | 96 (84‐119) | .921 |
| eGFR (mL/min/1.73 m2) | 67.0 ± 13.4 | 67.3 ± 16.8 | +0.3 ± 13.8 | .870 | 67.0 ± 13.4 | 54.1 ± 13.8 | <.001 |
| Drug therapy | |||||||
| TIS | 1.13 ± 1.02 | 1.37 ± 1.03 | +0.24 ± 0.94 | .019 | 1.13 ± 1.02 | 1.08 ± 0.73 | .758 |
| ACE‐I/ARB (%) | 57.5 | 100.0 | +42.5 | / | 57.5 | 65.4 | .471 |
| Diuretic (%) | 37.9 | 40.2 | +2.3 | / | 37.9 | 50.0 | .272 |
| β‐blocker (%) | 33.3 | 48.3 | +15.0 | / | 33.3 | 46.2 | .233 |
| Calcium channel blocker (%) | 27.6 | 37.9 | +10.3 | / | 27.6 | 30.8 | .752 |
| Statin (%) | 20.7 | 50.0 | +29.3 | / | 20.7 | 34.6 | .144 |
Bold values indicate significance.
ACE‐I, angiotensin converting enzyme‐inhibitor; ARB, type 1 angiotensin receptor blocker; BMI, body mass index; CAD, coronary artery disease; eGFR, estimated glomerular filtration rate; HDLc, high‐density lipoprotein cholesterol; LDLc, low‐density lipoprotein cholesterol; PAD, peripheral artery disease; TC, total cholesterol; TIA, transient ischemic attack; TIS, treatment intensity score.
Analyses for 10‐y changes: paired t test, Wilcoxon signed‐rank test, and McNemar's test. Analyses for mortality: unpaired t test, Mann‐Whitney test, and chi‐square test.
* P for 10‐y changes between T0 and T1 (survivors, n = 87).
** P for mortality between characteristics of survivors (n = 87) and deceased (n = 32) at T0.
Table 2.
Ten‐year changes in ABP parameters (87 patients)
| T0 | T1 | ΔT1 − T0 | P | |
|---|---|---|---|---|
| 24‐h SBP (mm Hg) | 128.6 ± 13.5 | 128.9 ± 14.2 | +0.4 ± 16.1 | .842 |
| 24‐h DBP (mm Hg) | 73.4 ± 9.3 | 69.9 ± 7.7 | −3.5 ± 8.1 | <.001 |
| 24‐h PP (mm Hg) | 55.2 ± 9.4 | 59.1 ± 12.5 | +3.8 ± 10.9 | .002 |
| Daytime SBP (mm Hg) | 131.0 ± 13.7 | 131.7 ± 15.5 | +0.7 ± 17.9 | .698 |
| Daytime DBP (mm Hg) | 75.7 ± 9.3 | 72.0 ± 8.4 | −3.6 ± 9.3 | <.001 |
| Daytime PP (mm Hg) | 55.3 ± 9.7 | 59.7 ± 13.1 | +4.4 ± 11.4 | <.001 |
| Nighttime SBP (mm Hg) | 122.4 ± 15.3 | 123.5 ± 14.9 | +1.1 ± 16.3 | .525 |
| Nighttime DBP (mm Hg) | 67.7 ± 9.8 | 64.3 ± 8.4 | −3.5 ± 8.8 | <.001 |
| Nighttime PP (mm Hg) | 54.8 ± 10.3 | 57.9 ± 15.2 | +3.1 ± 14.1 | .041 |
Bold values indicate significance.
ABP, ambulatory blood pressure; DBP, diastolic blood pressure; PP, pulse pressure; SBP, systolic blood pressure.
Paired t test.
3.2. Ten‐year changes in ambulatory PP and associations with CV risk factors
Mean Δ24‐hour PP was +3.8 ± 10.9 mm Hg. No association emerged between Δ24‐hour PP and age (P = .856), sex (P = .309), body mass index (BMI; P = .549), smoking habit (P = .250), and type 2 diabetes mellitus (P = .262). Dipping pattern did not affect 24‐hour PP change (P = .559). Moreover, no laboratory parameters considered was associated with Δ24‐hour PP (P = .193 for TC, P = .724 for HDLc, P = .200 for LDLc, P = .830 for triglycerides, P = .229 for eGFR, and P = .843 for fasting glycemia). Sustained daytime BP control was the only variable significantly associated with 24‐hour PP change (Figure 1, Panel A and B). This association was almost significant in a linear regression model after adjusting for age, sex, and 24‐hour PP at T0 (β = .39; P = .035). No association emerged between ΔTIS and Δ24‐hour PP (P = .531). Moreover, Δ24‐hour PP did not differ by classes of antihypertensive drugs considered (P = .978 for ACE‐I/ARB, P = .231 for diuretics, P = 1.000 for β‐blockers, P = .880 for calcium channel blockers, respectively).
Figure 1.
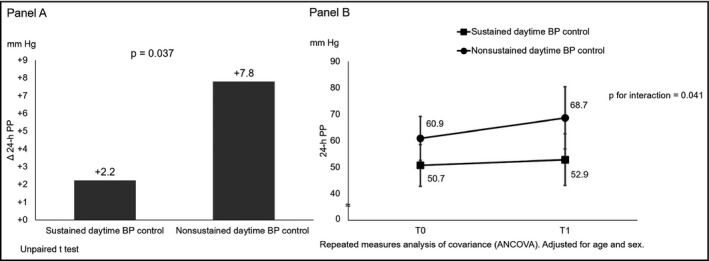
Sustained daytime BP control and 24‐h PP change over 10 y. Panel A, Sustained daytime BP control and Δ24‐h PP. Panel B, 10‐y change in 24‐h PP according to sustained daytime BP control. BP, blood pressure; PP, pulse pressure
3.3. Ambulatory BP parameters and mortality
Among 119 consecutive elderly outpatients considered, 32 (26.9%) died during the 10‐year period. Deceased patients were older than survivors, whereas sex did not affect mortality. Lower HDL levels and lower eGFR were associated with a higher risk of death (Table 1). No association emerged with other laboratory parameters or CV risk factors analyzed. Deceased patients had higher 24‐hour, daytime, and nighttime systolic BP and higher 24‐hour, daytime, and nighttime PP at T0 compared to survivors (Table 3). Ambulatory PP and systolic BP were found to predict mortality even after adjusting for covariates (Table 4). The relationship with mortality also emerged for office PP at T0 (univariate analysis: HR 1.05, P = .007; adjusted for age, sex, eGFR, and HDLc: HR 1.05; P = .006). After performing ROC analysis, AUC for 24‐hour PP at T0 was 0.78 (95% CI 0.69‐0.87; P < .001), whereas AUC for 24‐hour systolic BP at T0 was 0.65 (95% CI 0.54‐0.76, P = .006). Comparing the 2 AUC, 24‐hour PP better predicted mortality than 24‐hour systolic BP (Figure 2). Fifty‐five mm Hg was found to be the best cutoff point for 24‐hour PP in our study (maximal Youden's index = 0.45), able to predict mortality with a sensitivity of 91% and a specificity of 54%.
Table 3.
Ambulatory BP values at T0 and mortality (n = 119)
| Survivors (n = 87) | Deceased (n = 32) | P | |
|---|---|---|---|
| 24‐h SBP (mm Hg) | 128.6 ± 13.5 | 135.6 ± 13.1 | .012 |
| 24‐h DBP (mm Hg) | 73.4 ± 9.3 | 70.0 ± 9.0 | .075 |
| 24‐h PP (mm Hg) | 55.2 ± 9.4 | 65.7 ± 9.9 | <.001 |
| Daytime SBP (mm Hg) | 131.0 ± 13.7 | 137.2 ± 13.1 | .029 |
| Daytime DBP (mm Hg) | 75.7 ± 9.3 | 72.0 ± 8.9 | .058 |
| Daytime PP (mm Hg) | 55.3 ± 9.7 | 65.2 ± 10.0 | <.001 |
| Nighttime SBP (mm Hg) | 122.4 ± 15.3 | 130.6 ± 19.1 | .018 |
| Nighttime DBP (mm Hg) | 67.7 ± 9.8 | 66.6 ± 9.0 | .607 |
| Nighttime PP (mm Hg) | 54.8 ± 10.3 | 64.1 ± 16.2 | <.001 |
Bold values indicate significance.
BP, blood pressure; DBP, diastolic blood pressure; PP, pulse pressure; SBP, systolic blood pressure.
Unpaired t test.
Table 4.
Cox regression for mortality (n = 119)
| HR (95% CI)a | HR (95% CI)b | HR (95% CI)c | |
|---|---|---|---|
| 24‐h PP | 1.17 (1.11‐1.25)** | 1.21 (1.13‐1.29)** | 1.25 (1.15‐1.36)** |
| Daytime PP | 1.16 (1.10‐1.15)** | 1.19 (1.12‐1.27)** | 1.24 (1.14‐1.34)** |
| Nighttime PP | 1.11 (1.06‐1.16)** | 1.12 (1.06‐1.17)** | 1.12 (1.01‐1.19)** |
| 24‐h SBP | 1.05 (1.01‐1.08)* | 1.05 (1.02‐1.08)* | 1.07 (1.03‐1.11)* |
| Daytime SBP | 1.04 (1.01‐1.07)* | 1.04 (1.02‐1.07)* | 1.06 (1.03‐1.10)* |
| Nighttime SBP | 1.02 (0.99‐1.05) | 1.03 (1.00‐1.06)* | 1.03 (0.99‐1.06) |
eGFR, estimated glomerular filtration rate; HDLc, high‐density lipoprotein cholesterol; PP, pulse pressure; SBP, systolic blood pressure.
Cox regression.
Model 1: Univariate analysis.
Model 2: Adjusted for age and sex.
Model 3: Adjusted for age, sex, eGFR, and HDLc.
*P < .05; **P < .001. HR was for 1 unit increase.
Figure 2.
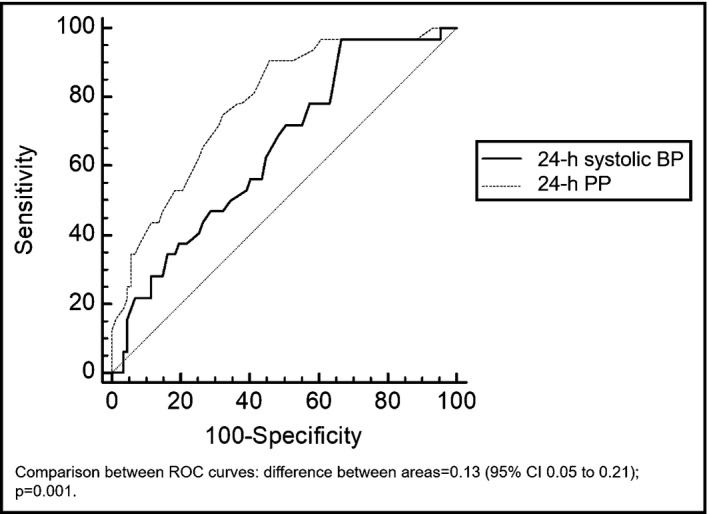
Comparison of ROC curves of 24‐h PP and 24‐h systolic BP at T0 in predicting mortality. BP, blood pressure; PP, pulse pressure
4. DISCUSSION
This is one of the few studies that have assessed ambulatory BP changes in older hypertensives for such a long observational period. In our elderly population, we found an ambulatory PP increase over 10 years and the ambulatory BP control is the main risk factor that guides this change. Furthermore, ambulatory PP is the most important predictor of 10‐year mortality and this link is mainly related to systolic BP rather than diastolic BP.
4.1. Changes in ABP parameters over time in older hypertensives
It is well known that aging is associated with BP increase.25 Mean systolic BP increases linearly, whereas diastolic BP decreases in both men and women above 70 years of age.24 However, those few previous studies that evaluated ABP changes found different trends in systolic and diastolic BP, depending on the population considered.6, 25, 26, 27 In our population, we did not find a significant increase in systolic BP, whereas we found a decrease in diastolic BP. As result of these ABP changes, we found a mean increase in ambulatory PP of almost 4 mm Hg after 10 years. McDonald and colleagues25 performed a 10‐year follow‐up study in a community‐dwelling older population (mean age: 70.0 years). They found an increase in ambulatory PP, due to an increase in systolic BP greater than diastolic BP. The difference in BP trends between our study and that by McDonald and colleagues could be explained by the different population taken into account: only 46% of enrolled patients were taking antihypertensive drugs at baseline in the study by McDonald and colleagues,25 whereas patients in our study were all treated hypertensives with a high CV risk. Moreover, we found different trends between ABP and office BP over 10 years, thus confirming the different ability of these 2 methods to evaluate BP changes over time in the elderly.6 We have evaluated treated patients followed by a specialized hypertension center, which may explain the relatively good BP control and the absence of systolic ABP increase. On the other hand, diastolic ABP decrease over 10 years is in agreement with another previous study on high CV risk older patients, likely reflecting a more severe vascular sclerosis.27
4.2. Determinants of ambulatory PP changes in the elderly
There are several risk factors associated with ambulatory PP increase in elderly. Given their relationship with arterial stiffness, aging, diabetes mellitus, and obesity are among the variables more associated with PP increase.28, 29 The most important risk factor associated with ambulatory PP increase over 10 years was ABP control in our study on older treated hypertensives. Patients with nonsustained daytime BP control had the greatest increase in ambulatory PP.
Hypertension may cause arterial stiffening through several mechanisms.30, 31 Renin‐angiotensin‐aldosterone system (RAAS) and dietary salt intake are key factors involved in molecular pathways that contribute to vascular remodeling: inflammation, vascular smooth muscle cell tone and proliferation, collagen and elastin production, and nitric oxide reduction.31
The actual role of the different cardio‐metabolic risk factors on stiffening of the aorta and other large arteries is still not fully understood. Our data confirm the key role of high BP in determining the onset and progression of vascular damage.
4.3. Prognostic role of ambulatory PP in the elderly
The increase in PP with aging reflects the gradual increase in arterial stiffness due to atherosclerosis and arteriosclerosis.14 In patients older than 60 years, PP becomes the dominant predictor of CV risk, incorporating both the direct relationship with high systolic BP and the inverse relationship with low diastolic BP, reflecting worse vascular damage.32 In our study, more than a quarter of patients died over 10 years, confirming the high CV risk of the population analyzed. Ambulatory PP, considered as a continuous variable, was the strongest predictor of mortality, according to the literature.13 The link between ambulatory PP and mortality was mainly related to systolic rather than diastolic BP in our study. In fact, systolic ABP values predicted mortality, and no association emerged with diastolic ABP values. Low diastolic ABP, likely as an expression of increased aortic stiffness and therefore of vascular damage, has been associated with greater risk of death in old hypertensives after a mean follow‐up of 3.8 years.33 However, the true prognostic role of diastolic BP in the elderly is still debated.34, 35
Instead, our results confirm that systolic BP lowering is beneficial in older hypertensives, given its association with mortality.36
The precise ambulatory PP cutoff point to define a higher CV risk is still unclear. We found that 55 mm Hg was the best cutoff point for 24‐hour PP in our small sample, although with a low predictive value (good sensitivity and very low specificity). Vinyoles and coauthors28 recently found that 55 mm Hg for 24‐hour PP was statistically equivalent to 60 mm Hg for office PP, the cutoff suggested by European Guidelines on Hypertension.11 A previous study considering hypertensive patients taken from the Progetto Ipertensione Umbria Monitoraggio Ambulatoriale (PIUMA) cohort found a significant increase in CV morbidity for a 24‐hour PP > 53 mm Hg.14 However, in 9938 participants from 11 populations, 24‐hour PP did not add to risk stratification below age 60. Moreover, 24‐hour PP of around 76 mm Hg was associated with a higher risk, whereas levels below 64 mm Hg were probably safe in the elderly.13 Further studies are needed to better identify the 24‐hour PP threshold with the best prognostic role in elderly population.
4.4. Study limits
The strength of our study is the BP measurement accuracy in our center (for example, ABPM cuff at T1 has been positioned at the same arm used 10 years before, thus avoiding errors due to interarm BP differences).37
A major, but unavoidable limitation of our study is the lack of precise information about BP control during the 10‐year period. In the analyses, we have assumed that patients with sustained BP control were controlled during the whole period considered and vice versa for nonsustained BP control. It was not possible to define the precise cause of death in all patients, although in 70% of cases in which the cause of death could be ascertained, it was attributable to a CV cause. Moreover, missing data due to death and hospitalization among patients with high 24‐hour PP at baseline could be a potential bias in our study. The study suffered from the small sample size and the lack of any in‐between evaluation during the 10‐year period that did not allow us to exclude possible bias in our results. Finally, we considered a selected, fairly well BP controlled population followed by a Hypertension Excellence Centre of ESH; therefore, our results could not be extended to other populations.
5. CONCLUSIONS
Hypertension is the most important modifiable CV risk factor in elderly persons. ABPM provides a better characterization of BP changes compared to OBPM in this population. Our study shows how ambulatory BP control represents an important predictor of ambulatory PP increase over 10 years, stressing the key role of this CV risk factor in the progression of vascular damage. Moreover, we confirm that ambulatory PP is the ABP parameter that best predicts 10‐year mortality in older treated hypertensives. This association is due to the systolic ABP that should represent the main target of drug therapy.
CONFLICT OF INTEREST
The authors report no conflicts of interest to disclose.
Supporting information
ACKNOWLEDGMENTS
None.
Balietti P, Spannella F, Giulietti F, et al. Ten‐year changes in ambulatory blood pressure: The prognostic value of ambulatory pulse pressure. J Clin Hypertens. 2018;20:1230‐1237. 10.1111/jch.13344
Balietti and Spannella contributed equally to the work and should be considered both first authors.
REFERENCES
- 1. Cutler JA, Sorlie PD, Wolz M, Thom T, Fields LE, Roccella EJ. Trends in hypertension prevalence, awareness, treatment, and control rates in United States adults between 1988‐1994 and 1999‐2004. Hypertension. 2008;52:818‐827. [DOI] [PubMed] [Google Scholar]
- 2. Pickering TG, Shimbo D, Haas D. Ambulatory blood‐pressure monitoring. N Engl J Med. 2006;354:2368‐2374. [DOI] [PubMed] [Google Scholar]
- 3. Salles GF, Reboldi G, Fagard RH, et al. Prognostic effect of the nocturnal blood pressure fall in hypertensive patients: the ambulatory blood pressure collaboration in patients with hypertension (ABC‐H) meta‐analysis. Hypertension. 2016;67:693‐700. [DOI] [PubMed] [Google Scholar]
- 4. Ohkubo T, Kikuya M, Metoki H, et al. Prognosis of “masked” hypertension and “white‐coat” hypertension detected by 24‐h ambulatory blood pressure monitoring 10‐year follow‐up from the Ohasama study. J Am Coll Cardiol. 2005;46:508‐515. [DOI] [PubMed] [Google Scholar]
- 5. O'Brien E, Parati G, Stergiou G, et al. European society of hypertension position paper on ambulatory blood pressure monitoring. J Hypertens. 2013;31:1731‐1768. [DOI] [PubMed] [Google Scholar]
- 6. Maselli M, Giantin V, Franchin A, et al. Detection of blood pressure increments in active elderly individuals: the role of ambulatory blood pressure monitoring. Nutr Metab Cardiovasc Dis. 2014;24:914‐920. [DOI] [PubMed] [Google Scholar]
- 7. Staessen JA, Thijs L, O'Brien ET, et al. Ambulatory pulse pressure as predictor of outcome in older patients with systolic hypertension. Am J Hypertens. 2002;15(10 pt 1):835‐843. [DOI] [PubMed] [Google Scholar]
- 8. Domanski M, Mitchell G, Pfeffer M, et al. Pulse pressure and cardiovascular disease‐related mortality: follow‐up study of the Multiple Risk Factor Intervention Trial (MRFIT). JAMA. 2002;287:2677‐2683. [DOI] [PubMed] [Google Scholar]
- 9. Franklin SS, Gustin W 4th, Wong ND, et al. Hemodynamic patterns of age‐related changes in blood pressure. The Framingham Heart Study. Circulation. 1997;96:308‐315. [DOI] [PubMed] [Google Scholar]
- 10. Franklin SS, Levy D. Aging, blood pressure, and heart failure: what are the connections? Hypertension. 2011;58:760‐762. [DOI] [PMC free article] [PubMed] [Google Scholar]
- 11. Mancia G, Fagard R, Narkiewicz K, et al. 2013 ESH/ESC guidelines for the management of arterial hypertension: the task force for the management of arterial hypertension of the European Society of Hypertension (ESH) and of the European Society of Cardiology (ESC). J Hypertens. 2013;31:1281‐1357. [DOI] [PubMed] [Google Scholar]
- 12. Khattar RS, Swales JD, Dore C, Senior R, Lahiri A. Effect of aging on the prognostic significance of ambulatory systolic, diastolic, and pulse pressure in essential hypertension. Circulation. 2001;104:783‐789. [DOI] [PubMed] [Google Scholar]
- 13. Gu YM, Thijs L, Li Y, et al. Outcome‐driven thresholds for ambulatory pulse pressure in 9938 participants recruited from 11 populations. Hypertension. 2014;63:229‐237. [DOI] [PMC free article] [PubMed] [Google Scholar]
- 14. Verdecchia P, Schillaci G, Borgioni C, Ciucci A, Pede S, Porcellati C. Ambulatory pulse pressure: a potent predictor of total cardiovascular risk in hypertension. Hypertension. 1998;32:983‐988. [DOI] [PubMed] [Google Scholar]
- 15. Fedecostante M, Spannella F, Giulietti F, Espinosa E, Dessì‐Fulgheri P, Sarzani R. Associations between body mass index, ambulatory blood pressure findings, and changes in cardiac structure: relevance of pulse and nighttime pressures. J Clin Hypertens (Greenwich). 2015;17:147‐153. [DOI] [PMC free article] [PubMed] [Google Scholar]
- 16. Blanco F, Gil P, Arco CD, et al. Association of clinic and ambulatory blood pressure with vascular damage in the elderly: the EPICARDIAN study. Blood Press Monit. 2006;11:329‐335. [DOI] [PubMed] [Google Scholar]
- 17. Stergiou GS, Efstathiou SP, Skeva II, Baibas NM, Kalkana CB, Mountokalakis TD. Assessment of drug effects on blood pressure and pulse pressure using clinic, home and ambulatory measurements. J Hum Hypertens. 2002;16:729‐735. [DOI] [PubMed] [Google Scholar]
- 18. Morisky DE, Ang A, Krousel‐Wood M, Ward HJ. Predictive validity of a medication adherence measure in an outpatient setting. J Clin Hypertens (Greenwich). 2008;10:348‐354. [DOI] [PMC free article] [PubMed] [Google Scholar] [Retracted]
- 19. Centers for Disease Control and Prevention (CDC) . Cigarette smoking among adults and trends in smoking cessation ‐ United States, 2008. MMWR Morb Mortal Wkly Rep. 2009;58:1227‐1232. [PubMed] [Google Scholar]
- 20. Buckalew VM Jr, Berg RL, Wang SR, Porush JG, Rauch S, Schulman G. Prevalence of hypertension in 1,795 subjects with chronic renal disease: the modification of diet in renal disease study baseline cohort. Modification of diet in renal disease study group. Am J Kidney Dis. 1996;28:811‐821. [DOI] [PubMed] [Google Scholar]
- 21. Delanghe JR, Speeckaert MM. Creatinine determination according to Jaffe‐what does it stand for? NDT Plus. 2011;4:83‐86. [DOI] [PMC free article] [PubMed] [Google Scholar]
- 22. Martin SS, Blaha MJ, Elshazly MB, et al. Comparison of a novel method vs the Friedewald equation for estimating low‐density lipoprotein cholesterol levels from the standard lipid profile. JAMA. 2013;310:2061‐2068. [DOI] [PMC free article] [PubMed] [Google Scholar]
- 23. Omboni S, Palatini P, Parati G, Working Group on Blood Pressure Monitoring of the Italian Society of Hypertension . Standards for ambulatory blood pressure monitoring clinical reporting in daily practice: recommendations from the Italian Society of Hypertension. Blood Press Monit. 2015;20:241‐244. [DOI] [PubMed] [Google Scholar]
- 24. Bailey KR, Grossardt BR, Graves JW. Novel use of Kaplan‐Meier methods to explain age and gender differences in hypertension control rates. Hypertension. 2008;51:841‐847. [DOI] [PMC free article] [PubMed] [Google Scholar]
- 25. McDonald C, Pearce MS, Wincenciak J, Kerr SR, Newton JL. Ambulatory blood pressure variability increases over a 10‐year follow‐up in community‐dwelling older people. Am J Hypertens. 2016;29:560‐567. [DOI] [PMC free article] [PubMed] [Google Scholar]
- 26. Goldstein IB, Shapiro D, Guthrie D. A 5‐year follow‐up of ambulatory blood pressure in healthy older adults. Am J Hypertens. 2003;16:640‐645. [DOI] [PubMed] [Google Scholar]
- 27. Monneret D, Barthélémy JC, Hupin D, et al. Serum lipid profile, sleep‐disordered breathing and blood pressure in the elderly: a 10‐year follow‐up of the PROOF‐SYNAPSE cohort. Sleep Med. 2017;39:14‐22. [DOI] [PubMed] [Google Scholar]
- 28. Vinyoles E, de la Sierra A, Roso‐Llorach A, et al. 24‐h pulse pressure cutoff point definition by office pulse pressure in a population of Spanish older hypertensive patients. J Hypertens. 2017;35:1011‐1018. [DOI] [PubMed] [Google Scholar]
- 29. Butler KR Jr, Penman AD, Minor DS, Mosley TH Jr. Determinants of pulse pressure and annual rates of change in the Atherosclerosis Risk in Communities study. J Hypertens. 2015;33:2463‐2470. [DOI] [PubMed] [Google Scholar]
- 30. Spannella F, Giulietti F, Balietti P, et al. Plasma renin activity to plasma aldosterone concentration ratio correlates with night‐time and pulse pressures in essential hypertensive patients treated with angiotensin‐converting enzyme inhibitors/AT1 blockers. J Hypertens. 2017;35:2315‐2322. [DOI] [PubMed] [Google Scholar]
- 31. Zieman SJ, Melenovsky V, Kass DA. Mechanisms, pathophysiology, and therapy of arterial stiffness. Arterioscler Thromb Vasc Biol. 2005;25:932‐943. [DOI] [PubMed] [Google Scholar]
- 32. Nichols WW, O'Rourke MF. McDonald's Blood Flow in Arteries: Theoretical, Experimental and Clinical Principles. 4th ed. London, UK: Edward Arnold, Hodder Headline Group; 1998. [Google Scholar]
- 33. Ungar A, Pepe G, Lambertucci L, et al. Low diastolic ambulatory blood pressure is associated with greater all‐cause mortality in older patients with hypertension. J Am Geriatr Soc. 2009;57:291‐296. [DOI] [PubMed] [Google Scholar]
- 34. Lewington S, Clarke R, Qizilbash N, Peto R, Collins R, Prospective Studies Collaboration . Age‐specific relevance of usual blood pressure to vascular mortality: a meta‐analysis of individual data for one million adults in 61 prospective studies. Lancet. 2002;360:1903‐1913. [DOI] [PubMed] [Google Scholar]
- 35. Staessen JA, Gasowski J, Wang JG, et al. Risks of untreated and treated isolated systolic hypertension in the elderly: meta‐analysis of outcome trials. Lancet. 2000;355:865‐872. [DOI] [PubMed] [Google Scholar]
- 36. Qaseem A, Wilt TJ, Rich R, Humphrey LL, Frost J, Forciea MA. Pharmacologic treatment of hypertension in adults aged 60 years or older to higher versus lower blood pressure targets: a clinical practice guideline from the American College of Physicians and the American Academy of Family Physicians. Ann Intern Med. 2017;166:430‐437. [DOI] [PubMed] [Google Scholar]
- 37. Spannella F, Giulietti F, Fedecostante M, et al. Interarm blood pressure differences predict target organ damage in type 2 diabetes. J Clin Hypertens (Greenwich). 2017;19:472‐478. [DOI] [PMC free article] [PubMed] [Google Scholar]
Associated Data
This section collects any data citations, data availability statements, or supplementary materials included in this article.
Supplementary Materials