

Abstract
Both high sodium and low potassium diets are associated with hypertension, but whether these risk factors are distinct or overlapping has not been thoroughly investigated. The authors evaluated the relationship between dietary sodium, potassium, and high systolic blood pressure among 4716 adolescents aged 12 to 14 years who participated in the National Health and Nutrition Examination Survey from 1999 to 2012. There was no association with blood pressure across most values of sodium or potassium intake. However, participants who reported sodium intake ≥7500 mg/d, potassium <700 mg/d, or sodium‐potassium ratio ≥2.5 had increased odds for high systolic blood pressure (≥95th percentile for age, sex, and height). Although the high sodium and low potassium groups did not overlap, 49.2% of these adolescents also had a sodium‐potassium ratio ≥2.5. In young adolescents, both excessive sodium and limited potassium are associated with high systolic blood pressure, but the balance between sodium and potassium intake may be more useful in explaining blood pressure in this population.
Keywords: diet therapy, hypertension, NHANES, public health
1. Introduction
The public health burden of hypertension is enormous. Worldwide, 13.5% of all premature deaths and approximately half of all cases of stroke and ischemic heart disease are attributable to high blood pressure (BP).1 Therefore, dietary interventions to reduce the incidence of hypertension have great potential to reduce cardiovascular morbidity and mortality.
The association between excessive dietary sodium and hypertension has been extensively investigated. Large, multinational observational studies have demonstrated a positive correlation between sodium intake and BP,2 and a recent comprehensive meta‐analysis of randomized controlled trials and prospective cohort studies in both adults and children concluded that reduced sodium intake lowers BP.3 In light of this, the American Heart Association recommends limiting sodium consumption to <1500 mg/d.4
Evidence also supports decreased dietary potassium as a risk factor for hypertension, although this has not been as frequently studied. Experimental studies show that potassium deficiency increases BP,5, 6 and multiple randomized controlled trials have demonstrated that increased potassium intake reduces BP in persons with hypertension.7
However, the sodium and potassium content of foods tend to be inversely related: foods with high sodium content tend to have low potassium and vice versa. This makes it difficult to discern the extent to which these dietary factors are distinct or overlapping, which, in turn, makes it challenging to formulate the best dietary policies or provide targeted dietary advice to patients. We therefore sought to evaluate the relationship and overlap between dietary sodium and dietary potassium intake and high systolic BP (SBP) in a nationally representative sample of young adolescents.
2. Methods
2.1. Study population
We pooled data for participants aged 12 to 14 years from the National Health and Nutrition Examination Survey (NHANES) cycles from 1999 to 2012. NHANES is a complex, cross‐sectional probability sample of the noninstitutionalized US population, conducted by the National Center for Health Statistics of the Centers for Disease Control and Prevention. The research ethics review board of the National Center for Health Statistics approved all study protocols, and both written consent from the participant's guardian and verbal assent from the adolescent were obtained.
All participants aged 12 to 14 years were initially included. Participants were excluded from all analyses if they were pregnant at the time of the examination or if they were missing data necessary to assess the variables of interest (BP, height, or sodium and potassium intake).
2.2. Blood pressure
BP measurement occurred in the NHANES mobile examination center, a clinic‐type setting with a standardized, controlled environment. Three SBP readings were obtained for each NHANES participant. If one or more of these readings were disrupted, a fourth reading was obtained. Mean SBP was calculated from the available readings for each participant. High SBP was defined as mean SBP ≥95th percentile for the participant's age, sex, and height according to the Fourth Report on the Diagnosis, Evaluation, and Treatment of High Blood Pressure in Children and Adolescents.8
2.3. Dietary sodium and potassium
A structured in‐person dietary interview was used to estimate the type and amount of food consumed by participants during the 24‐hour period prior to the interview. Participants were interviewed using the Automated Multiple Pass Method, a standardized and validated approach for obtaining complete and accurate dietary recall data.9 Measuring guides (such as drinking glasses, utensils, and measuring cups) were available during the interview to assist the participants with reporting the amount of food consumed. Nutrient information was estimated based on food and beverage intake only; sodium or potassium obtained through dietary supplements, antacids, or medications were not included.
2.4. Statistical analyses
Statistical analyses were performed using a calculated 14‐year examination sample weight to account for the complex sample design of NHANES. All statistical analyses were performed using SPSS version 23 (IBM Corp, Armonk, NY, USA). Statistical significance was set as P<.05 for all tests.
Linear models were created to evaluate factors of interest and continuous outcomes (average SBP), while logistic regression was used to evaluate binary outcomes (SBP ≥95th percentile). Multivariable logistic regression models adjusted for both race and obesity. When SBP was considered as a continuous outcome, multivariable linear regression models additionally adjusted for age, height, and sex.
To identify the classification thresholds for dietary factors and elevated BP, the frequency of SBP ≥95th percentile was plotted against dietary sodium and dietary potassium intake (Figures 1 and 2) or sodium‐potassium ratio (Na+/K+) (Figure 3), and the change point was visually estimated. A series of logistic regression models with thresholds fixed at points within a plausible range of values were then created, and the area under the receiver operating characteristic curve was used to choose the best fitting model.
Figure 1.
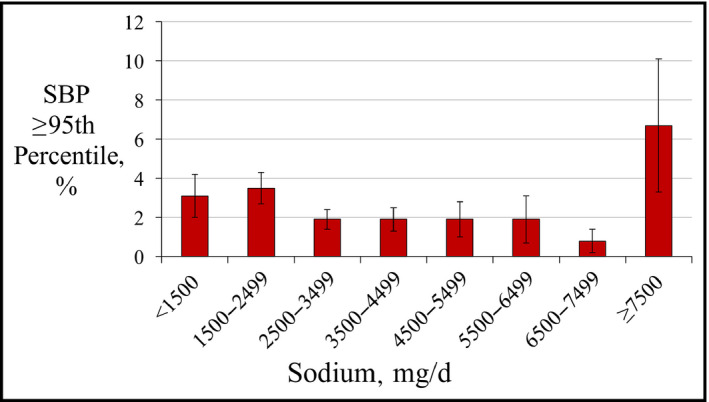
Frequency of systolic blood pressure (SBP) ≥95th percentile by categories of dietary sodium intake
Figure 2.
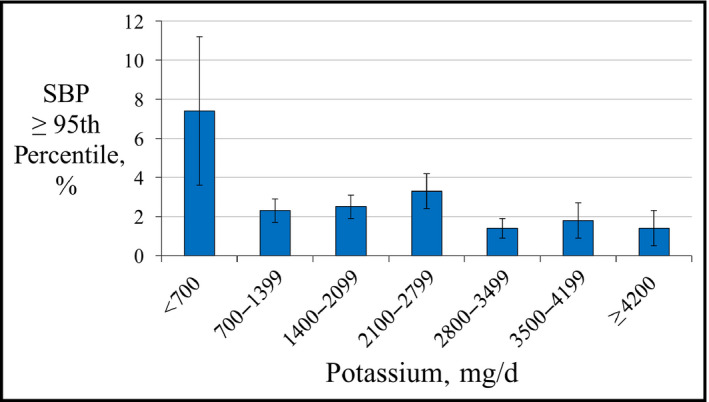
Frequency of systolic blood pressure (SBP) ≥95th percentile by categories of dietary potassium intake
Figure 3.
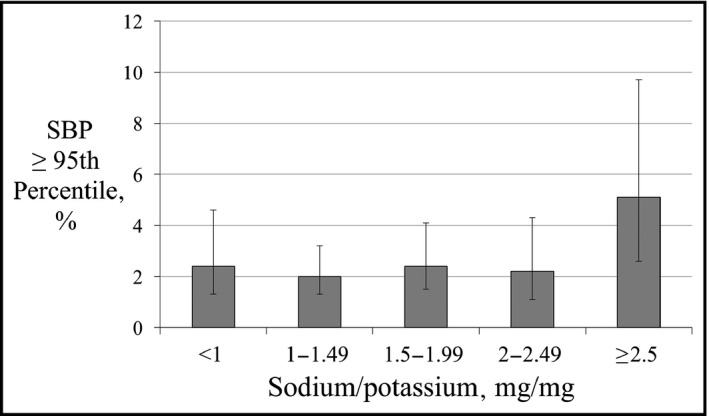
Frequency of systolic blood pressure (SBP) ≥95th percentile by categories of sodium‐potassium ratio
3. Results
3.1. Study population
A total of 5083 adolescents aged 12 to 14 years participated in NHANES from 1999 to 2012. Of these, 210 were missing BP measurements, 155 were missing dietary data, and two were pregnant. The remaining 4716 participants were analyzed, representing a total population of 12 146 746. Demographic and clinical features of the study population are shown in Table 1.
Table 1.
Demographic and Clinical Characteristics of US Adolescents With Normal and High SBP (≥95th Percentile), NHANES 1999–2012
| Characteristic | Normal SBP (97.5%; n=4571) | SBP ≥95th Percentile (2.5%; n=145) | P Value |
|---|---|---|---|
| Age, y | 13.5 (12.6–14.2) | 13.3 (12.7–14.4) | .56 |
| Men, % | 50.5 | 50.3 | .97 |
| Race, % | |||
| Mexican American | 12.6 | 13.3 | .25 |
| Other Hispanic | 6.7 | 6.7 | |
| Non‐Hispanic white | 60.1 | 48.2 | |
| Non‐Hispanic black | 14.1 | 24.0 | |
| Other (including multiracial) | 6.6 | 7.8 | |
| Obese, % | 18.4 | 37.8 | .006 |
| Dietary sodium, mg/d | 2974 (2153–4034) | 2668 (2044–3710) | .86 |
| Dietary potassium, mg/d | 2040 (1424–2873) | 1916 (1227–2419) | .09 |
| Dietary sodium/potassium, mg/mg | 1.48 (1.12–1.95) | 1.57 (1.19–2.18) | .08 |
Abbreviations: NHANES, National Health and Nutrition Examination Survey; SBP, systolic blood pressure.
3.2. High SBP
Overall, 2.5% (95% confidence interval [CI], 1.9%–3.4%) of participants had high SBP (≥95th percentile). Obesity (body mass index ≥95th percentile for age and sex) was associated with increased odds for high SBP. Among nonobese participants, 2.0% (95% CI, 1.3%–2.9%) had high SBP, while 5.1% (95% CI, 3.4%–7.6%) of obese participants had high SBP (odds ratio [OR], 2.70; 95% CI, 1.49–4.87). The frequency of high SBP also varied by race. Among non‐Hispanic white participants, 2.1% (95% CI, 1.2%–3.5%) had high SBP, while 4.3% (3.1%–5.8%) of non‐Hispanic black participants had high SBP (OR, 2.12; 95% CI, 1.13–3.98).
3.3. Dietary factors
The frequency of high SBP varied by dietary sodium intake (Figure 1). Across most values of sodium intake, there was no relationship between dietary sodium and SBP ≥95th percentile. However, after adjustment for race and obesity, adolescents with the most extreme levels of sodium intake (≥7500 mg/d) had increased odds for SBP ≥95th percentile (Table 2). Adolescents reporting ≥7500 mg/d of sodium intake composed only 2.7% of the study population but accounted for 7.0% of those with high SBP. There was no threshold below which sodium intake was associated with decreased odds for SBP ≥95th percentile. There was no association between dietary sodium intake or log‐transformed dietary sodium intake and either mean SBP or SBP ≥95th percentile after multivariable adjustment.
Table 2.
ORs for Dietary Factors and Systolic Blood Pressure ≥95th Percentile
| Factor | Unadjusted OR | P Value | Adjusted ORa | P Value |
|---|---|---|---|---|
| Sodium, g/d | 0.98 (0.80–1.20) | .86 | 1.01 (0.82–1.23) | .96 |
| ln (sodium, mg/d) | 0.83 (0.49–1.40) | .48 | 0.91 (0.53–1.55) | .72 |
| Sodium ≥7500 mg/d | 2.87 (0.95–8.69) | .06 | 3.13 (1.05–9.37) | .04 |
| Potassium, g/d | 0.81 (0.60–1.08) | .15 | 0.84 (0.62–1.15) | .27 |
| ln (potassium, mg/d) | 0.61 (0.37–0.99) | .04 | 0.65 (0.38–1.14) | .13 |
| Potassium <700 mg/d | 3.30 (1.12–9.75) | .03 | 3.06 (0.94–9.99) | .06 |
| Potassium >2800 mg/d | 0.50 (0.27–0.94) | .03 | 0.55 (0.29–1.05) | .07 |
| Na+/K+ | 1.48 (1.09–2.02) | .01 | 1.49 (1.07–2.08) | .02 |
| Na+/K+ ≥2.5 | 2.32 (1.15–4.66) | .02 | 2.30 (1.11–4.73) | .03 |
Abbreviations: Na+/K+, sodium/potassium ratio; OR, odds ratio.
Adjusted for race and obesity (body mass index >95th percentile).
Similarly, the frequency of high SBP varied by dietary potassium intake (Figure 2). Adolescents reporting potassium intake <700 mg/d had increased odds for SBP ≥95th percentile, while those reporting potassium intake >2800 mg/d had decreased odds for high SBP (Table 2). However, there was no linear relationship between dietary potassium intake or log‐transformed potassium intake and either average SBP or the frequency of SBP ≥95th percentile, even after multivariable adjustment.
In contrast, there was a linear relationship between the Na+/K+ and SBP. In a linear model adjusting for age, sex, height, race, and body mass index z score, every 1‐unit increase in the Na+/K+ was associated with a 0.74‐mm Hg increase in SBP (95% CI, 0.20–1.27; P<.01 [model R 2=.16]).
Participants with Na+/K+ ≥2.5 were particularly more likely to have high SBP compared with those with Na+/K+ <2.5 (5.1% vs 2.3%; relative risk, 2.25 [95% CI, 1.16–4.37]) (Figure 3). Even after multivariable adjustment, the mean SBP was 1.65 mm Hg higher in participants with Na+/K+ ≥2.5 than those with Na+/K+ <2.5 (95% CI, 0.35–2.93; P=.01). Both Na+/K+ and Na+/K+ ≥2.5 were associated with increased odds for high SBP after multivariable adjustment (Table 2). The mean Na+/K+ did not significantly differ between participants with normal BP and those with high SBP (1.61 vs 1.90, P=.08).
3.4. Obesity and dietary factors
Overall, 18.9% of the population was obese. Both the mean sodium and potassium intake were lower among obese adolescents than those with body mass index <95th percentile (sodium: 3094 mg/d vs 3347 mg/d, P=.002; potassium: 2121 mg/d vs 2284 mg/d, P=.003). However, the mean Na+/K+ did not differ between obese and nonobese participants (1.60 vs 1.63, P=.51), and there were no differences in the percentage of adolescents who reported sodium ≥7500 mg/d, potassium <700 mg/d, or Na+/K+ ≥2.5.
Among obese adolescents reporting sodium intake ≥7500 mg/d, 25.1% had high SBP (OR, 6.82; 95% CI, 1.77–26.27 [P=.006]). However, there was no association between sodium intake ≥7500 mg/d and high SBP among nonobese adolescents (OR, 1.85; 95% CI, 0.36–9.57 [P=.46]). Conversely, potassium <700 mg/d was associated with increased odds for high SBP in nonobese adolescents (OR, 5.15; 95% CI, 1.61–16.51 [P=.006]) but not among those with body mass index ≥95th percentile (OR, 0.71; 95% CI, 0.23–2.17 [P=.55]). Na+/K+ ≥2.5 was associated with increased odds for high SBP among nonobese participants (OR, 2.66; 95% CI, 1.10–6.44 [P=.03]) but was nonsignificant in the obese subgroup (OR, 1.87; 95% CI, 0.79–4.42 [P=.15]).
3.5. Overlap between dietary factors
Within the entire study population, 14.0% of participants had elevated dietary sodium intake (≥7500 mg/d), low potassium intake (<700 mg/d), or elevated Na+/K+ (≥2.5). Among those with SBP ≥95th percentile, 24.8% had one of these three factors.
No participant reported both sodium intake ≥7500 mg/d and potassium <700 mg/d. However, there was significant overlap between the elevated sodium and low potassium groups and those with Na+/K+ ≥2.5. Overall, 49.2% of participants with sodium ≥7500 mg/d or potassium <700 mg/d also had Na+/K+ ≥2.5. Considering only participants with high SBP, 55.7% of those reporting sodium intake ≥7500 mg/d also had Na+/K+ ≥2.5, while 94.5% of those reporting potassium intake <700 mg/d had elevated Na+/K+ (≥2.5). Venn diagrams demonstrating the overlap of these three dietary factors are shown in Figures 4 and 5.
Figure 4.
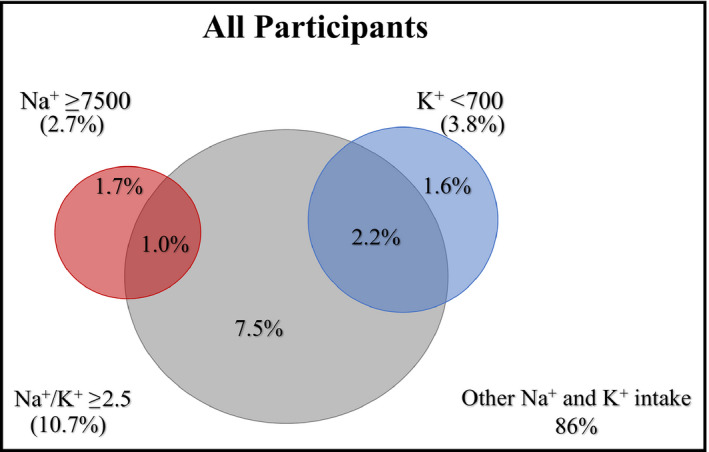
Venn diagram demonstrating the intersection of dietary factors among all study participants. K+ indicates potassium (mg/d); Na+, sodium (mg/d); Na+/K+, sodium/potassium ratio
Figure 5.
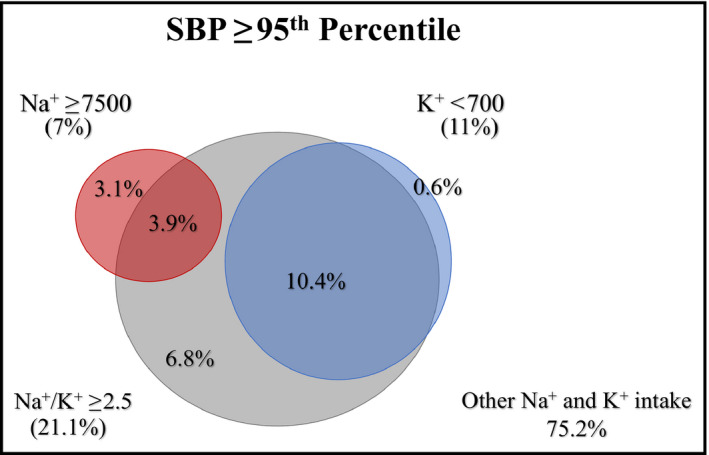
Venn diagram demonstrating the intersection of dietary factors among study participants with systolic blood pressure ≥95th percentile. K+ indicates potassium (mg/d); Na+, sodium (mg/d); Na+/K+, sodium/potassium ratio
4. Discussion
In this nationally representative study of young adolescents, both excessive dietary sodium and limited dietary potassium were distinct risk factors for SBP ≥95th percentile. These findings support the substantial and still‐growing body of evidence indicating that both higher sodium and lower potassium intake are associated with high BP.
Using a single 24‐hour dietary recall, only extreme levels of sodium or potassium intake were associated with SBP ≥95th percentile. When considered individually, only adolescents consuming ≥7500 mg/d of sodium or <700 mg/d of potassium had increased odds for high SBP. These thresholds were heavily influenced by the presence of obesity: high sodium diets were only associated with high SBP among obese participants, while low potassium was associated with high SBP only among nonobese adolescents. However, adolescents who consumed an excess of sodium relative to potassium (Na+/K+ ≥2.5 mg/mg) were more likely to have high SBP. The relationship between Na+/K+ and SBP was linear and persisted even with multivariable adjustment, suggesting that the balance between sodium and potassium intake—rather than sodium or potassium per se—may be more useful in explaining BP in this population.
This is the first study of pediatric patients using nationally representative data to demonstrate an association between Na+/K+ and elevated BP. Notably, the effect magnitude in US adolescents is nearly identical to that seen in a multinational study of over 100 000 adults, in which every 1‐unit increase in urinary Na+/K+ was associated with an increase in SBP by 0.7 mm Hg.10 A similar effect was seen in 3303 patients aged 30 to 65 years in the Dallas Heart Study, in which each 1‐unit increase in urinary sodium‐potassium was associated with an approximate 0.5‐mm Hg increase in SBP.11
Data on how sodium and potassium balance impact BP in pediatric patients are more limited. Numerous studies have evaluated the effect of dietary sodium on BP. Although a recent meta‐analysis of nine controlled trials in children and adolescents indicated that reducing sodium intake lowered SBP by 0.84 mm Hg,3 four of the included trials found no change in BP,12, 13, 14, 15 while two did not assess potassium intake.16, 17 However, in a longitudinal study of over 2000 adolescent girls with 10 years of follow‐up, sodium intake ≥3500 mg/d had no adverse effect on BP; however, higher potassium intake was associated with lower BP.18 Similarly, in a randomized trial, adolescents who received a Dietary Approaches to Stop Hypertension (DASH)19–type diet had greater improvement in SBP compared with those who received standard care. Notably, although sodium intake did not change, potassium intake increased with the DASH‐type intervention.20
Taken together, these results may suggest a more significant role for potassium or sodium‐potassium balance in the pathogenesis of hypertension in young patients. Indeed, in human experiments, potassium depletion consistently leads to sodium retention and higher BP,5, 21, 22 and numerous epidemiological and experimental observations have demonstrated a beneficial effect of potassium intake on BP and cardiovascular outcomes.23 A thorough discussion of the potential mechanisms underlying these observations is beyond the scope of this article and has been expertly reviewed elsewhere.24, 25 While multiple hypotheses exist, a substantial body of evidence supports a primary role for endothelial dysfunction in salt‐sensitive hypertension. Excessive sodium intake promotes lymphangiogenesis and increased production of transforming growth factor β, but addition of potassium inhibits the production of transforming growth factor β and promotes the release of endothelial nitric oxide.26, 27
If validated prospectively, these findings could have significant public policy implications. Currently, sodium intake among American adolescents significantly exceeds recommendations. While expert guidelines8 endorse reducing sodium intake to 1.2 g/d in children aged 4 to 8 years and 1.5 g/d in older children, the median sodium intake in this nationally representative sample was 2966 mg/d; only 27.2% of 12‐ to 14‐year‐olds achieved the recommended sodium intake. Even among at‐risk patients in a clinical setting, long‐term sodium reduction is not easily achieved. In a randomized trial involving young adolescents with elevated BP, boys randomized to receive a 70‐mmol/d (1610 mg/d) sodium diet had no decrease in either sodium intake or BP over 3 years, despite intensive education and frequent counseling by a nutritionist.28
Notably, an even smaller number of adolescents (4.2%) achieved the US Department of Agriculture's recommended daily potassium intake of 4500 mg/d to 4700 mg/d.29 However, the threshold at which potassium intake was associated with elevated BP was well below this amount, and could be exceeded easily with simple dietary changes. For example, consuming two bananas, one baked potato, or a single cup of tomato sauce or black beans would be sufficient to provide more than 700 mg/d of potassium. Given the well‐studied relationship between dietary sodium and hypertension, substantial public investment has been made in the efforts to reduce sodium intake.4, 30 While further study is required, if increased potassium is in fact protective against sodium excess, then it is possible that efforts to increase potassium intake or lower the Na+/K+ may also have a public health benefit.
4.1. Limitations
There are several important limitations of this study. First, while nationally representative, NHANES data are cross‐sectional. It is not possible to determine whether sodium or potassium intake caused elevated BP.
Second, BP was evaluated at a single physical examination, rather than the three or more required to diagnose hypertension.8 While it is possible that elevations in BP were transient, adolescents with an elevated BP on even a single occasion have an increased likelihood of developing hypertension in later adolescence31 or adulthood.32
Third, in NHANES, nutrient intake is evaluated using a memory‐based assessment in a structured interview. While this method has been carefully characterized and validated,9, 33 estimates of sodium and potassium intake obtained by dietary recall vary from sodium and potassium intake measured by 24‐hour urine excretion.34 Additionally, caloric intake may be underreported, especially by participants who are overweight or obese.35 This is likely to reduce estimates of dietary sodium intake, as there is a strong correlation between caloric and sodium intake.
Finally, we evaluated sodium and potassium intake only in the 24 hours preceding the measurement of BP. Because there is significant within‐person day‐to‐day variability in sodium and potassium consumption, accurately determining an individual's average intake may require 7 to 14 days of evaluation.36 Although elevated BP was temporally associated with the sodium and potassium levels reported, it is unclear whether these represent long‐standing dietary patterns. However, use of 24‐hour dietary recall has practical advantages: if validated, these thresholds could be used to provide targeted dietary recommendations in the clinical setting.
5. Conclusions
In a nationally representative cross‐sectional sample of US adolescents aged 12 to 14 years, elevated dietary sodium, decreased dietary potassium, and an elevated Na+/K+ were all associated with high SBP. These findings support the hypothesis that the balance between sodium and potassium intake is relevant in the pathogenesis of primary hypertension. Further study is warranted to elucidate the mechanisms underlying these findings and determine their utility as therapeutic targets.
Financial Disclosure
The authors report no specific funding in relation to this research and have no conflicts of interest to disclose.
Chmielewski J, Carmody JB. Dietary sodium, dietary potassium, and systolic blood pressure in US adolescents. J Clin Hypertens. 2017;19:904–909. 10.1111/jch.13014
References
- 1. Lawes CM, Vander Hoorn S, Rodgers A. Global burden of blood‐pressure‐related disease, 2001. Lancet. 2008;371:1513‐1518. [DOI] [PubMed] [Google Scholar]
- 2. Intersalt: an international study of electrolyte excretion and blood pressure. Results for 24 hour urinary sodium and potassium excretion. Intersalt Cooperative Research Group. BMJ. 1988;297:319‐328. [DOI] [PMC free article] [PubMed] [Google Scholar]
- 3. Aburto NJ, Ziolkovska A, Hooper L, Elliott P, Cappuccio FP, Meerpohl JJ. Effect of lower sodium intake on health: systematic review and meta‐analyses. BMJ. 2013;346:f1326. [DOI] [PMC free article] [PubMed] [Google Scholar]
- 4. Appel LJ, Frohlich ED, Hall JE, et al. The importance of population‐wide sodium reduction as a means to prevent cardiovascular disease and stroke: a call to action from the American Heart Association. Circulation. 2011;123:1138‐1143. [DOI] [PubMed] [Google Scholar]
- 5. Krishna GG, Miller E, Kapoor S. Increased blood pressure during potassium depletion in normotensive men. N Engl J Med. 1989;310:1177‐1182. [DOI] [PubMed] [Google Scholar]
- 6. Krishna GG, Kapoor SC. Potassium depletion exacerbates essential hypertension. Ann Intern Med. 1991;115:77‐83. [DOI] [PubMed] [Google Scholar]
- 7. Aburto NJ, Hanson S, Gutierrez H, Hooper L, Elliott P, Cappuccio FP. Effect of increased potassium intake on cardiovascular risk factors and disease: systematic review and meta‐analyses. BMJ. 2013;346:f1378. [DOI] [PMC free article] [PubMed] [Google Scholar]
- 8. National High Blood Pressure Education Program Working Group on High Blood Pressure in Children and Adolescents . The fourth report on the diagnosis, evaluation, and treatment of high blood pressure in children and adolescents. Pediatrics. 2004; 114(2 suppl 4th report):555‐576. [PubMed] [Google Scholar]
- 9. Raper N, Perloff B, Ingwersen L, Steinfeldt L, Anand J. An overview of USDA's dietary intake data system. J Food Compos Anal. 2004;17:545‐555. [Google Scholar]
- 10. Mente A, O'Donnell MJ, Rangarajan S, et al. Association of urinary sodium and potassium excretion with blood pressure. N Engl J Med. 2014;371:601‐611. [DOI] [PubMed] [Google Scholar]
- 11. Hedayati SS, Minhajuddin AT, Ijaz A, et al. Association of urinary sodium/potassium ratio with blood pressure: sex and racial differences. Clin J Am Soc Nephrol. 2012;7:315‐322. [DOI] [PMC free article] [PubMed] [Google Scholar]
- 12. Trevisan M, Cooper R, Ostrow D, et al. Dietary sodium, erythrocyte sodium concentration, sodium‐stimulated lithium efflux and blood pressure. Clin Sci (Lond). 1981;61(suppl 7):29‐32. [DOI] [PubMed] [Google Scholar]
- 13. Gillum RF, Elmer PJ, Prineas RJ. Changing sodium intake in children. The Minneapolis Children's Blood Pressure Study. Hypertension. 1981;3:698‐703. [DOI] [PubMed] [Google Scholar]
- 14. Howe PR, Cobiac L, Smith RM. Lack of effect of short‐term changes in sodium intake on blood pressure in adolescent schoolchildren. J Hypertens. 1991;9:181‐186. [DOI] [PubMed] [Google Scholar]
- 15. Palacios C, Wigertz K, Martin BR, et al. Sodium retention in black and white female adolescents in response to salt intake. J Clin Endocrinol Metab. 2004;89:1858‐1863. [DOI] [PubMed] [Google Scholar]
- 16. Calabrese EJ, Tuthill RW. The Massachusetts Blood Pressure Study, Part 3. Experimental reduction of sodium in drinking water: effects on blood pressure. Toxicol Ind Health. 1985;1:19‐34. [DOI] [PubMed] [Google Scholar]
- 17. Ellison RC, Capper AL, Stephenson WP, et al. Effects on blood pressure of a decrease in sodium use in institutional food preparation: the Exeter‐Andover Project. J Clin Epidemiol. 1989;42:201‐208. [DOI] [PubMed] [Google Scholar]
- 18. Buendia JR, Bradlee L, Daniels SR, Singer MR, Moore LL. Longitudinal effects of dietary sodium and potassium on blood pressure in adolescent girls. JAMA Pediatr. 2015;169:560‐568. [DOI] [PubMed] [Google Scholar]
- 19. Sacks FM, Svetkey LP, Vollmer WM, et al. Effects on blood pressure of reduced dietary sodium and the Dietary Approaches to Stop Hypertension (DASH) diet. N Engl J Med. 2001;334:3‐10. [DOI] [PubMed] [Google Scholar]
- 20. Couch SC, Saelens BE, Levin L, Dart K, Falciglia G, Daniels SR. The efficacy of a clinic‐based behavioral nutrition intervention emphasizing a DASH‐type diet for adolescents with elevated blood pressure. J Pediatr. 2008;152:494‐501. [DOI] [PubMed] [Google Scholar]
- 21. Krishna GG, Chusid P, Hoeldtke RD. Mild potassium depletion provokes renal sodium retention. J Clin Lab Med. 1987;109:724‐730. [PubMed] [Google Scholar]
- 22. Gallen IW, Rosa RM, Esparaz DY, et al. On the mechanism of the effects of potassium restriction on blood pressure and renal sodium retention. Am J Kidney Dis. 1998;31:19‐27. [DOI] [PubMed] [Google Scholar]
- 23. Kanbay M, Bayram Y, Solak Y, Sanders PW. Dietary potassium: a key mediator of the cardiovascular response to dietary sodium chloride. J Am Soc Hypertens. 2013;7:395‐400. [DOI] [PMC free article] [PubMed] [Google Scholar]
- 24. Adrogue HJ, Madias NE. Sodium and potassium in the pathogenesis of hypertension. N Engl J Med. 2007;356:1966‐1978. [DOI] [PubMed] [Google Scholar]
- 25. Castro H, Raij L. Potassium in hypertension and cardiovascular disease. Semin Nephrol. 2013;33:277‐289. [DOI] [PubMed] [Google Scholar]
- 26. Kanbay M, Chen Y, Solak Y, Sanders PW. Mechanisms and consequences of salt sensitivity and dietary salt intake. Curr Opin Nephrol Hypertens. 2011;20:37‐43. [DOI] [PMC free article] [PubMed] [Google Scholar]
- 27. Feng W, Dell'Italia LJ, Sanders PW. Novel paradigms of salt and hypertension. J Am Soc Nephrol. 2017; DOI: 10.1681/ASN.2016080927 [Epub ahead of print] [DOI] [PMC free article] [PubMed] [Google Scholar]
- 28. Sinaiko AR, Gomez‐Marin O, Prineas RJ. Effect of low sodium diet or potassium supplementation on adolescent blood pressure. Hypertension. 1993;21:989‐994. [DOI] [PubMed] [Google Scholar]
- 29. U.S. Department of Health and Human Services and US Department of Agriculture . 2015–2020 Dietary Guidelines for Americans, 8th ed; 2015. http://health.gov/dietaryguidelines/2015/guidelines/. Accessed June 15, 2015. [Google Scholar]
- 30. Appel LJ, Lichtenstein AH, Callahan EA, Sinaiko A, Van Horn L, Whitsel L . Reducing sodium intake in children: a public health investment. J Clin Hypertens (Greenwich). 2015;17:657‐662. [DOI] [PMC free article] [PubMed] [Google Scholar]
- 31. Falkner B, Gidding SS, Portman R, Rosner B. Blood pressure variability and classification of prehypertension and hypertension in adolescence. Pediatrics. 2008;122:238‐242. [DOI] [PubMed] [Google Scholar]
- 32. Tirosh A, Afek A, Rudich A, et al. Progression of normotensive adolescents to hypertensive adults: a study of 26,980 teenagers. Hypertension. 2010;56:203‐209. [DOI] [PubMed] [Google Scholar]
- 33. Rhodes DG, Murayi T, Clemens JC, Baer DJ, Sebastian RS, Moshfegh AJ. The USDA automated multiple‐pass method accurately assesses population sodium intakes. Am J Clin Nutr. 2013;97:958‐964. [DOI] [PubMed] [Google Scholar]
- 34. Mercado CI, Cogswell ME, Valerrama AL, et al. Difference between 24‐h diet recall and urine excretion for assessing population sodium and potassium intake in adults aged 18‐39 y. Am J Clin Nutr. 2015;101:376‐386. [DOI] [PMC free article] [PubMed] [Google Scholar]
- 35. Moshfegh AJ, Rhodes DG, Baer DJ, et al. The US Department of Agriculture automated multiple‐pass method reduces bias in the collection of energy intakes. Am J Clin Nutr. 2008;88:324‐332. [DOI] [PubMed] [Google Scholar]
- 36. Liu K, Stamler J. Assessment of sodium intake in epidemiological studies on blood pressure. Ann Clin Res. 1984;16(suppl 43):49‐54. [PubMed] [Google Scholar]