

Abstract
A meta‐analysis was conducted to evaluate the association between duration of oral contraceptive use and risk of hypertension. Relevant studies published in English or Chinese were identified by a search of PubMed, Web of Science, Wanfang Database, and China National Knowledge Infrastructure to January 2017. Seventeen articles containing 24 studies with 270,284 participants were included in this meta‐analysis. The pooled relative risk of hypertension for the highest vs lowest category of oral contraceptive duration was 1.47 (95% confidence interval, 1.25–1.73), and excluding three studies with a relative risk >3.0 yielded a pooled relative risk of 1.26 (95% confidence interval, 1.11–1.44). A linear dose‐response relationship was found (P nonlinearity=0.69) and the risk of hypertension increased by 13% (relative risk, 1.13; 95% confidence interval, 1.03–1.25) for every 5‐year increment in oral contraceptive use. The duration of oral contraceptive use was positively associated with the risk of hypertension in this meta‐analysis.
Keywords: hypertension, meta‐analysis, oral contraceptive use
1. INTRODUCTION
Oral contraception is an important and widely acceptable contraceptive modality worldwide.1 Since their introduction in the 1960s, oral contraceptives have developed quickly and been used by an increasing number of individuals. In 2015, rates of married or in‐union women aged 15 to 49 years who took oral contraceptives in the United States and the United Kingdom were around 16% and 28%, respectively.2 Although the prevalence rate of oral contraceptive use in China is only 1.2% among married or in‐union women aged 15 to 49 years, the absolute number of oral contraceptive users was higher because of the large general population.2 Therefore, even small health effects of oral contraceptives on the risk of hypertension could have considerable public health consequences.
As an effective birth control method, oral contraceptive use not only decreases unwanted pregnancies but also generates many noncontraceptive health benefits, including improving menorrhagia and dysmenorrhea and reducing premenstrual dysphoric disorder symptoms3 and the risk of death from ovarian4 and endometrial5 cancers. Despite these benefits, some studies have suggested that oral contraceptive use can lead to adverse health effects such as cervical cancer, breast cancer,6 and ischemic stroke.7Oral contraceptive use reduces the level of high‐density lipoprotein cholesterol and increases the level of low‐density lipoprotein cholesterol, triglycerides, and the area under the curve for the glucose tolerance.8 Further, oral contraceptive use increases the risk of venous thromboembolism9 and myocardial infarction.10
Meanwhile, some observational studies have been conducted to assess the association between duration of oral contraceptive use and risk of hypertension. Several studies have indicated that oral contraceptive use increases the risk of hypertension11, 12, 13, 14, 15, 16, 17, 18, 19, 20 but no association has been found in other studies.21, 22, 23, 24, 25, 26 In addition, an inverse association between duration of oral contraceptive use and risk of hypertension was also found in one study.27
Therefore, we conducted a meta‐analysis to: (1) assess the effect of oral contraceptive duration on the risk of hypertension, and (2) evaluate the possible dose‐response relationship between oral contraceptive duration and risk of hypertension.
2. MATERIALS AND METHODS
We referred to the Preferred Reporting Items for Systematic Reviews and Meta‐Analyses guidelines in this meta‐analysis.28
2.1. Search strategy
We performed a literature search to January 2017 using the following databases: (1) PubMed; (2) Web of Science; (3) Wanfang Database; and (4) China National Knowledge Infrastructure. The search terms included “high blood pressure” OR “hypertension” AND “contraceptive” OR “oral contraceptive.” We also reviewed the reference lists of the included articles to identify additional studies not captured by our database search. Studies published in English or Chinese were considered in this meta‐analysis.
2.2. Inclusion criteria
The inclusion criteria were as follows: (1) observational study (case‐control, cohort, or cross‐sectional) published as an original study; (2) exposure of interest of oral contraceptive use; (3) outcome of interest of hypertension; (4) relative risk (RR) with corresponding 95% confidence interval (CI) (or data available to calculate these values); and (5) if a study had been published more than once, the most recent and complete article was chosen. All selected studies were carefully reviewed by two independent investigators (HL and JY). If there was disagreement by the two reviewers about the eligibility of an article, it was resolved by discussion with the third investigator (DZ).
2.3. Data extraction
Data were extracted by two independent investigators (HL and WW) who reached a consensus on all of the items, and the data were reviewed by the third investigator (DZ). Information extracted from each study was as follows: (1) the first author's name; (2) publication year; (3) country and continent where the study was conducted; (4) age range of patients; (5) study design; (6) exposure classification; (7) hypertension standard (mm Hg); (8) hypertension assessment (measurement or self‐report); (9) sample size and number of cases; (10) years of follow‐up; (11) RR (we presented all results with RR for simplicity) with corresponding 95% CIs for the highest vs lowest category of oral contraceptive use; and (12) variables adjusted for in the analysis. We extracted the RR that reflected the greatest degree of control for potential confounders.
For dose‐response analysis, the number of cases and participants and RRs (95% CIs) for each category of oral contraceptive use were extracted. The median or mean level of oral contraceptive use for each category was assigned to the corresponding RR for every study. If the upper boundary of the highest category was not provided, we supposed that the boundary had the same amplitude as the contiguous category.29
2.4. Assessment of risk of bias
The Newcastle‐Ottawa Quality Assessment Scale30 was used to assess the overall quality and risk of bias. Quality of selection, comparability, and outcome (exposure) of study participants are three major parameters. Two investigators (HL and JY) independently assessed study quality and any discrepancies were resolved by discussing with the third investigator (DZ).
2.5. Data synthesis
Pooled values were calculated as the inverse variance–weighted mean of the logarithm of RR with 95% CI to assess the strength of association between duration of oral contraceptive use and risk of hypertension. The I 2 was adopted to assess the heterogeneity between studies (I 2 values of 0%, 25%, 50%, and 75% represented no, low, moderate, and high heterogeneity, respectively; P<.1).31 The random effects model was used as the pooled method. Meta‐regression was performed to evaluate the potentially important covariates that might exert substantial impacts on between‐study heterogeneity.32 Influence analysis was performed with one study removed at a time to assess whether the results could be markedly affected by a single study.33 Sensitivity analyses was conducted by removing three studies (RR >3) to assess whether the results were stable. The Egger34 regression asymmetry test and the funnel plot were adopted to evaluate small‐study effect. Subgroup analysis was performed by study design (cross‐sectional, case‐control, or cohort), continent where the studies were conducted (Oceania, Asia, North America, or Europe), hypertension assessment (self‐report, measurement), developed country, and developing country. In the cumulative meta‐analysis, studies were added one at a time in the order of publication year, and the results were summarized sequentially.35
For dose‐response analysis, a two‐stage random‐effects dose‐response meta‐analysis36 was performed to compute the trend from the correlated log RR estimates across years of oral contraceptive use. In the first stage, a restricted cubic spline model with three knots at the 10th, 50th, and 90th percentiles37 of the years of oral contraceptive use was estimated using generalized least squares regression, taking into account the correlation within each set of published RRs.38 Then, the study‐specific estimates were combined using the restricted maximum likelihood method in a multivariate random‐effects meta‐analysis.39 A P value for nonlinearity was calculated by testing the null hypothesis that the coefficient of the second spline was equal to 0.
All statistical analyses were performed with STATA version 12.0 (StataCorp). All reported P values were two‐sided with a statistical significance level of .05.
3. RESULTS
3.1. Study selection and study characteristics
A total of 6222 articles were retrieved. Five additional articles were found through the reference lists of included articles. After excluding duplicate reports, studies not in humans and not published in English and Chinese, and screening titles and abstracts, we identified 25 potentially relevant records (Figure 1). Three records about the history of hypertension related to the trend of oral contraceptive use, two records for the same study population, one record about menopausal hormone therapy, and two records for prehypertension were further removed. Finally, seventeen published articles including 24 eligible studies with 270 284 participants met the inclusion criteria. Among the included studies, there were one case‐control study, four cohort studies, and 19 cross‐sectional studies, which were conducted in Oceania, Asia, Europe, and North America. Hypertension was assessed by self‐report in 11 studies, and the other 13 studies assessed hypertension by measurement. Eighteen studies were conducted in developed countries, and six studies were conducted in developing countries. The baseline characteristics of the included studies are shown in Table 1. Study quality was assessed with the Newcastle‐Ottawa Scale (Table S1).
Figure 1.
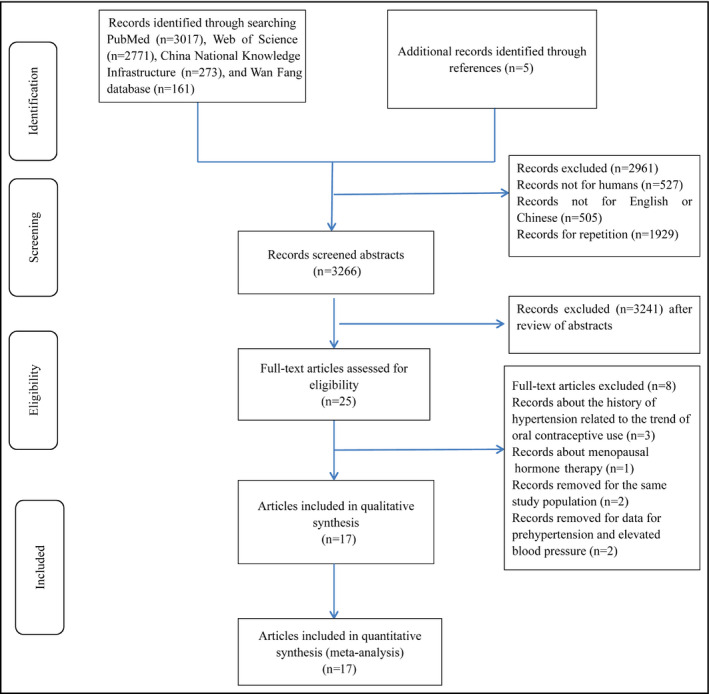
Flowchart of the selection of studies included in the meta‐analysis
Table 1.
Detailed characteristics of the included studies
| Author (year) | Country, continent | Age, y | Study design | Exposure classification | Hypertension standard, mm Hg | Hypertension assessment | Sample (cases) Follow‐up years | RR | 95% CI | Adjustment for covariates |
|---|---|---|---|---|---|---|---|---|---|---|
| Chiu (2015)11 |
Australia Oceania Developed country |
45–58 | CS | Past user | NA | Self‐reported | 5478 (573) | 1.26 | (1.02–1.56) | NA |
| Chiu (2015)11 |
Australia Oceania Developed country |
58–66 | CS | Past user | NA | Self‐reported | 4233 (868) | 0.98 | (0.84–1.15) | NA |
| Chiu (2015)11 |
Australia Oceania Developed country |
>67 | CS | Past user | NA | Self‐reported | 7446 (2459) | 0.97 | (0.87–1.08) | NA |
| Wei (2011)12 |
China Asia Developing country |
NA | CC | User | SBP ≥140 DBP ≥90 | Measurement | 709 (359) | 1.49 | (1.06–2.11) | Region, age |
| White (2013)21 |
America North America Developed country |
18–44 | CH | User | SBP ≥140 DBP ≥90 | Measurement |
810 (71) 0.75 |
1.55 | (0.94–2.55) | NA |
| Park (2013)13 |
Korean Asia Developed country |
35–55 | CS | User | SBP ≥140 DBP ≥90 | Measurement | 2920 (424) | 1.96 | (1.03–3.73) | Age, BMI, education, income, exercise, cigarette smoking, and alcohol consumption |
| Chasan‐Taber (1996)14 |
America North America Developed country |
25–42 | CH | Past user | SBP ≥140 DBP ≥90 | Self‐reported |
47 787 (1407) 4 y |
1.2 | (1.0–1.4) | Age, BMI, parity, alcohol intake, cigarette smoking, ethnicity, family history of hypertension, and physical activity |
| Chasan‐Taber (1996)14 |
America North America Developed country |
25–42 | CH | Current user | SBP ≥140 DBP ≥90 | Self‐reported |
9727 (374) 4 y |
1.8 | (1.5–2.3) | Age, BMI, parity, alcohol intake, cigarette smoking, ethnicity, family history of hypertension, and physical activity |
| Karabay (2013)22 |
Turkey Asia Developing country |
<50 | CS | User | NA | Self‐reported | 101 (37) | 0.31 | (0.03–1.59) | NA |
| Du (2007)15 |
Germany Europe Developed country |
18–79 | CS | User | SBP ≥140 DBP ≥90 | Self‐reported | 1240 (177) | 1.47 | (1.05–2.06) | NA |
| Stampfer (1990)16 |
America North America Developed country |
30–55 | CS | User | NA | Self‐reported | 11 9061 (16 330) | 1.41 | (1.36–1.46) | NA |
| Russell‐Briefel (1986)27 |
America North America Developed country |
20–44 | CS | User | SBP ≥140 DBP ≥90 | Measurement | 2342 (186) | 0.63 | (0.42–0.92) | NA |
| Yang (2009)23 |
Swedish Europe Developed country |
30–49 | CS | User | NA | Self‐reported | 45 729 (4048) | 0.98 | (0.89–1.07) | NA |
| Singh (2011)17 |
India Asia Developing country |
>25 | CS | User | SBP ≥140 DBP ≥90 | Measurement | 2498 (933) | 8.11 | (4.26–16.71) | NA |
| Sidney (1996)24 |
America North America Developed country |
15–44 | CS | User | NA | Self‐reported | 339 (23) | 1.73 | (0.49–9.33) | NA |
| Nyklíček (2009)18 |
Netherlands Europe Developed country |
20–55 | CS | User | SBP ≥140 DBP ≥90 | Measurement | 985 (92) | 2.23 | (1.31–3.79) | NA |
| Greenblatt (1974)25 |
America North America Developed country |
20–24 | CS | User | SBP ≥140 DBP ≥90 | Measurement | 229 (48) | 1.98 | (0.97–4) | NA |
| Greenblatt (1974)25 |
America North America Developed country |
25–29 | CS | User | SBP ≥140 DBP ≥90 | Measurement | 233 (66) | 1.27 | (0.62–2.54) | NA |
| Greenblatt (1974)25 |
America North America Developed country |
30–34 | CS | User | SBP ≥140 DBP ≥90 | Measurement | 153 (45) | 0.64 | (0.22–1.72) | NA |
| Greenblatt (1974)25 |
America North America Developed country |
35–39 | CS | User | SBP ≥140 DBP ≥90 | Measurement | 146 (52) | 1.72 | (0.53–5.39) | NA |
| Greenblatt (1974)25 |
America North America Developed country |
40–44 | CS | User | SBP ≥140 DBP ≥90 | Measurement | 160 (78) | 3.43 | (0.81–20.35) | NA |
| Farahmand (2016)26 |
Iran Asia Developing country |
18–55 | CS | User | SBP ≥130 DBP ≥85 | Self‐reported | 2794 (NA) | 1 | (0.6–1.6) | Age, parity, and education |
| Chen (2002)19 |
China Asia Developing country |
19–60 | CH | User | SBP ≥140 | Measurement | 14 084 (238) | 4.89 | (3.79–6.34) | NA |
| Zhao (2007)20 |
China Asia Developing country |
24–45 | CS | User |
DBP ≥90 SBP ≥140 DBP ≥90 |
Measurement | 1080 (115) | 1.77 | (1.14–2.81) | NA |
Abbreviations: BMI, body mass index; CC, case‐control; CH, cohort study; CI, confidence interval; CS, cross‐sectional study; DBP, diastolic blood pressure; NA, not available; RR, relative risk; SBP, systolic blood pressure.
3.2. Synthesis of results
Results of the pooled analysis are summarized in Table 2. The pooled RR of hypertension for the highest vs lowest category of oral contraceptive use was 1.47 (95% CI, 1.25–1.73). In subgroup analysis stratified by study design, the pooled RRs for cross‐sectional and cohort studies were 1.31 (95% CI, 1.11–1.55) and 2.02 (95% CI, 1.07–3.82), respectively (Figure S1). A significant association between oral contraceptive use and the risk of hypertension was found in studies conducted in Asia (RR, 2.12; 95% CI, 1.15–3.91), North America (RR, 1.32; 95% CI, 1.10–1.59), developed countries (RR, 1.26; 95% CI, 1.09–1.45), and developing countries (RR, 2.13; 95% CI, 1.06–4.27). In subgroup analysis stratified by hypertension assessment methods, the pooled RRs were 1.89 (95% CI, 1.21–2.95) for studies in which hypertension was assessed by self‐report and 1.19 (95% CI, 1.02–1.40) for studies by measurement (Figure S2). A cumulative meta‐analysis was conducted to reflect the dynamic trend of results and evaluate the influence of a new included study on the overall results. Results indicated that the risk of hypertension was not significantly different in oral contraceptive users and nonusers until adding a study in 1996 by Chasan‐Taber and colleagues.14 Thereafter, the significant difference tended to be stable (Figure 2).
Table 2.
Summary risk estimates of the association between duration of oral contraceptive use and risk of hypertension
| Study characteristics | No. of studies | RR (95 % CI) | I 2 (%) | P value |
|---|---|---|---|---|
| All studies | 24 | 1.47 (1.25–1.73) | 91.30 | .000 |
| Exclude RR >3 | 21 | 1.26 (1.11–1.44) | 85.20 | .000 |
| Study design | ||||
| Cross‐sectional study | 19 | 1.31 (1.11–1.55) | 88.30 | .000 |
| Case‐control study | 1 | 1.49 (1.06–2.10) | – | – |
| Cohort study | 4 | 2.02 (1.07–3.82) | 96.30 | .000 |
| Continent | ||||
| Oceania | 3 | 1.04 (0.90–1.19) | 58.70 | .089 |
| Asia | 7 | 2.12 (1.15–3.91) | 91.00 | .000 |
| North America | 11 | 1.32 (1.10–1.59) | 66.00 | .001 |
| Europe | 3 | 1.39 (0.88–2.19) | 85.20 | .001 |
| Hypertension assessment | ||||
| Self‐reported | 11 | 1.19 (1.02–1.40) | 91.00 | .000 |
| Measurement | 13 | 1.89 (1.21–2.95) | 88.70 | .000 |
| Developed country and developing country | ||||
| Developed country | 18 | 1.26 (1.09–1.45) | 86.90 | .000 |
| Developing country | 6 | 2.13 (1.06–4.27) | 92.40 | .000 |
Abbreviations: CI, confidence interval; NA, not available; RR, relative risk.
Figure 2.
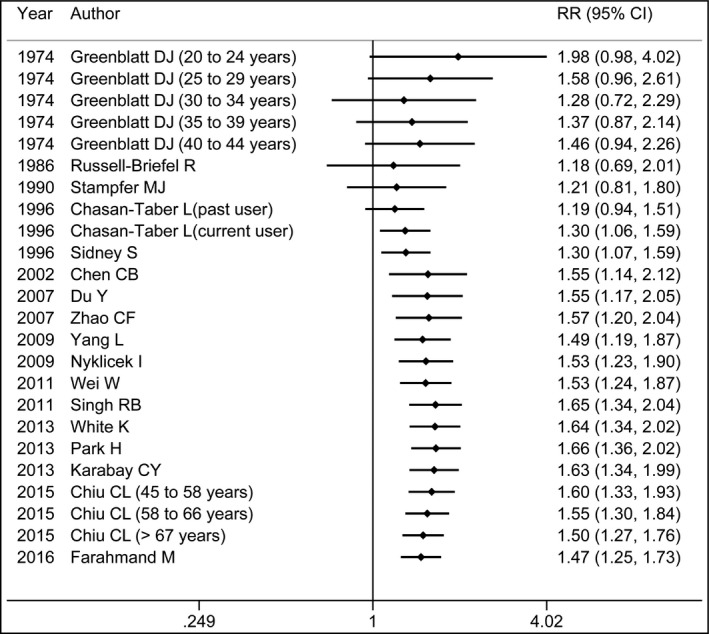
Cumulative meta‐analysis of the risk of hypertension among oral contraceptive users compared with nonusers. The black points indicate the pooled effect values. The horizontal lines represent 95% confidence intervals (CIs)
For dose‐response analysis, data from six studies11, 12, 13, 14 including 8714 hypertension cases were analyzed. A linear relationship was found between oral contraceptive use and the risk of hypertension (P nonlinearity=0.69), and the RRs of hypertension were 1.01 (95% CI, 1.00–1.02), 1.03 (95% CI, 0.99–1.08), 1.08 (95% CI, 1.01–1.16), 1.12 (95% CI, 1.05–1.20), 1.16 (95% CI, 1.04–1.28), and 1.19 (95% CI, 1.02–1.40) for 0.5, 2.5, 7.5, 12.5, 17.5, and 22.5 years of oral contraceptive use compared with 0 year, respectively (Figure 3). In addition, the dose‐response analysis suggested that the risk of hypertension increased by 13% (RR, 1.13; 95% CI, 1.03–1.25) for every 5‐year increment in oral contraceptive use.
Figure 3.
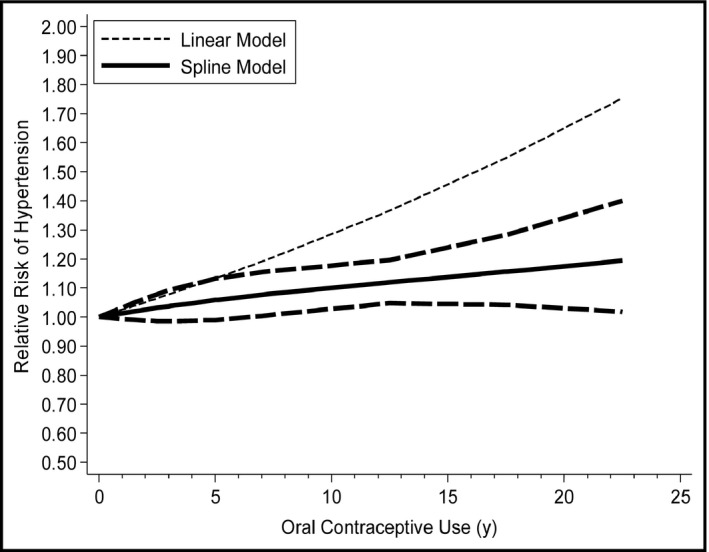
The dose‐response analysis between oral contraceptive use and the risk of hypertension with restricted cubic splines in a multivariate random‐effects dose‐response model. The solid lines and long dash lines represent the estimated relative risks (RRs) and their 95% confidence intervals (CIs). The short dash lines represent the linear relationship
3.3. Sources of heterogeneity and sensitivity analyses
As seen in Figure 4, high heterogeneity was found. Therefore, a univariate meta‐regression analysis with the covariates of publication year (P=.863), continent where the studies were conducted (P=.946), study design (P=.211), sample size (P=.715), quality scores (P=.128), hypertension assessment methods (P=.045), and whether the RR was adjusted for confounders (P=.855) was conducted to explore the between‐study heterogeneity. After excluding three articles (RR >3.00) conducted by Chen,19 Singh and colleagues,17 and Greenblatt and coworkers,25 the result was also statistically significant and the pooled RR was 1.26 (95% CI, 1.11–1.44).
Figure 4.
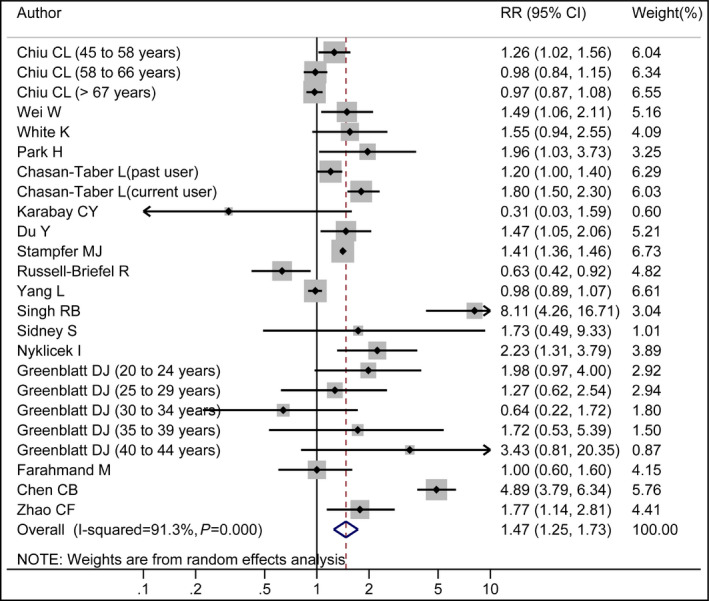
Forest plot of oral contraceptive use and risk of hypertension. White diamond denotes the pooled RR. The size of gray box is positively proportional to the weight assigned to each study. Black point indicates the RR in each study, and the horizontal lines represent the 95% confidence intervals (CIs).
3.4. Influence analysis and small‐study effect
No individual study was found to have an excessive influence on the pooled effect in influence analysis (Figure S3). The pooled RR ranged from 1.34 (95% CI, 1.17–1.54) to 1.53 (95% CI, 1.30–1.80). No significant small‐study effect was found by visual inspection of the funnel plot (Figure S4) and Egger test (P=.707).
4. DISCUSSION
4.1. Main findings
Oral contraceptive use has been inconsistently associated with risk of hypertension in some publications, and individual studies with a relatively small number of participants may be underpowered to detect an association. In this meta‐analysis, based on 24 studies including 270 284 participants, a positive association was found between duration of oral contraceptive use and risk of hypertension, and the association was consistent in most subgroup analysis. In addition, a linear relationship was found between duration of oral contraceptive use and risk of hypertension, and the risk of hypertension increased by 13% for every 5‐year increment in oral contraceptive use.
4.2. Biologic plausibility
Hypertension is regarded as a complex‐trait disease resulting from interactions between genetic and environmental factors such as family history of hypertension, sedentary behavior, and overweight or obese status, along with increased intake of salt and alcohol.40, 41 However, the detailed biological mechanisms underlying the association between oral contraceptive use and hypertension are still poorly understood. First, oral contraceptives can activate the renin‐angiotensin system42 by upregulation of intrarenal angiotensin‐converting enzyme 1 and angiotensin II type 1 receptor.43, 44 Second, oral contraceptive use causes endothelial dysfunction by increasing circulating uric acid, impairing the endothelium‐dependent nitric oxide pathway and elevating proinflammatory biomarkers such as plasminogen activator inhibitor‐145 and C‐reactive protein.44 Moreover, progesterone in oral contraceptives increases the aminopeptidase P protein and mRNA expression. Increased aminopeptidase P protein can break down the vasodilator peptide bradykinin and increase blood pressure.46 Insulin resistance, which could be increased by progesterone,43 has been shown to be correlated to hypertension.47, 48
4.3. Between‐study heterogeneity
Between‐study heterogeneity is common in meta‐analyses and it is necessary to explore the potential sources of between‐study heterogeneity. Many indeterminate characteristics among the studies may account for the between‐study heterogeneity. Thus, we used meta‐regression to explore the potential causes of the between‐study heterogeneity. First, the age of the patients was different, which can lead to between‐study heterogeneity. Second, original studies did not offer the types and dosages of the oral contraceptives. Oral contraceptives have been developing and the ratio of estrogen and progestin has been changing with time. Current oral contraceptives have lower doses of estrogen and newer progestin than first‐ and second‐generation oral contraceptives. This can lead to the change in blood pressure outcome. Third, the definition of nonuser and highest category of oral contraceptive user were inconsistent. The nonuser categories ranged from 0 to <3 months of oral contraceptive use. Moreover, for the highest vs lowest category of oral contraceptive use, the highest intake categories ranged from >2 years to >20 years. Fourth, blood pressure was measured by different types of sphygmomanometers including a desktop mercury sphygmomanometer, an automated Omron HEM 705CP blood pressure monitor (Omron Healthcare), a mercury sphygmomanometer, and a Philips HP 5330 automatic digital device (Philips Healthcare). Hypertension was assessed by self‐report in 11 studies, and the question in these seven studies was, “In the past, have you been treated for: high blood pressure?” All of these factors might contribute to between‐study heterogeneity.
4.4. Strengths and limitations
This meta‐analysis has several strengths. First, influence analysis showed that no individual study had an excessive influence on the pooled effect. Second, a significantly statistical association was found in cohort studies that provided better evidence for causality. Third, the RR adjusted for the most confounders in the original studies were extracted, which makes the results more credible. Fourth, dose‐response analyses were conducted to explore the relationships between oral contraceptive use and the risk of hypertension quantitatively. Fifth, the results of the cumulative meta‐analysis, with the addition of new studies year by year, indicated that oral contraceptive use was associated with the risk of hypertension and the RR tended to be stable. Sixth, the included studies in our meta‐analysis had high study quality. Finally, current oral contraceptive use was defined as the use of oral contraceptives for at least 2 months, and the use of oral contraceptives precedes hypertension incidence. Therefore, our study clarified a sequential relationship.
There are also several limitations in our study. First, some studies did not adjust for confounding factors, confounders that were adjusted for in each study were different, and there were some additional unknown confounders that might result in residual confounding. Second, self‐reported hypertension was used as the diagnostic criteria in many studies and the potential misclassification of hypertension might affect the accuracy of the results. Third, the different dosages and types of oral contraceptives in the studies might have influenced the between‐study heterogeneity. However, we could not perform subgroup analysis by the specific dosages and types of oral contraceptives because of the absence of information in the original studies. Fourth, in subgroup analysis by continent where the studies were conducted, a significant association between duration of oral contraceptive use and risk of hypertension was found for studies conducted in North America and Asia, but no association was found for studies conducted in Oceania and Europe. The differences in results might result from the small sample size and small population in each subgroup. Fifth, women with a history of hypertensive disorders during pregnancy (a high‐risk group for future hypertension) are often discouraged from using oral contraceptives, which might have a minor effect on our results.
4.5. Conclusions and implications
Findings from this meta‐analysis indicate that oral contraceptive use may be associated with hypertension. These results need to be confirmed by larger prospective cohort studies. In view of the global prevalence rate of oral contraceptive use, the importance of careful monitoring of women who take oral contraceptives should be underscored.
CONFLICT OF INTEREST
The authors report no conflicts of interest to disclose.
Supporting information
Liu H, Yao J, Wang W, Zhang D. Association between duration of oral contraceptive use and risk of hypertension: A meta‐analysis. J Clin Hypertens. 2017;19:1032–1041. 10.1111/jch.13042
REFERENCES
- 1. Benagiano G, Bastianelli C, Farris M. Contraception today. Ann N Y Acad Sci. 2006;1092:1‐32. [DOI] [PubMed] [Google Scholar]
- 2. United Nations, Department of Economic and Social Affairs, Population Division . Trends in Contraceptive Use Worldwide 2015 (ST/ESA/SER.A/349). 2015. http://www.un.org/en/development/desa/population/publications/pdf/family/trendsContraceptiveUse2015Report.pdf. Accessed December 11, 2016. [Google Scholar]
- 3. Maguire K, Westhoff C. The state of hormonal contraception today: established and emerging noncontraceptive health benefits. Am J Obstet Gynecol. 2011;205:S4‐S8. [DOI] [PubMed] [Google Scholar]
- 4. Hatzipetros I, Gocze P, Farkas B. Oral contraceptive pills as primary prevention for ovarian cancer: a systematic review and meta‐analysis. Obstet Gynecol. 2013;122:1114. [DOI] [PubMed] [Google Scholar]
- 5. Collaborative Group on Epidemiological Studies on Endometrial Cancer. Endometrial cancer and oral contraceptives: an individual participant meta‐analysis of 27 276 women with endometrial cancer from 36 epidemiological studies. Lancet Oncol. 2015;16:1061‐1070. [DOI] [PubMed] [Google Scholar]
- 6. Gierisch JM, Coeytaux RR, Urrutia RP, et al. Oral contraceptive use and risk of breast, cervical, colorectal, and endometrial cancers: a systematic review. Cancer Epidemiol Biomarkers Prev. 2013;22:1931‐1943. [DOI] [PubMed] [Google Scholar]
- 7. Peragallo Urrutia R, Coeytaux RR, McBroom AJ, et al. Risk of acute thromboembolic events with oral contraceptive use: a systematic review and meta‐analysis. Obstet Gynecol. 2013;122:380‐389. [DOI] [PubMed] [Google Scholar]
- 8. Shufelt CL, Bairey Merz CN. Contraceptive hormone use and cardiovascular disease. J Am Coll Cardiol. 2009;53:221‐231. [DOI] [PMC free article] [PubMed] [Google Scholar]
- 9. Plu‐Bureau G, Maitrot‐Mantelet L, Hugon‐Rodin J, Canonico M. Hormonal contraceptives and venous thromboembolism: an epidemiological update. Best Pract Res Clin Endocrinol Metab. 2013;27:25‐34. [DOI] [PubMed] [Google Scholar]
- 10. Lalude OO. Risk of cardiovascular events with hormonal contraception: insights from the Danish cohort study. Curr Cardiol Rep. 2013;15:374. [DOI] [PubMed] [Google Scholar]
- 11. Chiu CL, Lind JM. Past oral contraceptive use and self‐reported high blood pressure in postmenopausal women. BMC Public Health. 2015;15:54. [DOI] [PMC free article] [PubMed] [Google Scholar]
- 12. Wei W, Li Y, Chen F, et al. Dyslipidaemia, combined oral contraceptives use and their interaction on the risk of hypertension in Chinese women. J Hum Hypertens. 2011;25:364‐371. [DOI] [PubMed] [Google Scholar]
- 13. Park H, Kim K. Associations between oral contraceptive use and risks of hypertension and prehypertension in a cross‐sectional study of Korean women. BMC Womens Health. 2013;13:39. [DOI] [PMC free article] [PubMed] [Google Scholar]
- 14. Chasan‐Taber L, Willett WC, Manson JE, et al. Prospective study of oral contraceptives and hypertension among women in the United States. Circulation. 1996;94:483‐489. [DOI] [PubMed] [Google Scholar]
- 15. Du Y, Melchert HU, Schafer‐Korting M. Use of oral contraceptives in Germany: prevalence, determinants and use‐associated health correlates. Results of National Health Surveys from 1984 to 1999. Eur J Obstet Gynecol Reprod Biol. 2007;2007:57‐66. [DOI] [PubMed] [Google Scholar]
- 16. Stampfer MJ, Willett WC, Colditz GA, et al. Past use of oral contraceptives and cardiovascular disease: a meta‐analysis in the context of the Nurses’ Health Study. Am J Obstet Gynecol. 1990;163:285‐291. [DOI] [PubMed] [Google Scholar]
- 17. Singh RB, Fedacko J, Pella D, et al. Prevalence and risk factors for prehypertension and hypertension in five Indian cities. Acta Cardiol. 2011;66:29‐37. [DOI] [PubMed] [Google Scholar]
- 18. Nyklicek I, Vingerhoets A. ‘Adaptive’ psychosocial factors in relation to home blood pressure: a study in the general population of southern Netherlands. Int J Behav Med. 2009;16:212‐218. [DOI] [PMC free article] [PubMed] [Google Scholar]
- 19. Chen C. Effects of long‐term oral contraceptives on women's blood pressure. Chin J Hypertension. 2002;10:21‐23. [Google Scholar]
- 20. Zhao C, Zhang X, Liu H, et al. Effects of long term oral contraceptive use on hypertension and coronary heart disease in 1180 women of childbearing age. Cent Plains Med J. 2007;34:85‐86. [Google Scholar]
- 21. White K, Potter JE, Hopkins K, et al. Hypertension among oral contraceptive users in El Paso, Texas. J Health Care Poor Underserved. 2013;24:1511‐1521. [DOI] [PMC free article] [PubMed] [Google Scholar]
- 22. Karabay CY, Kocabay G, Oduncu V, et al. Drospirenone‐containing oral contraceptives and risk of adverse outcomes after myocardial infarction. Catheter Cardiovasc Interv. 2013;82:387‐393. [DOI] [PubMed] [Google Scholar]
- 23. Yang L, Kuper H, Sandin S, et al. Reproductive history, oral contraceptive use, and the risk of ischemic and hemorrhagic stroke in a cohort study of middle‐aged Swedish women. Stroke. 2009;40:1050‐1058. [DOI] [PubMed] [Google Scholar]
- 24. Sidney S, Petitti DB, Quesenberry CP, et al. Myocardial infarction in users of low‐dose oral contraceptives. Obstet Gynecol. 1996;88:939‐944. [DOI] [PubMed] [Google Scholar]
- 25. Greenblatt DJ, Koch‐weser J. Oral contraceptives and hypertension. A report from the Boston Collaborative Drug Surveillance Program. Obstet Gynecol. 1974;44:412‐417. [PubMed] [Google Scholar]
- 26. Farahmand M, Ramezani Tehrani F, Rostami Dovom M, et al. The impact of oral contraceptives on cardiometabolic parameters. J Endocrinol Invest. 2016;39:277‐283. [DOI] [PubMed] [Google Scholar]
- 27. Russell‐Briefel R, Ezzati TM, Fulwood R, et al. Cardiovascular risk status and oral contraceptive use: United States, 1976‐1980. Prev Med. 1986;15:352‐362. [DOI] [PubMed] [Google Scholar]
- 28. Moher D, Liberati A, Tetzlaff J, Altman DG; PRISMA Group. Preferred reporting items for systematic reviews and meta‐analyses: the PRISMA statement. Ann Intern Med. 2009;151:264‐269, W64. [DOI] [PubMed] [Google Scholar]
- 29. Larsson SC, Orsini N. Coffee consumption and risk of stroke: a dose‐response meta‐analysis of prospective studies. Am J Epidemiol. 2011;174:993‐1001. [DOI] [PubMed] [Google Scholar]
- 30. Stang A. Critical evaluation of the Newcastle‐Ottawa scale for the assessment of the quality of nonrandomized studies in meta‐analyses. Eur J Epidemiol. 2010;25:603‐605. [DOI] [PubMed] [Google Scholar]
- 31. Higgins JP, Thompson SG, Deeks JJ, et al. Measuring inconsistency in meta‐analyses. BMJ. 2003;327:557‐560. [DOI] [PMC free article] [PubMed] [Google Scholar]
- 32. Higgins JP, Thompson SG. Controlling the risk of spurious findings from meta‐regression. Stat Med. 2004;23:1663‐1682. [DOI] [PubMed] [Google Scholar]
- 33. Tobias A. Assessing the influence of a single study in the meta‐analysis estimate. Stata Technical Bulletin. 1999;8:15‐17. [Google Scholar]
- 34. Egger M, Davey Smith G, Schneider M, et al. Bias in meta‐analysis detected by a simple, graphical test. BMJ. 1997;315:629‐634. [DOI] [PMC free article] [PubMed] [Google Scholar]
- 35. Bagos PG, Nikolopoulos GK. Generalized least squares for assessing trends in cumulative meta‐analysis with applications in genetic epidemiology. J Clin Epidemiol. 2009;62:1037‐1044. [DOI] [PubMed] [Google Scholar]
- 36. Orsini N, Li R, Wolk A, et al. Meta‐analysis for linear and nonlinear dose‐response relations: examples, an evaluation of approximations, and software. Am J Epidemiol. 2012;175:66‐73. [DOI] [PMC free article] [PubMed] [Google Scholar]
- 37. Harrell FE Jr, Lee KL, Pollock BG. Regression models in clinical studies: determining relationships between predictors and response. J Natl Cancer Inst. 1988;80:1198‐1202. [DOI] [PubMed] [Google Scholar]
- 38. Orsini N, Bellocco R, Greenland S. Generalized least squares for trend estimation of summarized dose‐response data. Stata J. 2006;6:40. [Google Scholar]
- 39. Jackson D, White IR, Thompson SG. Extending DerSimonian and Laird's methodology to perform multivariate random effects meta‐analyses. Stat Med. 2010;29:1282‐1297. [DOI] [PubMed] [Google Scholar]
- 40. Singh RB, Pella D, Mechirova V, et al. Prevalence of obesity, physical inactivity and undernutrition, a triple burden of diseases during transition in a developing economy. The Five City Study Group. Acta Cardiol. 2007;62:119‐127. [DOI] [PubMed] [Google Scholar]
- 41. Singh RB, Sharma JP, Rastogi V, et al. Prevalence of coronary artery disease and coronary risk factors in rural and urban populations of North India. Eur Heart J. 1997;18:1728‐1735. [DOI] [PubMed] [Google Scholar]
- 42. Olatunji LA, Soladoye AO. Oral contraceptive‐induced high blood pressure is prevented by renin‐angiotensin suppression in female rats but not by sympathetic nervous system blockade. Indian J Exp Biol. 2008;46:749‐754. [PubMed] [Google Scholar]
- 43. Olatunji LA, Usman TO, Seok YM, Kim IK. Activation of cardiac renin‐angiotensin system and plasminogen activator inhibitor‐1 gene expressions in oral contraceptive‐induced cardiometabolic disorder. Arch Physiol Biochem. 2016;123:1‐8. [DOI] [PubMed] [Google Scholar]
- 44. Olatunji LA, Seok YM, Igunnu A, et al. Combined oral contraceptive‐induced hypertension is accompanied by endothelial dysfunction and upregulated intrarenal angiotensin II type 1 receptor gene expression. Naunyn Schmiedebergs Arch Pharmacol. 2016;389:1147‐1157. [DOI] [PubMed] [Google Scholar]
- 45. Machado RB, Fabrini P, Cruz AM, et al. Clinical and metabolic aspects of the continuous use of a contraceptive association of ethinyl estradiol (30 microg) and gestodene (75 microg). Contraception. 2004;70:365‐370. [DOI] [PubMed] [Google Scholar]
- 46. Cilia La Corte AL, Carter AM, Turner AJ, Grant PJ, Hooper NM. The bradykinin‐degrading aminopeptidase P is increased in women taking the oral contraceptive pill. J Renin Angiotensin Aldosterone Syst. 2008;9:221‐225. [DOI] [PubMed] [Google Scholar]
- 47. Mulatero P, Morra di Cella S, Veglio F. Hypertension, genotype and oral contraceptives. Pharmacogenomics. 2002;3:57‐63. [DOI] [PubMed] [Google Scholar]
- 48. Godsland IF, Crook D, Simpson R, et al. The effects of different formulations of oral contraceptive agents on lipid and carbohydrate metabolism. N Engl J Med. 1990;323:1375‐1381. [DOI] [PubMed] [Google Scholar]
Associated Data
This section collects any data citations, data availability statements, or supplementary materials included in this article.
Supplementary Materials