

Abstract
The authors evaluated differences in the reliability of home blood pressure measurements taken in the morning, before dinner, and at bedtime. Forty‐eight patients with hypertension (age range, 50–89 years; mean age, 76.4 years) measured their home blood pressure using a validated automatic information/communication technology‐based device for 14 consecutive days. Those days were divided into the first seven days (1–7) and the following 8 to 14 days (days 8–14) and compared systolic blood pressure (SBP) reliability in the two periods for each measurement time point. In Bland‐Altman analyses, morning SBP showed the least standard error of measurement (3.0 mm Hg). There were fixed biases in morning and before‐dinner SBP with average limits of agreement of 3.9 and 6.4 mm Hg, respectively. For at‐bedtime SBP, a random error was detected and the minimal detectable change was 13.8 mm Hg. The percentage of near‐maximal variation of morning SBP was the smallest at 18.1%. Morning SBP therefore provided the most reliable home blood pressure value in the day.
Keywords: at‐bedtime blood pressure, before‐dinner blood pressure, morning blood pressure, reliability
1. INTRODUCTION
Home blood pressure (HBP) is strongly associated with target organ damage1 and cardiovascular outcomes.2, 3 HBP monitoring, which is recommended by many hypertension guidelines,4, 5, 6, 7, 8 has been used routinely in clinical practice because of its simplicity, convenience, and tolerability. The management of hypertension should be based on out‐of‐office blood pressure (BP) levels, and in Japan this management is based on HBP.8
BP levels fluctuate dramatically throughout the day. We reported that the morning BP level was markedly different from the evening BP level and that among the evening BP measurements, the evening BP values measured at bedtime, which may be affected by bathing and alcohol consumption, were 8.7 mm Hg lower than those measured before dinner.9 If the average of morning BP and at‐bedtime BP or only at‐bedtime BP values are used to assess the patient's cardiovascular risks, these HBP levels would be lower than morning BP values, possibly causing cardiovascular risks to be underestimated.
It is essential to evaluate HBP levels properly, particularly since the higher reliability of HBP measurement is the reason that it is considered to be an overall superior measure compared with clinic BP measurement.10 In fact, the reliability of HBP measurement is known to be similar to that of ambulatory BP monitoring,11 the reliability of which has been established.12, 13, 14 However, the evidence on the reliability of HBP when divided into morning and evening measurements is limited, and there are no data on the reliability of BP values taken before dinner. Thus, we hypothesized that the reliability of morning HBP would be higher than that of before‐dinner or at‐bedtime HBP, which may be affected by daily activities (eg, bathing and drinking).
Using data from the Condition study,9 a multicenter observational trial, we investigated the reliability of morning, before‐dinner, and at‐bedtime HBP in patients with hypertension.
2. METHODS
2.1. Patients
Patients in the Condition study9 were selected from among the participants in the PREDICT (Prediction of ICT‐Home Blood Pressure Variability) study. The protocol of the PREDICT study was registered on the University Hospital Medical Information Network Clinical Trials Registry website (trial No. UMIN000019871). Briefly, the PREDICT study is a prospective observational trial that aims to evaluate the use of HBP based on information and communication technology (ICT) for predicting cardiovascular events. Enrolled participants were asked to continuously measure their HBP during 2 years.
In the present study, 48 outpatients with essential hypertension recruited from two clinics were asked to measure their HBP. Twenty‐four of the patients were being treated at the Higashiagatsuma‐machi National Health Insurance Clinic, Gunma, Japan, and the other 24 patients were being treated at the Minamisanriku Public Medical Clinic, Miyagi, Japan. All patients were treated for hypertension and their medications were not changed during the study period. All patients provided written informed consent to participate in the study and to have their data published. The study was approved by the ethics committee of Jichi Medical University, Shimotsuke, Japan.
2.2. HBP measurements
The patients measured their own BP at home using an automatic ICT‐based device (HEM‐7252G‐HP; Omron Healthcare) based on the cuff‐oscillometric principle. This device also recorded the time that the wearer's BP was measured. All data obtained by the device were transmitted automatically to a cloud‐based remote monitoring system, the Medical LINK software program provided by Omron Healthcare,15 and the data were managed in an independent facility, the Jichi Medical University Center of Global Home and Ambulatory BP Analysis at the Jichi Medical University Center of Excellence Community Medicine Cardiovascular Research and Development, Shimotsuke, Japan.
The patients were instructed to measure their HBP in a sitting position after resting for 1 to 2 minutes with their legs not crossed in a quiet room that was not too cold. The cuff used was 14.5‐cm wide and 46.6‐cm long (target arm girth: 22–32 cm). This cuff size could cover a width of ≥40% of the brachial girth and a length ≥80% of the brachial girth in all study patients. The arm cuff position was maintained at the heart level. They measured their HBP for 14 consecutive days, and the HBP monitoring protocol was as follows: two measurements in the morning, two measurements before dinner, and two measurements at bedtime, for a total of six measurements per day. All of the patients’ HBP values obtained over the 14 consecutive days were evaluated. The patients measured their morning BP within 1 hour after waking, after urination, before breakfast, and before ingesting medications. The before‐dinner BP was measured within 60 minutes before dinner. The at‐bedtime BP was measured just before the patient went to bed.
We divided the 14 consecutive days into two periods: the first 7 consecutive days (days 1–7) and the second 7 consecutive days (days 8–14). We calculated the average BP and heart rate in each of the two periods, and the expected total number of HBP measurements at each of the two periods was as follows: 14 measurements in the morning, 14 measurements before dinner, and 14 measurements at bedtime (2 measurements × 7 days per 1 patient), respectively. We compared the HBP reliability of the morning, before‐dinner, and at‐bedtime HBP measurements.
2.3. Daily information
The patients were asked to make a daily record of several types of information in a notebook that we provided. Namely, they were asked to record the times when they woke, bathed, and went to bed; whether they had consumed any alcoholic beverages during their dinner; and whether they had smoked a tobacco product (cigarettes or cigars). The information about the amount of alcohol consumed on a given day was classified in terms of ethanol 20 to 30 mL in men and 10 to 20 mL in women (equivalent to 180 mL of sake, 500 mL of beer, <70 mL of shochu, a double whisky or brandy, or 2 glasses of wine per day) as described in the Japanese Society of Hypertension 2014 guideline.8 The details of this information were provided in the notebook, and the patients were instructed to check one of the following regarding their alcohol consumption: none, appropriate, or over. We defined a regular drinker as a person who drank over the appropriate dose three times a week or more. We designed the notebook to make it easy for patients to provide detailed information, and the patients brought their notebooks to each clinic visit.
2.4. Statistical analysis
The data are presented as mean ± standard deviation (SD) unless stated otherwise. The distribution of data was determined by Kolmogorov‐Smirnov test. We evaluated the differences in HBP values and heart rate using paired t test. The reliability of each HBP measurement was separated into relative and absolute reliabilities.
To investigate relative reliability, we used the Pearson correlation coefficient and the intraclass correlation coefficient (ICC) for agreement.16 The extent of the correlation was tested using z statistics. We calculated the ICCs by using the one‐way random model of absolute agreement, ie, the ICC (1,1). The ICCs were scored as described17: 0 = poor agreement, 0 to 0.20 = minor agreement, 0.21 to 0.40 = fair agreement, 0.41 to 0.60 = moderate agreement; 0.61 to 0.80 = major agreement, and 0.81 to 1.00 = almost perfect agreement.
To investigate absolute reliability, we conducted a Bland‐Altman analysis.18 With the Bland‐Altman method, the differences between the pairs of HBP measurements (ie, the HBP values of days 1–7 minus those of days 8–14) on the vertical axis were plotted against the mean of each pair ([the HBP values of days 1–7 plus those of days 8–14]/2) on the horizontal axis,18 along with an estimation of the upper and lower limits of agreement, being two times the SD. The standard error of measurement (SEM) represents the variation among individuals.19 The SEM was calculated as SDd/√2,20, 21 where SDd is the SD of the (the mean difference between the HBP values of days 1–7 and those of days 8–14). The smaller the SEM, the greater the reliability of the measurement.19
In the Bland‐Altman analysis, we investigated whether there was a systemic bias, including either a fixed bias or a proportional bias. We assessed the fixed bias by calculating the 95% confidence interval of the . The 95% confidence interval of the was calculated as ± tn−1 × √(SDd)2/n, where tn−1 corresponds to the value of t distribution with n−1 degrees of freedom, and n corresponds to the number of patients.22 If the 95% confidence interval of the did not include zero, the presence of fixed bias would be confirmed. We assessed the proportional bias by determining the linear regression between the averages and the differences of HBP values.
The 95% limits of agreement (LOA) were calculated when a systemic bias (fixed bias and/or proportional bias) was observed.23 The LOA measures the magnitude of the variability of the difference between HBP values of individuals at different HBP measurement sessions. The LOA was calculated as ( ± 1.96 × SDd) ± tn−1 × SELOA, SELOA = √3 × (SDd)2/n.23 This information is extremely helpful in determining how much one would expect the HBP value for a patient to vary by chance between days 1 to 7 and days 8 to 14 of HBP measurement.18 In the present study, the most optimistic range, ie (−1.96 × SDd) + tn−1 × SELOA to ( + 1.96 × SDd) − tn−1 × SELOA, was adopted as the coefficient limit of LOA.23
If a systemic bias was denied by Bland‐Altman analysis, then what was initially considered an error that degrades the reliability of HBP measurement would in fact be only a random error. The minimal detectable change (MDC) at the 95% confidence level was calculated only when random errors were observed. The MDC was calculated as SEM × 1.96 × √224 and represents the smallest change in BP level; this could be interpreted as indicating that the changes in values within the MDC were caused by measurement errors, while changes larger than the MDC were judged as “true changes” with a risk rate of 5%.25
We calculated the repeatability coefficients for each of the three measurement times. The repeatability coefficients were also expressed as a percentage of nearly maximum variation, ie, the interval encompassing four times the SD of the averaged duplicated measurements.26, 27
We conducted a sensitivity analysis excluding regular drinkers, since alcohol consumption might affect HBP measurement, especially in the case of at‐bedtime values.
All statistical analyses were performed using SPSS version 24.0 software (IBM). A P value < .05 was considered significant.
3. RESULTS
3.1. The patients’ characteristics
The ages of the 48 patients (20 men and 28 women) ranged from 50 to 89 years (mean ± SD, 76.4 ± 7.8 years). Table 1 summarizes the patients’ characteristics and their daily schedules, including the times of HBP measurements. The percentage of regular consumers of alcohol was 18.8%.
Table 1.
Characteristics of the study patients with hypertension (n = 48)
| Characteristics |
Mean ± SD or % |
|---|---|
| Age, y | 76.4 ± 7.8 |
| Men:women | 20:28 |
| Body mass index, kg/m2 | 24.7 ± 4.2 |
| Regular drinkers | 18.8 |
| Current smokers | 2.1 |
| Dyslipidemia | 55.7 |
| Diabetes mellitus | 22.2 |
| eGFR, mL/min per 1.73 m2 | 66.4 ± 13.2 |
| Hyperuricemia | 6.2 |
| History of cardiovascular disease | 6.8 |
| Antihypertensive medications | |
| No. of antihypertensive drugs | 2.0 ± 1.0 |
| CCB | 78.2 |
| ACEI | 2.6 |
| ARB | 73.9 |
| β‐Blocker | 6.6 |
| α‐Blocker | 8.6 |
| Diuretics | 19.6 |
| Timing of antihypertensive medications | |
| After breakfast | 79.2 |
| After dinner | 29.2 |
| Daily schedules | |
| Wake up, h:min | 06:14 ± 00:39 |
| BP measurement in the morning, h:min | 06:40 ± 01:00 |
| BP measurement before dinner, h:min | 17:34 ± 01:07 |
| Bathing, h:min | 19:56 ± 01:43 |
| BP measurement at bedtime, h:min | 21:06 ± 01:32 |
| Bedtime, h:min | 21:40 ± 01:29 |
| No. of BP measurements | |
| Morning, days 1 to 7 | 12.8 ± 1.7 |
| Morning, days 8 to 14 | 14.9 ± 2.8 |
| Before dinner, days 1 to 7 | 13.0 ± 2.7 |
| Before dinner, days 8 to 14 | 14.4 ± 3.6 |
| At bedtime, days 1 to 7 | 13.6 ± 2.0 |
| At bedtime, days 8 to 14 | 14.4 ± 3.2 |
ACEI, angiotensin‐converting enzyme inhibitor; ARB, angiotensin II receptor blocker; BP, blood pressure; CCB, calcium channel blocker; eGFR, estimated glomerular filtration rate; SD, standard deviation.
3.2. HBP measurements
The number of BP measurements for the morning, before‐dinner, and at‐bedtime measurements at the two 7‐day periods are shown in Table 1. The patients’ compliance with the HBP measurement regimen was good. Among the 48 patients, the BP values before dinner were missing for one patient, and multiple BP values at bedtime were missing for three patients. We excluded the data of these four patients from related analysis.
Table 2 shows the BP levels at each of the three measurement times over the two 7‐day periods. The morning systolic BP (SBP), the morning diastolic BP (DBP), and the before‐dinner SBP were significantly higher on days 1 to 7 compared with those from day 8 to 14. However, these differences in clinical practice are usually small.
Table 2.
BP levels at three measurement times for each 7‐day period: BP difference between periods
| Variables | Days 1 to 7 | Days 8 to 14 | Difference | P value |
|---|---|---|---|---|
| Morning SBP, mm Hg (n = 48) | 131.9 ± 12.5 | 130.2 ± 11.4 | 1.7 ± 4.3 | .008 |
| Morning DBP, mm Hg (n = 48) | 77.0 ± 7.7 | 76.0 ± 8.1 | 1.0 ± 2.9 | .017 |
| Morning HR, beats per min (n = 48) | 64.5 ± 10.0 | 64.3 ± 10.1 | 0.2 ± 3.9 | .850 |
| Before‐dinner SBP, mm Hg (n = 47) | 130.6 ± 14.3 | 128.1 ± 14.6 | 2.5 ± 7.6 | .028 |
| Before‐dinner DBP, mm Hg (n = 47) | 76.4 ± 9.5 | 75.6 ± 9.9 | 0.8 ± 4.2 | .206 |
| Before‐dinner HR, beats per min (n = 47) | 69.0 ± 10.2 | 69.8 ± 9.2 | −0.8 ± 3.4 | .106 |
| At‐bedtime SBP, mm Hg (n = 45) | 121.1 ± 13.3 | 120.1 ± 12.4 | 1.0 ± 7.0 | .341 |
| At‐bedtime DBP, mm Hg (n = 45) | 70.6 ± 8.3 | 70.3 ± 8.9 | 0.3 ± 3.8 | .641 |
| At‐bedtime HR, beats per min (n = 45) | 68.4 ± 9.4 | 68.8 ± 8.8 | −0.4 ± 3.4 | .491 |
BP, blood pressure; DBP, diastolic blood pressure; HR, heart rate; SBP, systolic blood pressure.
Values are expressed as mean ± standard deviation.
3.3. Reliability of HBP measurement—relative reliability analysis
Figure 1 illustrates the correlation between HBP values taken on days 1 to 7 and those from days 8 to 14. For each of the three measurement times (morning, at dinner, and before bedtime), there was a strong correlation between the HBP values of days 1 to 7 and those of days 8 to 14. The scatterplot points for the morning BP were closely distributed compared with those for the other two measurement times.
Figure 1.
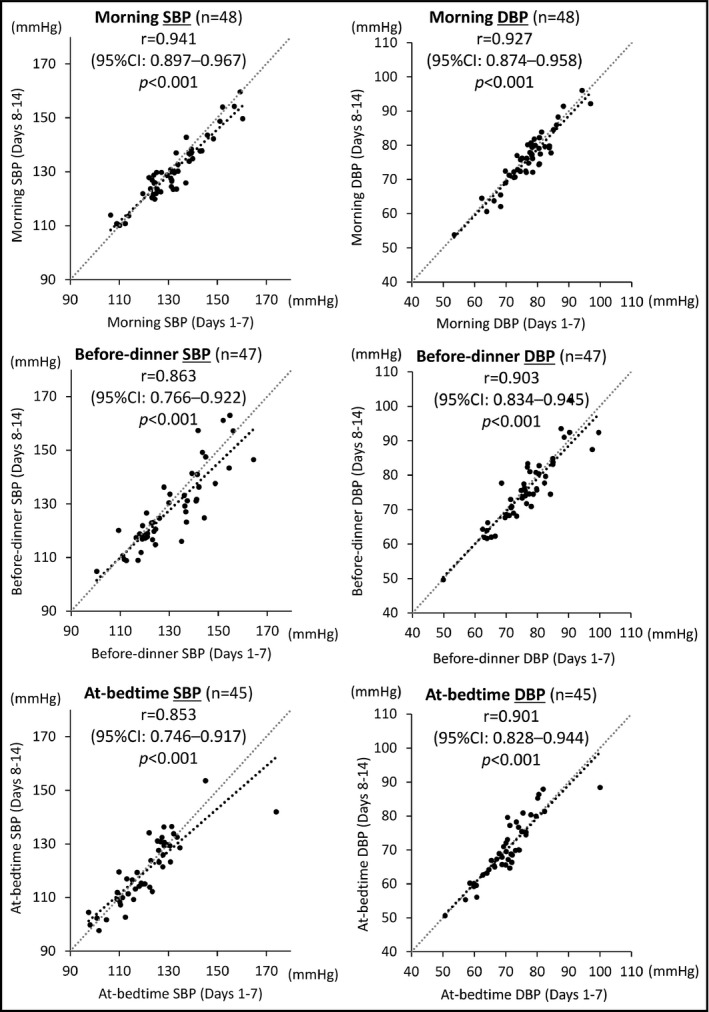
Correlation analysis of home blood pressure (HBP) values recorded during days 1 to 7 and those from days 8 to 14 in the morning, before dinner, and at bedtime. CI indicates confidence interval; DBP; diastolic blood pressure; r, Pearson correlation coefficient; SBP, systolic blood pressure
For the z statistics, the extent of the correlation for the morning SBP was significantly stronger compared with that for the before‐dinner SBP (P = .037) or that for the at‐bedtime SBP (P = .025). There was no significant difference in the extent of correlation between the before‐dinner SBP and at‐bedtime SBP (P = .860). Concerning DBP, there were no significant differences in the extent of correlation among the three HBP measurement times: morning DBP vs before‐dinner DBP, P = .484; morning DBP vs at‐bedtime SBP, P = .458; before‐dinner DBP vs at‐bedtime DBP, P = .960.
Table 3 shows the ICCs (1,1) for the HBP values at each measurement time. For all three measurement times, there was almost perfect agreement between the HBP values of days 1 to 7 and those of days 8 to 14. The morning BP agreed most closely compared with the other two BP measurement times.
Table 3.
Reliability of home BP measurement in each period
| Variable (days 1 to 7 vs days 8 to 14) | No. | ICC (1,1) | Bland‐Altman analysis | ||||||||
|---|---|---|---|---|---|---|---|---|---|---|---|
| Intraclass correlation | 95% CI | Fixed bias | Proportional bias | LOA, mm Hg | Random error | Repeatability coefficient | Percentage of near‐maximal variability | ||||
| 95% CI | Bias | Slopea (P value) | Bias | MDC, mm Hg | |||||||
| Systolic BP | |||||||||||
| Morning | 48 | 0.928 | 0.875–0.959 | 0.470–2.944 | Yes | 0.273 (.061) | No | −4.5 to 12.2 | – | 8.5 | 18.1 |
| Before dinner | 47 | 0.851 | 0.749–0.914 | 0.287–4.729 | Yes | −0.038 (.798) | No | −8.5 to 21.2 | – | 15.1 | 27.2 |
| At bedtime | 45 | 0.852 | 0.747–0.915 | −1.102 to 3.117 | No | 0.127 (.406) | No | – | 13.8 | 14.0 | 28.3 |
| Diastolic BP | |||||||||||
| Morning BP | 48 | 0.927 | 0.874–0.958 | 0.193–1.863 | Exist | −0.111 (.451) | No | −3.2 to 8.1 | – | 5.8 | 18.5 |
| Before dinner | 47 | 0.903 | 0.834–0.945 | −0.437 to 2.027 | No | −0.111 (.460) | No | – | 8.3 | 8.5 | 22.4 |
| At bedtime | 45 | 0.901 | 0.828–0.944 | −0.847 to 1.385 | No | −0.160 (.293) | No | – | 7.5 | 7.7 | 23.0 |
BP, blood pressure; CI, confidence interval; ICC, intraclass correlation coefficient; LOA, limits of agreement; MDC, minimal detectable change.
Slope of regression line.
3.4. Reliability of HBP measurement—absolute reliability analysis
Figure 2 is the Bland‐Altman plot of the reliability of HBP measurement for the three measurement times. Compared with the before‐dinner and at‐bedtime BP measurement times, the SEM of the difference between the BP values of days 1 to 7 and those of days 8 to 14 in the morning BP was the smallest, which means that morning BP measurement showed the greatest reliability.
Figure 2.
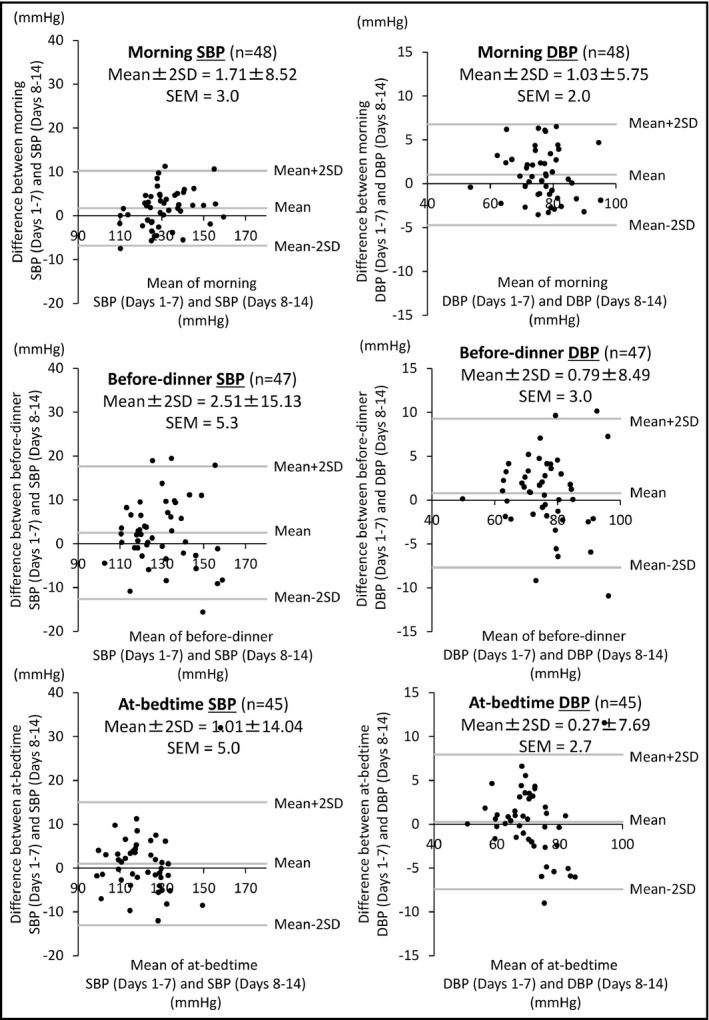
Bland‐Altman analysis comparing the home blood pressure (HBP) values from days 1 to 7 and those from days 8 to 14 in the morning, before dinner, and at bedtime. DBP; diastolic blood pressure; SBP, systolic blood pressure; SD,standard deviation; SEM, standard error of measurement
The results of another Bland‐Altman analysis are summarized in Table 3. In the morning SBP measurement, a fixed bias was found: the SBP values of days 1 to 7 were higher, and the average 95% LOA was 3.9 mm Hg (Figure S1). Fixed bias was also revealed for the before‐dinner SBP measurement: days 1 to 7 SBP values were higher, and the average 95% LOA was 6.4 mm Hg (Figure S1). For the at‐bedtime SBP measurement, only random error was found, and the MDC was 13.8 mm Hg.
Concerning DBP, fixed bias was found in the morning DBP measurement: the DBP values of days 1 to 7 were higher, and the average 95% LOA was 2.5 mm Hg (Figure S1). For the before‐dinner and at‐bedtime DBP measurements, random errors were found, and the MDCs were 8.3 and 7.5 mm Hg, respectively.
To assess the agreement between the HBP values on days 1 to 7 and those on days 8 to 14, we used Bland‐Altman repeatability coefficients corrected for near‐maximal variability. The results showed that SBP and DBP measured in the morning had smaller BP variabilities compared with those measured at the other two BP measurement times (Table 3).
3.5. Sensitivity analysis
In sensitivity analyses of the reliability of morning, before‐dinner, and at‐bedtime BP measurements excluding regular drinkers (Table S1), the results were similar to the main results, ie, the correlation for morning BP was still stronger than the correlations for before‐dinner BP or at‐bedtime BP (Figure S2). The ICCs (1,1) of morning BP were larger than those for the other two BP measurement times (Table S2), and the SEM of the difference between the BP values of days 1 to 7 and those of days 8 to 14 was smaller for morning BP than for the other two measures (Figure S3).
Fixed biases were found in morning SBP, before‐dinner SBP, and before‐dinner DBP measurement: the BP values of days 1 to 7 were higher, and the average 95% LOAs are shown in Figure S4. Random errors were found in morning DBP, at‐bedtime SBP, and at‐bedtime DBP measurements, and their MDCs are shown in Table S2.
4. DISCUSSION
The two main findings of this study are as follows. First, for relative reliability, the extent of the correlation between the HBP values of days 1 to 7 and those of days 8 to 14 in the morning BP was the strongest compared with those of before‐dinner and at‐bedtime BP. The ICCs (1,1) agreement between the HBP values of days 1 to 7 and those of days 8 to 14 for morning BP were the closest compared with those for before‐dinner and at‐bedtime BP. Second, for absolute reliability, the SEM in the Bland‐Altman analysis of the morning BP values were the least compared with the other HBP measurement times. In Bland‐Altman repeatability coefficients corrected for near‐maximal variability, the morning BP showed the smallest BP variabilities compared with those measured at other HBP measurement times. Together, these main findings indicate that the reliability of morning BP measurement was higher than that of before‐dinner or at‐bedtime BP measurement. This is the first study to assess the reliability of HBP separately for morning, before‐dinner, and at‐bedtime BP measurement time points using an automatic ICT‐based device in a hypertensive population in general practice.
In the present study, the average level of HBP (both SBP and DBP) changed very little over the consecutive 14 days (all changes were <3 mm Hg; Table 2), which meant that there was high reliability/reproducibility in HBP measurement. In a previous study, James and colleagues28 investigated the reproducibility of HBP while comparing two different periods of averaged HBP, each measured for 6 consecutive days, in patients with hypertension. The mean differences between the first and second periods in SBP and DBP were 3 and 1 mm Hg, respectively. Sakuma and colleagues29 also assessed the reproducibility of HBP in the morning in each of two 4‐week periods separated by 1 year in untreated patients. The mean differences between the first and second HBP values were small (SBP, 0.8 ± 7.7 mm Hg; DBP, 0.9 ± 5.5 mm Hg) and the correlations between them were high (SBP, r = .844; DBP, r = .830). We cannot compare these results directly with those of the present study because of the many differences, including those in the evaluation periods, the presence or absence of antihypertensive medications, and the device of HBP measurement; however, these results were almost identical to the results of the present study. Our present findings confirmed the high reliability/reproducibility of HBP measurements.
In the Bland‐Altman analysis investigating the absolute reliability, we observed fixed biases in morning SBP and before‐dinner SBP, suggesting that there are average decreases of 3.9 and 6.4 mm Hg in days 8 to 14 compared with days 1 to 7, respectively (Figure S1A and S1B). This decrease after a number of BP measurements might indicate the regression to the mean,30 which is a statistical phenomenon. Therefore, the measurements taken during days 8 to 14 would be more appropriate values than those of days 1 to 7. Based on the LOA, the SBP values of days 8 to 14 measured in the morning and before dinner varied from an increase of 4.5 mm Hg and 8.5 mm Hg to a decrease of 12.2 mm Hg and 21.2 mm Hg from those of days 1 to 7, respectively (Figure S1A and S1B). These results indicate that it might be possible to have great differences between the SBP values of days 1 to 7 and those of days 8 to 14 in both morning SBP and before‐dinner SBP, and that these differences are the threshold for chance variation. These results indicate that the change of these BP ranges should be tolerated in clinical practice. In the at‐bedtime BP measurements, only a random error of 13.8 mm Hg was observed. It is necessary to consider the possibility that there will be an error of 13.8 mm Hg in patients’ at‐bedtime BP measurements if the measurements are performed for 14 days and their values are assessed by dividing this period into two periods of 7 days each. We could not directly compare the results of the three SBP measurement times, as fixed bias existed in the morning and before‐dinner SBP measurements. However, comparing the absolute LOA and MDC levels among the measurement times, it is apparent that the error of the morning SBP measurements was the least.
The present study demonstrated that morning BP measurement would provide not only a higher relative reliability but also a greater absolute reliability compared with before‐dinner and at‐bedtime BP measurements. The higher reliability of morning BP measurement remained unchanged even when regular drinkers were excluded. These results indicate that morning BP is the most reliable of the daytime BP measurements. Hoshide and colleagues31 reported that morning home SBP provided superior discrimination and risk reclassification for stroke events compared with at‐bedtime SBP, and that the predictive ability of morning SBP was attenuated by the simultaneous assessments of morning and at‐bedtime SBP in the J‐HOP (Japan Morning Surge‐Home Blood Pressure) study. In addition, the association of morning SBP with stroke risk was independent of organ damage markers, which indicated that higher morning SBP was causally related to stroke occurrence.31 Our present findings may support their results in light of the higher reliability of morning BP measurement. The high reliability of morning BP measurement may lead to a more accurate assessment of stroke risks. Therefore, we emphasize that the management of hypertension should be based on morning BP levels in routine clinical practice.
Evening BP, especially at‐bedtime BP, may be affected by the depressor effects of bathing and alcohol consumption.9 The postprandial BP decrease32 and various lifestyle factors such as evening activities10 might also affect the evening BP levels. These various factors might lead to a reduction of the reliability of before‐dinner and at‐bedtime BP measurement.
We recently developed an ICT‐based device for measuring HBP, including nocturnal HBP.33, 34, 35 This is the first study to assess the reliability of HBP using our automatic ICT‐based device. Our results confirmed that the ICT‐based approach was successful in providing reliable HBP data. The number of HBP measurements, which were transmitted automatically to the data server, was almost identical to the expected total number of HBP measurements, and the BP values directly transmitted from the patients’ homes were quite accurate. In addition, the ICT‐based HBP monitoring device was successfully used by elderly patients with hypertension who had no prior experience with the device, suggesting that the device had high practicability. In their randomized controlled trial, Bachmann and colleagues36 reported that the accuracy and interpretation of HBP measurement using devices with a memory function were significantly higher than those using only a self‐reported logbook. Thus, we propose that the ICT‐based HBP monitoring device is the most appropriate device currently available for the management of hypertension.
4.1. Study strengths and limitations
The strength of this study is that the BP levels and their times of measurement were quite accurate and were not subjected to any selection or reporting bias, since all of the data obtained by the ICT‐based HBP monitoring device were evaluated, without selecting any BP values for elimination.
Our study's limitations are as follows. First, the number of patients (n = 48) was small, and most of the patients were elderly (age range, 50–89 years). It is unclear whether the results in this study could be extrapolated to younger patients with hypertension. Second, the average HBP values on days 1 to 7 and those on days 8 to 14 were different. Any one of a number of factors could have contributed to this difference in results, including the emotional status of patients,37 the content of meals,38 hemodynamics caused by water balances,39 and adherence to antihypertensive medication.40 Third, we did not take into account the opportunity for alcohol consumption after dinner and before bedtime. These lifestyle factors might have affected the reliability of HBP measured at bedtime. Fourth, we assessed the short‐term reliability of HBP measurements, and our findings may not be applicable to long‐term HBP reliability. Finally, we did not assess the effectiveness of HBP management using only morning, only evening, or morning plus evening measurements in terms of cardiovascular outcomes.
5. CONCLUSIONS
The reliability of morning BP measurement was higher than that of before‐dinner or at‐bedtime BP measurement in patients with hypertension. We emphasize that the management of hypertension should be based on morning BP levels in routine clinical practice, since the high reliability of morning BP measurement would be expected to yield a more accurate assessment of cardiovascular risks. Further studies are needed to investigate the effectiveness of HBP management based on only morning, only evening, or morning plus evening measurements in terms of cardiovascular outcomes.
CONFLICTS OF INTEREST
The authors have no potential conflicts of interest to declare.
Supporting information
Fujiwara T, Hoshide S, Kanegae H, Nishizawa M, Kario K. Reliability of morning, before‐dinner, and at‐bedtime home blood pressure measurements in patients with hypertension. J Clin Hypertens. 2018;20:315–323. 10.1111/jch.13165
REFERENCES
- 1. Jula A, Puukka P, Karanko H. Multiple clinic and home blood pressure measurements versus ambulatory blood pressure monitoring. Hypertension. 1999;34:261‐266. [DOI] [PubMed] [Google Scholar]
- 2. Ohkubo T, Imai Y, Tsuji I, et al. Home blood pressure measurement has a stronger predictive power for mortality than does screening blood pressure measurement: a population‐based observation in Ohasama, Japan. J Hypertens. 1998;16:971‐975. [DOI] [PubMed] [Google Scholar]
- 3. Sega R, Facchetti R, Bombelli M, et al. Prognostic value of ambulatory and home blood pressures compared with office blood pressure in the general population: follow‐up results from the Pressioni Arteriose Monitorate e Loro Associazioni (PAMELA) study. Circulation. 2005;111:1777‐1783. [DOI] [PubMed] [Google Scholar]
- 4. Pickering TG, Miller NH, Ogedegbe G, et al. Call to action on use and reimbursement for home blood pressure monitoring: a joint scientific statement from the American Heart Association, American Society of Hypertension, and Preventive Cardiovascular Nurses Association. Hypertension. 2008;52:10‐29. [DOI] [PMC free article] [PubMed] [Google Scholar]
- 5. Parati G, Stergiou GS, Asmar R, et al. European Society of Hypertension practice guidelines for home blood pressure monitoring. J Hum Hypertens. 2010;24:779‐785. [DOI] [PubMed] [Google Scholar]
- 6. Williams B, Williams H, Northedge J, et al. Hypertension: the clinical management of primary hypertension in adults. Update of clinical guidelines 18 and 34. NICE clinical guideline No. 127 2011. (http://guidance.nice.org.uk/CG127). Accessed June 22, 2017.
- 7. Mancia G, Fagard R, Narkiewicz K, et al. 2013 ESH/ESC guidelines for the management of arterial hypertension. J Hypertens. 2013;31:1281‐1357. [DOI] [PubMed] [Google Scholar]
- 8. Shimamoto K, Ando K, Fujita T, et al. The Japanese Society of Hypertension Guidelines for the Management of Hypertension (JSH 2014). Hypertens Res. 2014;37:253‐390. [DOI] [PubMed] [Google Scholar]
- 9. Fujiwara T, Hoshide S, Nishizawa M, Matsuo T, Kario K. Difference in evening home blood pressure between before dinner and at bedtime in Japanese elderly hypertensive patients. J Clin Hypertens (Greenwich). 2017;19:731‐739. [DOI] [PMC free article] [PubMed] [Google Scholar]
- 10. Imai Y, Obara T, Asayama K, Ohkubo T. The reason why home blood pressure measurements are preferred over clinic or ambulatory blood pressure in Japan. Hypertens Res. 2013;36:661‐672. [DOI] [PubMed] [Google Scholar]
- 11. Scisney‐Matlock M, Grand A, Steigerwalt SP, Normolle D. Reliability and reproducibility of clinic and home blood pressure measurements in hypertensive women according to age and ethnicity. Blood Press Monit. 2009;14:49‐57. [DOI] [PubMed] [Google Scholar]
- 12. Fotherby MD, Potter JF. Reproducibility of ambulatory and clinic blood pressure measurements in elderly hypertensive subjects. J Hypertens. 1993;11:573‐579. [DOI] [PubMed] [Google Scholar]
- 13. Mansoor GA, McCabe EJ, White WB. Long‐term reproducibility of ambulatory blood pressure. J Hypertens. 1994;12:703‐708. [PubMed] [Google Scholar]
- 14. Eguchi K, Hoshide S, Hoshide Y, Ishikawa S, Shimada K, Kario K. Reproducibility of ambulatory blood pressure in treated and untreated hypertensive patients. J Hypertens. 2010;28:918‐924. [DOI] [PubMed] [Google Scholar]
- 15. Takahashi H, Yoshika M, Yokoi T. Validation of two automatic devices: Omron HEM‐7252G‐HP and Omron HEM‐7251G for self‐measurement of blood pressure according to the European Society of Hypertension International Protocol revision 2010. Blood Press Monit. 2015;20:286‐290. [DOI] [PubMed] [Google Scholar]
- 16. Shrout PE, Fleiss JL. Intraclass correlations: uses in assessing rater reliability. Psychol Bull. 1979;86:420‐428. [DOI] [PubMed] [Google Scholar]
- 17. Landis JR, Koch GG. The measurement of observer agreement for categorical data. Biometrics. 1977;33:159‐174. [PubMed] [Google Scholar]
- 18. Bland JM, Altman DG. Measuring agreement in method comparison studies. Stat Methods Med Res. 1999;8:135‐160. [DOI] [PubMed] [Google Scholar]
- 19. Atkinson G, Nevill AM. Statistical methods for assessing measurement error (reliability) in variables relevant to sports medicine. Sports Med. 1998;26:217‐238. [DOI] [PubMed] [Google Scholar]
- 20. de Vet HC, Terwee CB, Knol DL, Bouter LM. When to use agreement versus reliability measures. J Clin Epidemiol. 2006;59:1033‐1039. [DOI] [PubMed] [Google Scholar]
- 21. Haley SM, Fragala‐Pinkham MA. Interpreting change scores of tests and measures used in physical therapy. Phys Ther. 2006;86:735‐743. [PubMed] [Google Scholar]
- 22. Balaguier R, Madeleine P, Vuillerm N. Intra‐session absolute and relative reliability of pressure pain thresholds in the low back region of vine‐workers: effect of the number of trials. BMC Musculoskelet Disord. 2016;17:350. [DOI] [PMC free article] [PubMed] [Google Scholar]
- 23. Bland JM, Altman DG. Statistical methods for assessing agreement between two methods of clinicalmeasurement. Lancet. 1986;1:307‐310. [PubMed] [Google Scholar]
- 24. Terwee CB, Bot SD, de Boer MR, et al. Quality criteria were proposed for measurement properties of health status questionnaires. J Clin Epidemiol. 2007;60:34‐42. [DOI] [PubMed] [Google Scholar]
- 25. Faber MJ, Bosscher RJ, van Wieringen PC. Clinimetric properties of the performance‐oriented morbidity assessment. Phys Ther. 2006;86:944‐954. [PubMed] [Google Scholar]
- 26. Staessen JA, Fagard R, Thijs L, Amery A. A consensus view of the technique of ambulatory blood pressure monitoring. The Fourth International Consensus Conference on 24‐Hour Ambulatory Blood Pressure Monitoring. Hypertension 1995;26:912‐918. [DOI] [PubMed] [Google Scholar]
- 27. Muxfeldt ES, Fiszman R, de Souza F, Viegas B, Oliveira FC, Salles GF. Appropriate time interval to repeat ambulatory blood pressure monitoring in patients with white‐coat resistant hypertension. Hypertension. 2012;59:384‐389. [DOI] [PubMed] [Google Scholar]
- 28. James GD, Pickering TG, Yee LS, Harshfield GA, Riva S, Laragh JH. The reproducibility of average ambulatory, home and clinic pressures. Hypertension. 1998;11:545‐549. [DOI] [PubMed] [Google Scholar]
- 29. Sakuma M, Imai Y, Nagai K, et al. Reproducibility of home blood pressure measurements over a 1‐year period. Am J Hypertens. 1997;10:798‐803. [DOI] [PubMed] [Google Scholar]
- 30. Shepard DS, Finison LJ. Blood pressure reductions: correcting for regression to the mean. Prev Med. 1983;12:304‐317. [DOI] [PubMed] [Google Scholar]
- 31. Hoshide S, Yano Y, Haimoto H, et al. Morning and evening home blood pressure and risks of incident stroke and coronary artery disease in the Japanese general practice population: The Japan Morning Surge‐Home Blood Pressure Study. Hypertension. 2016;68:54‐61. [DOI] [PubMed] [Google Scholar]
- 32. Lipsitz LA, Ryan SM, Parker JA, Freeman R, Wei JY, Goldberger AL. Hemodynamic and autonomic nervous system responses to mixed meal ingestion in healthy young and old subjects and dysautonomic patients with postprandial hypotension. Circulation. 1993;87:391‐400. [DOI] [PubMed] [Google Scholar]
- 33. Kario K. Evidence and perspectives on the 24‐hour management of hypertension: hemodynamic biomarker‐initiated ‘anticipation medicine’ for zero cardiovascular event. Prog Cardiovasc Dis. 2016;59:262‐281. [DOI] [PubMed] [Google Scholar]
- 34. Kario K. Perfect 24‐h management of hypertension: clinical relevance and perspectives. J Hum Hypertens. 2017;31:231‐243. [DOI] [PubMed] [Google Scholar]
- 35. Kario K, Tomitani N, Kanegae H, et al. Comparative effects of an angiotensin II receptor blocker (ARB)/diuretic vs. ARB/calcium‐channel blocker combination on uncontrolled nocturnal hypertension evaluated by information and communication technology‐based nocturnal home blood pressure monitoring––the NOCTURNE study. Circ J. 2017;81:948‐957. [DOI] [PubMed] [Google Scholar]
- 36. Bachmann LM, Steurer J, Holm D, Vetter W. To what extent can we trust home blood pressure measurement? A randomized, controlled trial. J Clin Hypertens (Greenwich). 2002;4:405‐407, 412. [DOI] [PMC free article] [PubMed] [Google Scholar]
- 37. Trivedi RB, Ayotte B, Edelman D, Bosworth HB. The association of emotional well‐being and marital status with treatment adherence among patients with hypertension. J Behav Med. 2008;31:489‐497. [DOI] [PMC free article] [PubMed] [Google Scholar]
- 38. Neaton JD, Grimm RH Jr, Prineas RJ, et al. Treatment of mild hypertension study. Final results. Treatment of mild hypertension study research group. JAMA. 1993;270:713‐724. [PubMed] [Google Scholar]
- 39. Laffer CL, Scott RC 3rd, Titze JM, Luft FC, Elijovich F. Hemodynamic and salt‐and‐water balance link sodium storage and vascular dysfunction in salt‐sensitive subjects. Hypertension. 2016;68:195‐203. [DOI] [PMC free article] [PubMed] [Google Scholar]
- 40. Hamdidouche I, Jullien V, Boutouyrie P, Billaud E, Azizi M, Laurent S. Drug adherence in hypertension: from methodological issues to cardiovascular outcomes. J Hypertens. 2017;35:1133‐1144. [DOI] [PubMed] [Google Scholar]
Associated Data
This section collects any data citations, data availability statements, or supplementary materials included in this article.
Supplementary Materials