

Abstract
Numerous studies have observed a relationship between obstructive sleep apnea and hypertension, but the effects of metabolic syndrome on hypertension, and their interaction with obstructive sleep apnea, remain unclear. For this study, a total of 2972 patients were recruited from the Shanghai Sleep Health Study. Data from overnight polysomnography parameters, serum lipids, fasting blood glucose, blood pressure, and anthropometric measurements were collected. The authors then explored the independent associations and multiplicative and additive interactions of predictors of metabolic syndrome with hypertension. A positive dose–response relationship was observed between systolic blood pressure and diastolic blood pressure and quartiles of fasting glucose, triglyceride, low‐density lipoprotein cholesterol, body mass index, and apnea–hypopnea index. Furthermore, logistic regression analysis showed that, in men, a high triglyceride level, hyperglycemia, and overweight status (and their interaction effect on obstructive sleep apnea) were associated with hypertension. Being overweight and hyperglycemic may markedly augment the adverse effect of obstructive sleep apnea on hypertension in men. Therefore, hypertension therapy should be individualized based on the specific comorbidities of each patient.
Keywords: hypertension, interaction, metabolic syndrome, obstructive sleep apnea, sex difference
1. INTRODUCTION
Obstructive sleep apnea (OSA) is a common sleep disorder that affects approximately 2% to 4% of middle‐aged adults and is characterized by recurrent episodes of upper airway collapse during sleep, leading to chronic intermittent hypoxia and sleep fragmentation.1 Among all patients with OSA, 50% also have hypertension.2
Hypertension has a strong relationship with OSA.3 Hypertension induced by OSA occurs via chronic intermittent hypoxia in accordance with certain pathological mechanisms, such as overactivation of the sympathetic nervous system, endothelial dysfunction, and renin–angiotensin–aldosterone system dysfunction, ultimately increasing the risk of cardiovascular morbidity and mortality.4, 5, 6, 7 However, it remains unclear whether metabolic syndrome (MS) plays a role in the well‐established mechanisms that accelerate the detrimental effects of OSA on hypertension.8, 9 In addition, while continuous positive airway pressure (CPAP) is the gold standard therapy for OSA, its effect on blood pressure (BP) varies, most likely as a result of the multifactorial nature of hypertension (which involves metabolic factors such as weight status).10 Previous studies on the effects of CPAP on MS in patients with OSA have yielded conflicting results. Combining an intervention with weight loss seems to result in an incremental reduction in metabolism compared with either CPAP or weight loss alone.11
OSA, metabolic disorder, and hypertension develop in a very complex manner, and pathological development is influenced by many potential confounding factors and their interactions in long‐term disease processes.12 To identify the relationship between sex and cardiovascular disease (CVD), it is important to first define distinctive patterns of hypertension, OSA, and metabolism in each sex.13 Thus, exploring the joint interaction effects of OSA severity and MS on hypertension may increase our understanding of the pathophysiology of the disorder and yield more effective treatment strategies in OSA populations.
2. MATERIALS AND METHODS
2.1. Study population
This large‐scale cross‐sectional study (retrospective chart review) was based on the Shanghai Sleep Health Study cohort. This cohort consisted of 3582 consecutive participants who were referred to the sleep laboratory at the Shanghai Jiao Tong University Affiliated Sixth People's Hospital for suspected OSA between January 2007 and January 2013. Among these, we excluded 610 patients for the following reasons: (1) age younger than 18 years (n = 26); (2) previous treatment for OSA (n = 174); (3) treatment for diabetes mellitus (n = 81); (4) treatment with lipid‐lowering medications before the study (n = 120); and (5) other missing data (n = 209). Finally, we obtained data for 2402 men and 570 women to assess risk factors for hypertension and their interactive effects. The study was approved by the internal review board of the institutional ethics committee of Shanghai Jiao Tong University Affiliated Sixth Hospital and was conducted in accordance with the Declaration of Helsinki. Written informed consent was obtained from all patients before participation. Each patient received a one‐page information leaflet, which they signed as a means of signifying informed consent.
2.2. Biochemistry assays
Serum lipid profiles and glucose and insulin levels were measured in the hospital laboratory using routine procedures. MS was defined as follows: (1) presence of hypertension (defined as systolic BP ≥ 140 mm Hg, diastolic BP ≥ 90 mm Hg, or current use of antihypertensive medication); (2) overweight (defined as body mass index [BMI] ≥ kg/m2); (3) hyperglycemia (defined as fasting glucose [FG] ≥ 110 mg/dL [6.1 mmol/L] or a history of diabetes mellitus or antidiabetic medication use); (4) triglycerides (TG) ≥ 150 mg/dL (1.7 mmol/L) and high‐density lipoprotein cholesterol < 35 mg/dL (0.9 mmol/L) in men or < 39 mg/dL (1.0 mmol/L) in women, according to the criteria for MS of the Chinese Diabetes Society14; and (5) dyslipidemia (total cholesterol, low‐density lipoprotein cholesterol [LDL‐C], apolipoproteins A‐I, apolipoprotein B, apolipoprotein E, and lipoprotein (a) levels of ≥ 5.17 mmol/L, ≥ 3.33 mmol/L, < 1.2 g/L, > 1.1 g/L, > 0.05 g/L or < 0.03 g/L, and ≥ 0.3 g/L, respectively, according to the diagnostic criteria of the United States National Cholesterol Education Program Adult Treatment Panel III).15 Insulin resistance was calculated based on the insulin resistance index of the homeostasis model assessment, as follows: fasting serum insulin (μU/mL) × FG (mmol/L)/22.5.16
2.3. Overnight polysomnography parameters
Respiratory events were classified by reference to laboratory‐based polysomnography data (Alice 4 or 5; Respironics). The oxygen desaturation index was defined as the number of times per hour of sleep that the blood oxygen level dropped by ≥4% from baseline. The microarousal index was defined as the number of arousals per hour of sleep. Lowest oxygen saturation was defined as the lowest value of whole oxygen saturation observed during sleep. The AHI was defined as the number of apnea and hypopnea events per hour during sleep. OSA severity was classified into four categories (normal, mild OSA, moderate OSA, and severe OSA) using current standards: <5.0, 5.0–14.9, 15.0–29.9, and ≥30.0, respectively, according to the criteria of the American Academy of Sleep Medicine.17
2.4. Statistical Analysis
Data are presented as mean (standard deviation), median (interquartile range), and percentage values when they were normally distributed, skewed, and categorical, respectively. Differences in baseline characteristics among the four groups were examined using the Kruskal–Wallis H test, one‐way analysis of variance, Fisher exact test, or chi‐square test according to the normality of the distribution of the data. P values for linear trends across quartile groups were calculated using the polynomial linear trend test for continuous variables. Multiplicative interaction was evaluated with logistic regression using eight interaction terms, and additive interaction was evaluated in Excel software (Microsoft Corp) using the formula of Andersson: relative excess risk due to interaction ((RERI) = odds ratio [OR]11 − OR10 − OR01 + 1) was <0, as there was no additive interaction.18 The OR of the multiplicative interaction between OSA and metabolic disorder was investigated using eight interaction terms [non‐OSA * normal biomarkers (reference), mild OSA * normal biomarkers, moderate OSA * normal biomarkers, severe OSA * normal biomarkers, non‐OSA * abnormal biomarkers, mild OSA * abnormal biomarkers, moderate OSA * abnormal biomarkers, severe OSA * abnormal biomarkers] in the binary logistic regression model, with hypertension as the dependent variable and with adjustment for age, OSA severity, and selected risk factors.19 For multiplicative interactions, we calculated P values using the cross‐product terms of two risk factors investigated in the logistic models.19 Collinearity diagnostics and Spearman's correlation were applied before all statistical analyses to eliminate multicollinearity among variables.20 Statistical analyses were performed using SPSS software (version 20.0; SPSS Inc). P values <.05 were considered significant.
3. RESULTS
3.1. Patient baseline characteristics
Descriptive characteristics of the 2972 patients at baseline are shown in Table 1. All patients were categorized into four groups according to the presence of hypertension and sex. The prevalence rates of hypertension in men and women were 29.72% and 27.36%, respectively. Hypertension was more common in the elderly, who also showed a higher BMI and elevated serum lipid profiles, glucose and insulin levels, sleep parameter scores, and smoking and drinking incidence (%) than the normotensive population. However, high‐density lipoprotein cholesterol, apolipoprotein A‐I, and lipoprotein (a) were not different between patients with normotension and those with hypertension according to sex. A positive dose‐response relationship was observed between systolic BP, diastolic BP, and quartiles of FG, TG, and LDL‐C levels, BMI, and AHI score (Figure 1) (linear trends, P < .001).
Table 1.
Characteristics of men and women with and without hypertension
| Men | Women | |||
|---|---|---|---|---|
| Nonhypertension | Hypertension | Nonhypertension | Hypertension | |
| Demographics | ||||
| Patients, No. | 1688 | 714 | 414 | 156 |
| Age, y | 38.00 (32.00–47.00)b, *** | 47.00 (38.00–56.00)a, *** | 44.50 (36.00–55.00) | 55.5 (49.00–62.00)a, *** |
| SBP | 121.06 (114.00–126.00)b, *** | 134.00 (124.72–145.00)a, *** | 120.00 (110.00–124.72) | 135.46 (124.72–147.75)a, *** |
| DBP | 79.79 (72.00–80.00)b, *** | 89.00 (80.00–95.00)a, *** | 78.00 (68.75–80.00) | 80.00 (77.00–90.00)a, *** |
| BMI, kg/m2 | 26.12 (24.21–28.16)b, *** | 27.77 (25.71–30.11)a, *** | 23.87 (21.60–26.49) | 26.25 (24.04–29.14)a, *** |
| NC, cm | 39.43 (38–41) b, *** | 41.00 (39–43)a, *** | 34.00 (32.00–36.00) | 36.00 (34.00–38.223)a, *** |
| WC, cm | 94.48 (89.00–100.00) b, *** | 100.00 (93.00–106.00)a, *** | 85.00 (78.00–92.00) | 93.00 (86.00–100.00)a, *** |
| HC, cm | 100.00 (96.00–103.46) b, *** | 103.00 (98.00–107.00)a, *** | 96.00 (91.00–100.01) | 99.00(95.00–104.00)a, *** |
| Biochemistry assays | ||||
| TC, mmol/L | 4.67 (4.12–5.32) | 4.84 (4.25–5.46)a, *** | 4.56 (3.94–5.23) | 5.06 (4.39–5.50)a, *** |
| TG, mmol/L | 1.58 (1.09–2.29)b, *** | 1.81 (1.31–2.62)a, *** | 1.05 (0.74–1.58) | 1.52 (1.15–2.09) a, *** |
| HDL‐C, mmol/L | 1.02 (0.90–1.17)b, *** | 1.03 (0.90–1.17) | 1.21 (1.04–1.42) | 1.22 (1.06–1.42) |
| LDL‐C, mmol/L | 2.99 (2.50–3.53)b, *** | 3.17 (2.62–3.74)a, *** | 2.77 (2.28–3.35) | 3.17 (2.57–3.79)a, *** |
| apoA‐I, g/L | 1.02 (0.93–1.15)b, *** | 1.03 (0.93–1.14) | 1.16 (1.02–1.30) | 1.17 (1.03–1.34) |
| apoB, g/L | 0.83 (0.72–0.94)b, *** | 0.86 (0.76–0.97)a, *** | 0.76 (0.65–0.87) | 0.84 (0.74–0.98)a, *** |
| apoE, mg/L | 4.15 (3.4–5.19) | 4.46 (3.61–5.62)a, *** | 4.22 (3.43–5.11) | 4.78 (3.90–5.64)a, *** |
| Lp (a), g/L | 8.00 (4.30–15.27)b, * | 7.03 (3.61–14.82) | 9.50 (4.97–18.48) | 9.55 (5.70–17.30) |
| Glucose, mmol/L | 5.18 (4.85–5.55)b, *** | 5.47 (5.08–6.19)a, *** | 5.02 (4.68–5.49) | 5.28 (4.90–5.88)a, *** |
| Insulin, μU/L | 10.30 (6.60–15.41)b, *** | 12.76 (8.39–18.47)a, *** | 8.05 (5.27–12.37) | 10.67 (7.47–15.43)a, *** |
| HOMA‐IR | 0.87 (0.38–1.29)b, *** | 1.16 (0.69–1.57)a, *** | 0.58 (0.14–1.08) | 0.99 (0.55–1.38) a, *** |
| Metabolic disorder prevalence | ||||
| High TC, % | 30.33 | 36.27a, *** | 27.54 | 41.67a, *** |
| High TG, % | 44.37b, *** | 55.60a, *** | 21.74 | 36.54a, *** |
| Low HDL‐C, % | 23.52b, *** | 24.09 | 17.87 | 15.38 |
| High LDL‐C, % | 32.64b, *** | 40.48a, *** | 24.64 | 38.46a, *** |
| High apoA‐I, % | 83.00b, *** | 82.49 | 54.11 | 55.77 |
| High apoB, % | 6.40 | 7.84 | 3.62 | 7.69 |
| High apoE, % | 42.89 | 44.82 | 38.16 | 52.56a, *** |
| High Lp (a), % | 8.47 | 7.98 | 9.66 | 10.90 |
| High glucose, % | 11.91 | 29.13a, *** | 10.87 | 25.00a, *** |
| High insulin, % | 47.75b, *** | 56.86a, *** | 37.92 | 46.79 |
| High HOMA‐IR, % | 42.95b, *** | 59.24a, *** | 28.50 | 49.36a, *** |
| Obesity, % | 27.49b, *** | 48.46a, *** | 16.43 | 33.97a, *** |
| MetS, % | 7.29b, *** | 62.75a, *** | 4.11 | 42.95a, *** |
| Sleep apnea | ||||
| OSA prevalence, % | 82.64b, *** | 94.30a, *** | 50.24 | 87.18a, *** |
| AHI | 28.1 (8.12–55.3)b, *** | 48.80 (23.23–67.65)a, *** | 5.05 (0.70–22.05) | 22.35 (10.06–47.30)a, *** |
| LSpO2 | 81.00 (71.00–88.15)b, *** | 74.00 (64.00–83.00)a, *** | 90.00 (81.00–94.00) | 81.40 (73.00–88.00)a, *** |
| ODI | 27.45 (7.80–56.30)b, *** | 49.25 (26.05–67.62)a, *** | 5.15 (0.80–23.90) | 29.20 (13.77–51.67)a, *** |
| MAI | 24.00 (10.72–42.27)b, *** | 31.87 (13.90–52.87)a, *** | 12.35 (6.27–24.43) | 18.95 (7.00–37.00)a, *** |
| Medical history | ||||
| ESS | 8.00 (4.00–12.00)b, *** | 10.00 (6.00–15.00)a, *** | 5.00 (1.00–10.00) | 7.00 (3.00–12.00)a, *** |
| Smoking prevalence, % | 44.08b, *** | 55.18a, *** | 2.90 | 4.49 |
| Drinking prevalence, % | 26.60b, *** | 31.51a, * | 7.00 | 5.77 |
Normally distributed data were presented as means ± SD, skewed data were presented as the median (interquartile range), and categorical data were presented as the percentage. Differences of baseline characteristics among two groups were examined by using MannWhitney U test, Fisher's exact tests, or χ2 tests according to the characteristics of data distribution. AHI, apnea‐hypopnea index; apo, apolipoprotein; BMI, body mass index; DBP, diastolic blood pressure; ESS, excessive daytime sleepiness; HC, hip circumference; HDL‐C, high‐density lipoprotein cholesterol; HOMA‐IR, homeostatic model assessment for insulin resistance; LDL‐C, low‐density lipoprotein cholesterol; Lp(a), lipoprotein(a); LSpO2, lowest oxygen saturation; MAI, microarousal index; MetS, metabolic syndrome; NC, neck circumference; ODI, oxygen desaturation index; OSA, obstructive sleep apnea; SBP, systolic blood pressure; TC, total cholesterol; TG, triglycerides; WC, waist circumference.
Hypertension vs nonhypertension in women or men.
Nonhypertension in women vs nonhypertension in men.
P < .05.
P < .01.
P < .001.
Figure 1.
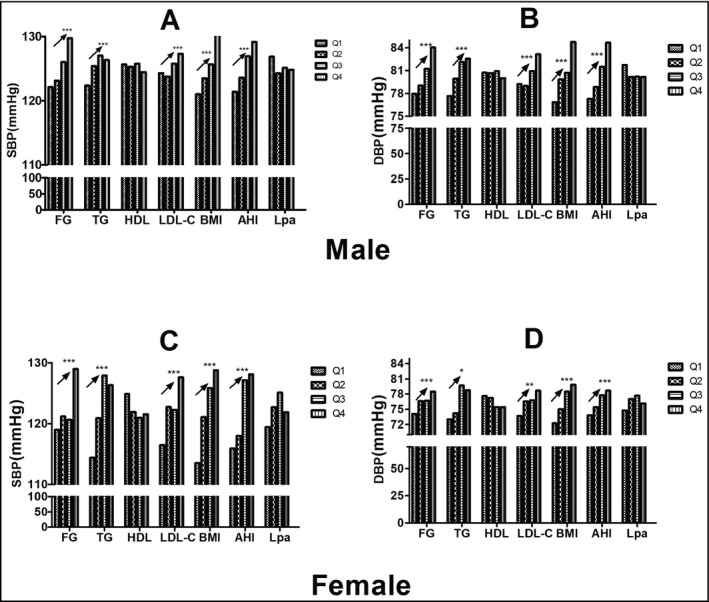
The tendency of systolic blood pressure (SBP) or diastolic blood pressure (DBP) between quartiles in apnea hypopnea index (AHI) and metabolic parameters. The SBP (A) or DBP (B) was higher in the higher quartile in fasting blood glucose (FG), triglycerides (TG), low‐density lipoprotein cholesterol (LDL‐C), body mass index (BMI), and AHI in men (upper panel). The SBP (C) or DBP (D) was higher in the higher quartile in FG, TG, LDL‐C, BMI, and AHI in women (lower panel). HDL indicates high‐density lipoprotein cholesterol; Lp(a), lipoprotein(a); Q1–Q4, the lowest to the highest quartile. *P < .05; **P < .01;*** P < .001
3.2. Prevalence and risk factors for hypertension by OSA severity
We compared the prevalence of hypertension between the normal and abnormal metabolism groups according to OSA severity. Men with severe OSA, but not the other OSA severity groups, showed a significantly higher prevalence of hypertension in abnormal TG and LDL‐C subgroups (P < .01). Patients with high glucose levels and those who were overweight were more likely to have hypertension in almost all OSA severity categories. However, in women in all OSA severity categories, no abnormal metabolic components increased the risk of hypertension (Table 2). Considering that most Chinese women experience menopause at 55 years of age, we also categorized participants by age: younger than 55 years (n = 382) and 55 years and older (n = 118), and the data showed similar results (Table S1). These results suggest that, in men, the association between metabolism and hypertension may differ by OSA severity.
Table 2.
Prevalence of hypertension stratified by OSA severity according to abnormal or normal metabolism in men
| Hypertension, No. (%) | |||||||||||
|---|---|---|---|---|---|---|---|---|---|---|---|
| Sex | OSA | TG | HDL‐C | LDL‐C | High glucose | Overweight | |||||
| Normal | Abnormal | Normal | Abnormal | Normal | Abnormal | Normal | Abnormal | Normal | Abnormal | ||
| Men | Normal (n = 333) | 36 (10.74) | 51 (15.38) | 43 (12.82) | 28 (8.33) | 38 (11.32) | 49 (14.71) | 39 (11.61) | 58 (17.39) | 29 (8.57)** | 60 (17.89)** |
| Mild (n = 387) | 65 (16.67) | 94 (24.18) | 70 (18.18) | 98 (25.32) | 77 (20.00) | 73 (18.85) | 68 (17.58)** | 145 (37.50)** | 44 (11.45)** | 100 (25.79)** | |
| Moderate (n = 380) | 106 (27.98) | 102 (26.74) | 112 (29.54) | 81 (21.21) | 107 (28.24) | 97 (25.60) | 91 (24.01)** | 186 (49.02)** | 87 (22.81) | 111 (29.32) | |
| Severe(n = 1302) | 439 (33.73)** | 539 (41.40)** | 493 (37.90) | 496 (38.07) | 452 (34.75)** | 556 (42.67)** | 426 (32.74)*** | 726 (55.78)*** | 393 (30.21)*** | 516 (39.64)*** | |
| Women | Normal (n = 226) | 16 (7.18) | 44 (19.35) | 17 (7.45) | 36 (15.79) | 19 (8.56) | 23 (10.26) | 19 (8.37) | 41 (18.18) | 16 (6.90) | 35 (15.38) |
| Mild (n = 115) | 36 (31.46) | 40 (34.62) | 39 (33.67) | 27 (23.53) | 34 (29.33) | 43 (37.50) | 35 (30.61) | 47 (41.18) | 30 (25.71) | 49 (42.22) | |
| Moderate (n = 95) | 34 (36.07) | 42 (44.12) | 36 (37.97) | 42 (43.75) | 34 (35.48) | 43 (45.45) | 34 (35.71) | 46 (48.00) | 36 (38.30) | 38 (39.58) | |
| Severe (n = 134) | 60 (44.87) | 65 (48.21) | 69 (51.40)* | 35 (25.93)* | 57 (42.86) | 70 (52.00) | 57 (42.72) | 78 (58.06) | 54 (40.63) | 64 (48.04) | |
OSA, obstructive sleep apnea.
Abnormal vs normal metabolism for triglycerides (TG), high‐density lipoprotein cholesterol (HDL‐C), low‐density lipoprotein cholesterol (LDL‐C), glucose, and body mass index, respectively.
P < .05.
P < .01.
P < .001.
3.3. Independent associations of OSA, dyslipidemia, high glucose, and overweight with hypertension
We next explored the independent associations of abnormal metabolism and OSA with hypertension. Binary forward logistic regression models were used to screen for hypertension risk factors, including age, TG, high‐density lipoprotein cholesterol, LDL‐C, lipoprotein (a) and glucose levels, overweight, smoking, and drinking in model 1, with further full adjustment for AHI and microarousal index performed in model 2 (Table 3). In model 1, the risk of hypertension was significantly higher in men with abnormal TG and LDL‐C levels, high glucose levels, and overweight status, as well as in smokers. After adjusting for AHI and microarousal index, all other risk factors in model 1 remained significant in model 2, except for high LDL‐C level. In contrast, among women, an abnormal LDL‐C level, overweight status, and smoking, but not high TG or high glucose, were predictors of hypertension in model 1, and no MS component was significantly associated with hypertension after full adjustment in model 2. We reclassified the patients based on whether they were premenopausal or postmenopausal. The risk of hypertension increased in the presence of LDL‐C abnormalities and overweight in model 1, but only among those who were premenopausal. Overweight remained a significant predictor of hypertension in model 2 after further adjustment (P < .01) (Table S2). As shown in Table S3, the multiple linear regression results were similar in logistic regression models. In men, BMI, TG, fasting glucose, and AHI were significantly and independently associated with systolic BP and diastolic BP.
Table 3.
Binary logistic regression model of selected factors, including those associated with dyslipidemia, predicting hypertension in men and women
| Men (n = 2402) | Women (n = 570) | |
|---|---|---|
| Model 1 | ||
| Age, y | 1.06 (1.05–1.07)*** | 1.08 (1.06–1.11)*** |
| High TG | 1.32 (1.09–1.61)** | |
| High LDL‐C | 1.26 1.03–1.53)* | 1.65 (1.07–2.55)* |
| High glucose | 2.02 (1.60–2.67)*** | |
| Overweight | 2.11 1.67–2.66)*** | 2.05 (1.36–3.10)*** |
| Smoking | 1.46 (1.21–1.77)*** | 4.51 (1.48–13.77)** |
| Drinking | ||
| Model 2 | ||
| Age, y | 1.06 (1.05–1.07)*** | 1.07 (1.05–1.10)*** |
| High TG | 1.25 (1.02–1.52)* | |
| High LDL‐C | ||
| High glucose | 1.90 (1.50–2.41)*** | |
| Overweight | 1.72 (1.35–2.20)*** | |
| Smoking | 1.45 (1.20–1.76)*** | 3.19 (1.04–9.76)* |
| Drinking | ||
| Non‐OSA | 1 | 1 |
| Mild OSA | 1.35 (0.87–2.09) | 3.31 (1.04–9.76)*** |
| Moderate OSA | 1.72 (1.12–2.64)** | 3.69 (1.92–7.12)*** |
| Severe OSA | 2.39 (1.62–3.53)*** | 4.82 (2.62–8.862)*** |
| MAI | 1.00 (1.00–1.01)* | |
Values are expressed as odds ratios (95% confidence intervals).
We performed forward binary logistic regression. Model 1 was adjusted for age, high triglycerides (TG), low high‐density lipoprotein cholesterol, high low‐density lipoprotein cholesterol (LDL‐C), high lipoprotein(a), high glucose, overweight, smoking, drinking, and obstructive sleep apnea (OSA) severity.
Microarousal index (MAI) was additionally adjusted for in model 2. Age and MAI are continuous variables; all other variables in the model are categorical.
P < .05.
P < .01.
P < .001.
3.4. Effects of the interactions between OSA and dyslipidemia, high glucose, and overweight on hypertension
The percentages of different OSA severities were compared using chi‐square test among the different clustering of abnormalities in MS in each sex as shown in S1, and the patients with more components of MS had a higher percentage of severe OSA in both sex. In particular, this clustering feature seemed to be associated with more severe OSA in men than in women (F = 392.90 and 154.279, respectively). The eight‐level multiplicative interactions between OSA severity were then quantified based on OSA severity and the identified independent risk factors. After adjusting for age, high TG and glucose levels, overweight status, and OSA severity, the ORs of the interaction between overweight and OSA severity category were as follows (in size order): [severe OSA * overweight = 6.99 (95% confidence interval [CI], 3.95–9.37) > moderate OSA* overweight = 4.08 (95% CI, 2.28–7.29) > mild OSA* overweight = 3.76 (95% CI, 1.98–7.12) > overweight without OSA = 3.33 (95% CI, 1.38–8.08) > severe OSA *normal weight = 2.92 (95% CI, 1.91–4.48) > moderate OSA * normal weight = 2.16 (95% CI, 1.33–3.51) > mild OSA * normal weight =1.51 (95% CI, 0.92–2.51)]. The ORs of the interaction between hyperglycemia and OSA severity category were as follows: severe OSA * high glucose = 3.65 (95% CI, 2.31–5.78) > moderate OSA * high glucose = 3.56 (95% CI, 1.79–7.11) > severe OSA * normal glucose = 2.05 (95% CI, 1.38–3.05). Finally, the ORs of the interaction between high TG and OSA severity category were as follows: severe OSA * high TG = 3.42 (95% CI, 2.16–5.42) > moderate OSA* high TG = 2.07 (95% CI, 1.20–3.58) > mild OSA* high TG = 2.13 (95% CI, 1.19–3.81) > severe OSA * normal TG = 2.59 (95% CI, 1.63–4.13) > moderate OSA* normal TG = 2.24 (95% CI, 1.30–3.84). The additive interaction index RERI results show that the effects of hyperglycemia, overweight, and abnormal TG on OSA may be significantly additive (Figure 2). For example, the additive effect on hypertension risk was 4.67‐fold that of the sum of OSA alone and overweight alone. The interaction terms for 12 interactions (combinations of normal weight, overweight, or obesity with OSA severity) are provided in S2. As OSA severity increased, the risk of hypertension in the overweight and obesity groups increased markedly compared with the normal weight group (Figure 2. When hyperglycemia was defined by an of FBG ≥ 5.6, as in the ADA definition of 2003, the multiplicative interaction and additive interaction results are illustrated in Figure S3 However, abnormal high‐density lipoprotein cholesterol proved to be a key component of MS, which did not show any association with hypertension or OSA in either sex.
Figure 2.
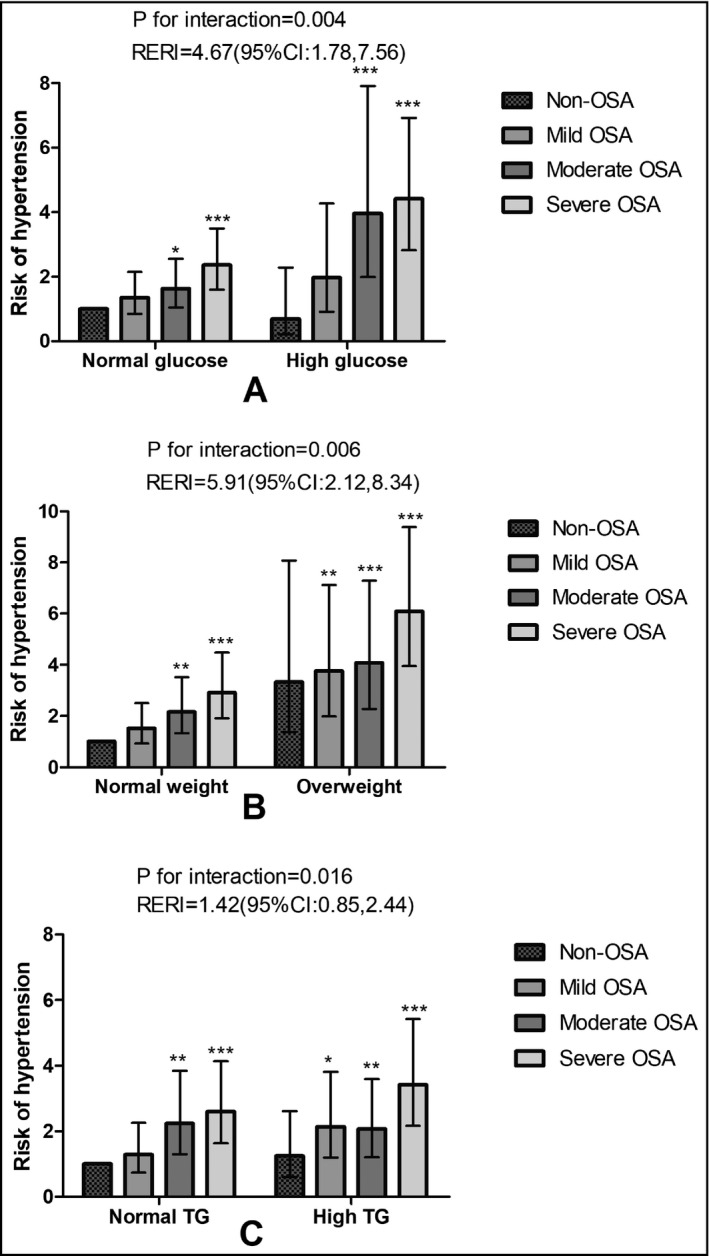
The interaction between obstructive sleep apnea (OSA) severity and the metabolic disorder in men. The joint risk of hypertension in OSA with higher glucose (A), or overweight (B), or high triglycerides (TG; C) compared with those without or with either OSA or each component disorder. We performed forward binary logistic regression for hypertension as a dependent variable and adjusted for age, high TG, low‐density lipoprotein cholesterol (LDL‐C) and glucose, overweight, and OSA severity to investigate a possible multiplicative interaction of OSA with TG, LDL‐C, high glucose, and overweight, respectively. Age was a continuous variable and the others as categorized variables in the model. The relative excess risk due to interaction (RERI) was to index the effect size of additive interaction. CI indicates confidence interval. *P < .05; **P < .01;***P < .001
4. DISCUSSION
The present study showed that TG abnormalities, hyperglycemia, and overweight status were independently associated with hypertension, especially in men with OSA. Furthermore, both these MS components and OSA were synergistically associated with an increased risk of developing hypertension in men compared with the patients without, or with either OSA or MS. Our study also provided effect sizes of the joint interactions between specific components of MS and OSA on hypertension, especially in overweight and hyperglycemic individuals with OSA, for the prediction of hypertension.
MS was independently associated with hypertension in men with OSA. However, we found no association between high LDL‐C levels and an increased risk of hypertension in men, which was inconsistent with previous reports.21 Possible reasons for this are as follows: first, LDL‐C had a significant but marginal association with hypertension (P = .030 in men); and second, the association between LDL‐C and hypertension might be mediated by OSA severity. The associations of OSA and LDL‐C with hypertension may share a common pathway. In our previous study, among various serum lipid components, only LDL‐C was independently associated with OSA.22 The independent associations of high TG, obesity, and diabetes mellitus with hypertension have been investigated in previous cross‐sectional and prospective studies.9, 23, 24, 25, 26 Similar independent associations were observed in men but not in women. One possible explanation for this is the sex difference in CVD prevalence. Some factors are present in women, such as fluctuating estrogen levels (with age), which affect metabolism.13 Our results also indicate that menopausal status may influence the association between MS and hypertension. Animal, clinical, and observational studies have revealed that the imbalance caused by hormonal changes in estrogen and testosterone levels may contribute to CVD risk, and that hormone therapy may serve to mitigate this risk.27 Substantial evidence from animal studies indicates that estrogen modulates BP directly by inhibiting the synthesis of potent vasoconstrictors.28 Rodent models have demonstrated that estrogen modulates the activity of the sympathetic nervous system via activation of angiotensin type 2 receptors in the kidney.29 The role of the sympathetic nervous system in OSA has attracted particular attention. In addition, testosterone appears to have a beneficial effect on body composition and glucose and lipid metabolism by improving muscle strength and physical performance.30 The mechanisms underlying sex differences in hypertension and associated CVD are not fully understood; thus, more studies are needed.
MS impairs endothelial function,31 reduces the ability of baroreceptors located on blood vessels to activate the sympathetic nervous system,32 decreases the distensibility of large elastic arteries,33 and disrupts the regulation of BP. In obese individuals, adipose tissue secretes adipocytokines, such as leptin, inducing insulin resistance and subsequently activating the sympathetic nervous system and renin‐angiotensin system.34, 35 Some biological changes also occur in OSA in animal models.36 Hypertension, obesity, dyslipidemia, and insulin resistance are considered important risk factors for OSA.37 They also have the potential to interact and thus affect the development and progression of chronic CVD. In the present study, analysis of multiplicative and additive interactions suggested a common mechanism underlying the synergistic effects of dyslipidemia, obesity, and OSA on hypertension in men. There are likely to be multiple pathophysiological mechanisms underlying the interactive effects of these factors on hypertension. For instance, the role of the sympathetic nervous system in the pathogenesis of obesity‐related hypertension has attracted much interest.9, 32 It is well known that OSA also results in persistently increased sympathetic activity, even during the daytime and in the absence of any comorbidities.7 Moreover, OSA and its comorbidities together increase the risk of hypertension.10 OSA co‐occurring with MS may increase the risk of hypertension, thereby predisposing an individual to CVD to a greater degree than either condition alone.
From a clinical perspective, our results suggest that the association between hypertension and OSA may be partly mediated by MS, which is further supported by randomized trials showing that CPAP monotherapy did not significantly improve insulin sensitivity, dyslipidemia, or obesity.10, 11, 38, 39 In OSA‐related hypertension, CPAP therapy combined with metabolic interventions, such as weight loss, may have a more beneficial effect on hypertension compared with CPAP alone.10, 11, 38 However, a negative finding was reported in the cross‐sectional Wisconsin Sleep Cohort Study.40 Working patients were characterized by less severe OSA (3.49%) and a higher likelihood of being obese (BMI = 29 ± 6 kg/m2).3 In addition, the adverse effect of OSA on hypertension was unexpectedly reduced with increasing BMI among patients with OSA, which is also inconsistent with conventional clinical practice. This disparity might be attributable to differences in the population samples and methods among studies. Our patients, who were more likely to have OSA (86.13% of men and 60.35% of women), were drawn from a clinical population and provided us with the opportunity to demonstrate an interaction effect of OSA and MS on hypertension. To effectively manage hypertension, it is crucial to understand the relationship between clustered risk factors and hypertension in patients with OSA. In clinical practice, if we treat hypertension in patients with OSA by reference only to a single pathophysiological condition, such as obesity, high glucose levels, or hypoxia, efforts to prevent hypertension and regulate BP will prove ineffective.10 Treatment strategies for hypertension and CVD tailored according to the particular complications that are present could lead to improved outcomes in patients with OSA.34 However, this hypothesis is speculative and more studies are needed to precisely delineate the pathophysiology of hypertension.
5. STUDY LIMITATIONS
There were some limitations to this study. The study sample largely comprised young and middle‐aged adults, such that the results are mainly applicable to these populations. In addition, despite adjusting for several common confounding factors, other more complex factors were not considered, such as lifestyle and exercise and dietary habits. The inherent limitations of our hospital‐based study design should not be ignored; however, these did not compromise the value of our work. Further studies are required on the interaction effect of OSA and MS on hypertension.
6. CONCLUSIONS
In this study, MS was independently associated with an increased risk of hypertension in men. Additionally, features of MS, particularly overweight and a high glucose level, augmented the effect of OSA on hypertension. These results suggest that MS may play a mediating role in the hypertension induced by OSA and increase our understanding of the mechanisms underlying hypoxia and metabolism. This could, in turn, lead to more effective treatments for hypertension.
CONFLICT OF INTEREST
None.
Supporting information
ACKNOWLEDGMENTS
The authors thank Professor Yue Wang (Center for Disease Control and Prevention of China, Beijing, China) for statistical analysis.
Zhao X, Xu H, Zou J, et al. Joint interaction effect of metabolic syndrome and obstructive sleep apnea on hypertension. J Clin Hypertens. 2018;20:1203–1212. 10.1111/jch.13322
Funding information
National Key R&D Program of China. Grant Numbers: 2017YFC0112500.
Zhao and Xu contributed equally to this paper.
REFERENCES
- 1. Young T, Palta M, Dempsey J, Skatrud J, Weber S, Badr S. The occurrence of sleep‐disordered breathing among middle‐aged adults. N Engl J Med. 1993;328:1230‐1235. [DOI] [PubMed] [Google Scholar]
- 2. Silverberg DS, Oksenberg A. Are sleep‐related breathing disorders important contributing factors to the production of essential hypertension? Curr Hypertens Rep. 2001;3:209‐215. [DOI] [PubMed] [Google Scholar]
- 3. Peppard PE, Young T, Palta M, Skatrud J. Prospective study of the association between sleep disorderd breathing and hypertension. N Engl J Med. 2003;342:1378‐1384. [DOI] [PubMed] [Google Scholar]
- 4. Lavie L, Lavie P. Molecular mechanisms of cardiovascular disease in OSAHS: the oxidative stress link. Eur Respir J. 2009;33:1467‐1484. [DOI] [PubMed] [Google Scholar]
- 5. Redón J, Oliva MR, Tormos C, et al. Antioxidant activities and oxidative stress byproducts in human hypertension. Hypertension. 2003;41:1096‐1101. [DOI] [PubMed] [Google Scholar]
- 6. Bradley TD, Floras JS. Obstructive sleep apnoea and its cardiovascular consequences. Lancet 2009; 373:82‐93. [DOI] [PubMed] [Google Scholar]
- 7. Henderson LA, Macefield VG. Obstructive sleep apnoea and hypertension: the role of the central nervous system. Curr Hypertens Rep. 2016;18:59. [DOI] [PubMed] [Google Scholar]
- 8. Kulkarni H, Mamtani M, Blangero J, Curran JE. Lipidomics in the study of hypertension in metabolic syndrome. Curr Hypertens Rep. 2017;19:7. [DOI] [PubMed] [Google Scholar]
- 9. Straznicky NE, Eikelis N, Lambert EA, Esler MD. Mediators of sympathetic activation in metabolic syndrome obesity. Curr Hypertens Rep. 2008;10:440‐447. [DOI] [PubMed] [Google Scholar]
- 10. Ahmad M, Makati D, Akbar S. Review of and updates on hypertension in obstructive sleep apnea. Int J Hypertens. 2017;2017:1848375. [DOI] [PMC free article] [PubMed] [Google Scholar]
- 11. Chirinos JA, Gurubhagavatula I, Teff K, et al. CPAP, weight loss, or both for obstructive sleep apnea. N Engl J Med. 2014;370:2265‐2275. [DOI] [PMC free article] [PubMed] [Google Scholar]
- 12. Vidal M, Cusick ME, Barabási A‐L. Interactome networks and human disease. Cell. 2011;144:986‐998. [DOI] [PMC free article] [PubMed] [Google Scholar]
- 13. Zárate S, Astiz M, Magnani N, et al. Hormone deprivation alters mitochondrial function and lipid profile in the hippocampus. J Endocrinol. 2017;233:1‐14. [DOI] [PubMed] [Google Scholar]
- 14. Zhou BF, Cooperative Meta‐Analysis Group of the Working Group on Obesity in China . Predictive values of body mass index and waist circumference for risk factors of certain related diseases in Chinese adults–study on optimal cut‐off points of body mass index and waist circumference in Chinese adults. Biomed Environ Sci 2002; 15: 83‐96. [PubMed] [Google Scholar]
- 15. National Cholesterol Education Program Expert Panel on Detection, E. & Treatment of High Blood Cholesterol in Adults . Third report of the National Cholesterol Education Program (NCEP) expert panel on detection, evaluation, and treatment of high blood cholesterol in adults (Adult Treatment Panel III) final report. Circulation 2002; 106:3143‐3421. [PubMed] [Google Scholar]
- 16. Bonora E, Targher G, Alberiche M, et al. Homeostasis model assessment closely mirrors the glucose clamp technique in the assessment of insulin sensitivity: studies in subjects with various degrees of glucose tolerance and insulin sensitivity. Diabetes Care. 2000;23:57‐63. [DOI] [PubMed] [Google Scholar]
- 17. Iber C, Chesson AL, Ancoli‐Israel S, Quan SF. The AASM Manual for the Scoring of Sleep and Associated Events: rules, Terminology and Technical Specifcations. 1st ed. Darien, IL: American Academy of Sleep Medicine, 2007. [Google Scholar]
- 18. Andersson T, Alfredsson L, Källberg H, Zdravkovic S, Ahlbom A. Calculating measures of biological interaction. Eur J Epidemiol. 2005;20:575‐579. [DOI] [PubMed] [Google Scholar]
- 19. Nagaya T, Yoshida H, Takahashi H, Kawai M. Resting heart rate and blood pressure, independent of each other, proportionally raise the risk for type‐2 diabetes mellitus. Int J Epidemiol. 2010;39:215‐222. [DOI] [PubMed] [Google Scholar]
- 20. Guan J, Yi H, Zou J, et al. Distinct severity stages of obstructive sleep apnoea are correlated with unique dyslipidaemia: large‐scale observational study. Thorax. 2016;71:347‐355. [DOI] [PMC free article] [PubMed] [Google Scholar]
- 21. Halperin RO, Sesso HD, Ma J, Buring JE, Stampfer MJ, Gaziano JM. Dyslipidemia and the risk of incident hypertension in men. Hypertension. 2006;47:45‐50. [DOI] [PubMed] [Google Scholar]
- 22. Xu H, Guan J, Yi H, et al. Elevated low‐density lipoprotein cholesterol is independently associated with obstructive sleep apnea: evidence from a large‐scale cross‐sectional study. Sleep Breath. 2016;20:627‐634. [DOI] [PubMed] [Google Scholar]
- 23. Hunt SC, Stephenson SH, Hopkins PN, Williams RR. Predictors of an increased risk of future hypertension in Utah A screening analysis. Hypertension. 1991;17:969‐976. [DOI] [PubMed] [Google Scholar]
- 24. Borghi C, Dormi A, Veronesi M, Sangiorgi Z, Gaddi A, Brisighella Heart Study Working Party . Association between different lipid‐lowering treatment strategies and blood pressure control in the Brisighella Heart Study. Am Heart J 2004; 148: 285‐292. [DOI] [PubMed] [Google Scholar]
- 25. Stamler R, Stamler J, Riedlinger WF, Algera G, Roberts RH. Weight and blood pressure. Findings in hypertension screening of 1 million Americans. JAMA. 1978;240:1607‐1610. [DOI] [PubMed] [Google Scholar]
- 26. Kastarinen MJ, Nissinen AM, Vartiainen EA, et al. Blood pressure levels and obesity trends in hypertensive and normotensive Finnish population from 1982 to 1997. J Hypertens. 2000;18:255‐262. [DOI] [PubMed] [Google Scholar]
- 27. Iorga A, Cunningham CM, Moazeni S, Ruffenach G, Umar S, Eghbali M. The protective role of estrogne and estrogen receptors in cardiovascular disease and the controversial use of estrogen therapy. Bio Sex Differ. 2017;8:33. [DOI] [PMC free article] [PubMed] [Google Scholar]
- 28. Colafella KM, Denton KM. Sex‐specific difference in hypertension and associated cardiovascular disease. Nat Rev Nephrol. 2017;14:185‐201. [DOI] [PubMed] [Google Scholar]
- 29. Hilliard LM, Nematbakhsh M, Kett MM, et al. Gender difference in pressure natriuresis and renal autoregulation. Hypertension. 2011;57:275‐282. [DOI] [PubMed] [Google Scholar]
- 30. Corona G, Giagulli VA, Maseroli E, et al. Testosterone supplementation and body composition: results from a meta‐analysis of observational studies. J Endocrinol Invest. 2016;39:967‐981. [DOI] [PubMed] [Google Scholar]
- 31. Casino PR, Kilcoyne CM, Quyyumi AA, Hoeg JM, Panza JA. The role of nitric oxide in endothelium‐dependent vasodilation of hypercholesterolemic patients. Circulation. 1993;88:2541‐2547. [DOI] [PubMed] [Google Scholar]
- 32. Piccirillo G, Di Giuseppe V, Nocco M, et al. Influence of aging and other cardiovascular risk factors on baroreflex sensitivity. J Am Geriatr Soc. 2001;49:1059‐1065. [DOI] [PubMed] [Google Scholar]
- 33. Wilkinson IB, Prasad K, Hall IR, et al. Increased central pulse pressure and augmentation index in subjects with hypercholesterolemia. J Am Coll Cardiol. 2002;39:1005‐1011. [DOI] [PubMed] [Google Scholar]
- 34. McGill JB, Haffner S, Rees TJ, Sowers JR, Tershakovec AM, Weber M. Progress and controversies: treating obesity and insulin resistance in the context of hypertension. J Clin Hypertens (Greenwich). 2009;11:36‐41. [DOI] [PMC free article] [PubMed] [Google Scholar]
- 35. Wu X, Yang X, Shan R, et al. Potential mediating biomarkers underlying the association of body mass index or waist circumference with blood pressure: results from three population‐based studies. Sci Rep. 2017;7:5364. [DOI] [PMC free article] [PubMed] [Google Scholar]
- 36. Quintero M, Olea E, Conde SV, et al. Age protects from harmful effects produced by chronic intermittent hypoxia. J Physiol. 2016;594:1773‐1790. [DOI] [PMC free article] [PubMed] [Google Scholar]
- 37. Karkinski D, Georgievski O, Dzekova‐Vidimliski P, Milenkovic T, Dokic D. Obstructive sleep apnea and lipid abnormalities. Open Access Maced J Med Sci. 2017;5:19‐22. [DOI] [PMC free article] [PubMed] [Google Scholar]
- 38. Robinson GV, Langford BA, Smith DM, Stradling JR. Predictors of blood pressure fall with continuous positive airway pressure (CPAP) treatment of obstructive sleep apnoea (OSA). Thorax. 2008;63:855‐859. [DOI] [PubMed] [Google Scholar]
- 39. Joosten SA, Hamilton GS, Naughton MT. Impact of weight loss management in OSA. Chest. 2017;152:194‐203. [DOI] [PubMed] [Google Scholar]
- 40. Young T, Peppard P, Palta M, et al. Population‐based study of sleep disordered breathing as a risk factor for hypertension. Arch Intern Med. 1997;157:1746‐1752. [PubMed] [Google Scholar]
Associated Data
This section collects any data citations, data availability statements, or supplementary materials included in this article.
Supplementary Materials