

Abstract
There is limited epidemiologic data on hypertension (HTN) in Lebanon. This study aimed to determine the prevalence and associated risk factors of HTN in the adult Lebanese population and evaluate the association between dietary and psychological factors on systolic blood pressure (SBP). Cross‐sectional analyses were conducted using a multistage cluster sample across Lebanon. A total of 2014 participants were included. The prevalence and control rates of HTN were 31.2% and 28.7%, respectively. In women, educational level and physical activity were negatively associated with HTN (P < .05 for both) and adherence to the Lebanese Mediterranean diet was associated with a lower SBP. Other factors were associated with HTN in men. There was no relationship with SBP and psychological distress. Of the modifiable risk factors, body mass index persisted as the only contributory factor in both sexes (P < .01). Accordingly, prevention of HTN at the population level should focus mainly on overweight prevention.
Keywords: blood pressure, body mass index, epidemiology, hypertension, lifestyle behavior, Mediterranean diet
1. INTRODUCTION
Hypertension (HTN) was found to be the number 1 risk factor in 2010 for the Global Burden of Disease study and contributes to the burden of heart disease, stroke, kidney failure, dementia, premature death, and disability.1, 2 Over the years, the prevalence of HTN reached epidemic proportions, affecting over one‐quarter of the worldwide adult population, causing an estimated 10 million deaths every year.2 Furthermore, national health surveys in various countries have shown a high prevalence of poor blood pressure (BP) control at the 140/90 mm Hg threshold among hypertensive patients. In the United States, more than 45% did not have their BP controlled,3 and in Europe, BP control ranged between 40% and 19%.4 In the Middle East and Arab countries, existing studies reported a higher rate of uncontrolled BP, ranging from 56% (Tunisia) to 92% (Egypt and Syria).5 Although the pathogenesis of primary HTN is still not completely understood, mixing obvious genetic and environmental factors, the increasing prevalence is attributed to population growth, aging, and behavioral risk factors.6 Several clinical trials studied the efficacy of lifestyle modifications to reduce BP, leading to the commonly known 5 non‐pharmacologic recommendations in worldwide guidelines on the prevention and management of hypertension:7 (1) maintain a normal body weight (body mass index [BMI] < 25 kg/m2), (2) engage in regular aerobic physical activity, (3) limit alcohol consumption to 2 drinks a day for men and 1 drink a day for women; (4) reduce dietary salt intake to no more than 6 g/day; and (5) adopt a dietary approach to stop hypertension (DASH), including consuming a diet rich in fruits, vegetables, and low‐fat dairy products with a reduced content of saturated and total fat. More recently, nutrition and dietary patterns have been an area of research focus, such as the French Nutrition and Health Program that aimed at the prevention of high BP through nutrition.8 Lebanon is an upper‐middle‐income country with a surface area of 10 542 Km2 and a population of 4.42 million (year 2012).9 Limited epidemiologic data on HTN exist in Lebanon. In fact, one previous study reported that the prevalence of HTN and BP control were 35.9% and 27%, respectively.10 However, the study had several limitations: (1) the study population was not representative of the Lebanese population, (2) it did not extensively discuss the risk factors associated with HTN, and (3) it did not address the relationship between HTN and lifestyle behaviors, including dietary habits. Therefore, we conducted this study to determine the prevalence and risk factors of hypertension specifically in the Lebanese adult population. We aimed to evaluate the association between HTN and lifestyle behaviors as well as to explore the relationship between the Lebanese‐adopted Mediterranean diet and psychological factors on the systolic BP.
2. METHODS
2.1. Study design and study population
In the framework of the study, assessing the prevalence of cardiovascular diseases (CVD) and their risk factors among Lebanese residents using a multistage cluster sample all over Lebanon,11 we conducted this ancillary cross‐sectional analysis. Using a software program, we randomly selected 100 circumscriptions from the list of circumscriptions in Lebanon (villages, towns, and cities)12 without excluding any territory. Residents older than 20 years (arbitrary decision) with no a priori exclusion criteria were then randomly selected from the list of dwellers provided by the local authority. Participants were interviewed at a governmental location and data were gathered after giving oral and written consent. The sample size consisted of a total of 2088 participants,11 of which 40 were excluded for missing the majority of the data, 23 for missing blood pressure values, and 11 for using vasoactive medications. Accordingly, 2014 participants were included in the current analysis.
2.2. Anthropometrics and blood pressure measurements
Anthropometrics and BP measurements were taken using a standardized protocol. Using an automatic validated device, systolic BP (SBP) and diastolic BP (DBP) were measured twice at 1‐minute intervals in a seated position after 5 minutes of rest.13 The average of the 2 measurements was used for the analyses. Pulse pressure (PP = SBP − DBP) and mean arterial pressure (MAP = 2/3 * DPB + 1/3 * SBP) were calculated according to the usual formula. Random capillary blood glucose (RCBG) was measured using Accu‐Check® Performa.14 Weight measurement was performed with an electronic scale with participants wearing light clothes; height was measured with a wall‐mounted measuring rod. BMI was calculated and reported as a continuous variable and divided into 3 categories: normal weight (BMI < 25 kg/m2), overweight (BMI 25 kg/m2 < 30 kg/m2), and obese (BMI ≥ 30 kg/m2). Waist circumference was measured in cm.
2.3. HTN prevalence and BP control definitions
Prevalent HTN was defined by an SBP ≥ 140 mm Hg and/or a DBP ≥ 90 mm Hg or by individuals who were currently taking antihypertensive medications.7 Participants who reported being hypertensive, but who were not taking blood pressure lowering drugs and their average SBP or DBP did not meet the above definition, were not considered to be hypertensive. Uncontrolled BP was defined as mean SBP ≥ 140 mm Hg and/or mean DBP ≥ 90 mm Hg.7
2.4. Chronic diseases variables definitions
Diabetes was defined as random capillary blood glucose (RCBG) >200 mg/dL or self‐reported medication use for glucose control.15 Hypercholesterolemia or hypertriglyceridemia was considered when participants reported having a blood test that diagnosed the condition or if they were taking lipid‐lowering medications. We defined coronary heart disease (CHD) as any self‐reported history of myocardial infarction (MI), percutaneous coronary intervention (PCI), coronary artery bypass graft (CABG), or angina using the “definite angina” definition of the Rose Angina Questionnaire.16 Participants who self‐reported a history of stroke or transient ischemic attack were identified as having cerebrovascular accident (CVA), even if non‐medically validated. We computed the variable (any cardiovascular disease [any CVD]) as those with either CHD or CVA. A family history of premature CVD was defined as a fatal or non‐fatal CVD event or/and established diagnosis of CVD in a first‐degree relative (father, mother, brother, sister, children) younger than 55 years for males and 65 years for females.17
2.5. Mediterranean diet and psychological distress score calculation
Dietary habits were assessed using the Lebanese Mediterranean Diet Score (LMDS). Details concerning the questionnaire and the choice of the detrimental and beneficial components have been explained elsewhere.18 Briefly, an adapted nonquantitative food frequency questionnaire (FFQ) was used. For components presumed to be beneficial (raw vegetables, cooked vegetables, fruits, olive oil, food grains and beans, fish, rice and pasta, whole grain bread, and white bread), a score of 0 was assigned for people who did not consume it at all; a score of 1 was assigned for those who consumed it less than 2 times a week; a score of 2 for those who consumed it 3 to 6 times per week; a score of 3 for those who consumed it at least once per day; and a score of 4 for those who consumed it at every meal. For components presumed to be health detrimental (meat, fried food, sweets, and fast food), an inverse score was assigned. Thus, the LMDS score ranged from 0 to 52 (maximal adherence).
We assessed psychological distress using the Beirut Distress Scale (BDS‐22), a scale that was developed and validated in the Lebanese population. The BDS‐22 consisted of 22 items and had a 4‐point (0 to 3) Liker‐type response format. Thus, the BDS‐22 ranged from 0 to 66 (maximum psychological distress).19
2.6. Behavioral risk factors definitions
Leisure time physical activity was assessed based on the updated Compendium of Physical Activities. The type and frequency of exercise were self‐reported. For each activity, we assigned the corresponding metabolic equivalent (MET) value, then a 3‐level classification was done as follows: light‐intensity (1.6 to 2.9 METs), moderate‐intensity (3 to 5.9 METs), and vigorous‐intensity (≥6 METs) activities.20 Insufficient physical activity was defined as <150 minutes of light‐ or moderate‐intensity exercise/week and <75 minutes of vigorous‐intensity exercise/week.21 Current smokers were defined as individuals who smoked a cigarette and/or a water pipe in the previous 12 months and those who had quit within the past year. Participants who had quit more than a year earlier were considered former smokers.22 For those who previously smoked, cumulative dosing of cigarettes was calculated as the average number of daily packs multiplied by the corresponding duration of smoking (pack × years), while that of water pipe was calculated as the mean number of weekly water pipes multiplied by the duration of smoking (water pipe × years).23
2.7. Statistical analysis
The questionnaires were reviewed and double checked for consistency, accuracy, and clearness by two independent observers; an additional audit was performed on a randomized 5% of the collected data sheets. To adjust for the Lebanese population, the prevalence rate of hypertension was age, sex, and dwelling region (adjusted based on the figures published by the Lebanese Ministry of Social Affairs and the Central Administration of Statistics).24 Cluster effect was taken into account, according to the method described by Rumeau‐Rouquette et al25 Initially, descriptive analysis was performed using counts and percentages or mean ± standard deviation (SD). Bivariate analysis was then carried out to compare the variables in men and women and in individuals with and without hypertension, stratified by sex. For categorical variables, we used the Pearson's Chi‐squared or Fisher's exact tests when applicable. Continuous quantitative variables were analyzed using student (independent) T‐test and Mann‐Whitney test when normal or abnormal distribution was assumed, respectively. Age‐adjusted odds ratios (ORa) were calculated along with 95% confidence interval (CI). Multivariable analysis was performed using a backward stepwise likelihood ratio logistic regression for the whole sample and for each gender; ORa were presented. In addition to age and area of residence, the independent factors included, socioeconomic status (SES) characteristics (marital status, education, income, working status), lifestyle factors (BMI, physical activity, alcohol consumption, smoking, and dietary status using the LMDS), psychological factors using the BDS‐22, and known cardiovascular risk factors (diabetes, history of CVD). Using the General Linear Model, unadjusted and adjusted mean systolic BP were studied across the different categories of selected variables (such as BMI categories, LMDS and BDS quartiles score); the model was adjusted for age and the use of BP‐lowering medications. Valid 2‐sided P‐values were reported, P < .05 was considered statistically significant. All analyses were done using SPSS, version 21.0.
3. RESULTS
3.1. Baseline characteristics and prevalence of HTN
The baseline characteristics and BP parameters of the study population are summarized in Tables 1 and 2, respectively. The prevalence of HTN was 31.2% (95% CI, 29.2% to 33.3%). The prevalence, treatment, and control of HTN are described in Figure 1; among the 628 individuals with hypertension, 255 (40.5%) were not treated, while 374 (59.5%) reported current use of BP‐lowering medications. Of the treated participants, 180 (48.2%) had their BP under control, however, this accounts for an overall 28.7% control rate when all hypertensive patients were considered. Men were more likely to have hypertension and an uncontrolled BP compared to women (P value for both <.001).
Table 1.
Baseline characteristics of the study population
| Characteristic | All | Men | Women |
|---|---|---|---|
| Number | 2014 | 976 (48.5%) | 1038 (51.5%) |
| Age (y) | 41.3 (17.0) [20‐97] | 41.1 (16.8) [20‐93] | 41.5 (17.1) [20‐97] |
| BMI (Kg/m2) | 26.8 (4.9) [14.7‐66.6] | 27.6 (4.6) [14.7‐45.0] | 26.1 (5.2) [16.0‐66.6] |
| Waist circumference (cm) | 92.4 (17.1) [32‐198] | 97.3 (15.3) [39‐198] | 87.7 (17.4) [32‐198] |
| Working status | |||
| No | 681 (33.9) | 150 (15.4) | 531 (51.2) |
| Yes | 1239 (61.6) | 755 (77.6) | 484 (46.7) |
| Retired | 90 (4.5) | 68 (7.0) | 22 (2.1) |
| Marital status | |||
| Single | 785 (39.3) | 414 (42.5) | 371 (36.2) |
| Married | 1085 (54.3) | 528 (54.3) | 557 (54.3) |
| Widowed/divorced | 129 (6.5) | 31 (3.2) | 98 (9.6) |
| Educational level | |||
| Primary‐complementary | 657 (32.8) | 304 (31.3) | 353 (34.2) |
| Secondary | 427 (21.3) | 210 (22.1) | 216 (21.0) |
| University and higher | 917 (45.8) | 450 (47.3) | 462 (44.8) |
| Income of the house/mo | |||
| More than 2 000 000 LBP | 584 (31.2) | 326 (35.9) | 258 (26.9) |
| 1 000 000‐2 000 000 LBP | 512 (27.4) | 252 (27.7) | 260 (27.1) |
| 500 000‐1 000 000 LBP | 529 (28.3) | 232 (25.5) | 297 (31.0) |
| <500 000 LBP | 243 (13.0) | 99 (10.9) | 144 (15.0) |
| Region type | |||
| Urban | 1007 (52.5) | 504 (54.6) | 503 (50.6) |
| Rural | 910 (47.5) | 419 (45.4) | 491 (49.4) |
| Smoking status | |||
| Never smoker | 859 (42.7) | 303 (31.0) | 556 (53.6) |
| Current smoker | 1006 (50.0) | 595 (61.0) | 411 (39.6) |
| Previous smoker | 149 (7.4) | 78 (8.0) | 71 (6.8) |
| Alcohol consumption | |||
| No consumption | 1105 (58.3) | 413 (44.8) | 692 (71.0) |
| Occasional | 712 (37.6) | 436 (47.3) | 276 (28.3) |
| Everyday | 79 (4.2%) | 73 (7.9) | 6 (0.6) |
| Quantifying the level of PA | |||
| No regular activity | 1356 (67.4) | 623 (63.8) | 733 (70.7) |
| Light‐ Moderate intensity (MET ≤6) | 409 (20.3) | 175 (17.9) | 234 (22.6) |
| Vigorous intensity (MET >6) | 248 (12.3) | 178 (18.2) | 70 (6.8) |
| Physically active | 466 (23.9) | 261 (27.9) | 205 (20.3) |
| LMDS | 30.9 (4.6) [15‐49] | 30.5 (4.7) [15‐49] | 31.4 (4.4) [18‐47] |
| BDS‐22 | 32.6 (11.1) [1‐66] | 31.3 (10.8) [2‐66] | 33.8 (11.3) [1‐66] |
BDS‐22, Beirut distress scale; BMI, body mass index (Kg/m2); LBP, Lebanese pounds; LMDS, Lebanese Mediterranean diet score; MET, metabolic equivalent; PA, physical activity; SD, standard deviation.
Data are mean (SD) [Minimum‐Maximum] for quantitative variables or percent for categorical.
Table 2.
BP parameters and use of anti HTN medications
| Characteristic | All | Men | Women | P value |
|---|---|---|---|---|
| Number | 2014 | 976 (48.5%) | 1038 (51.5%) | |
| SBP | 120.9 (18.1) [78‐220] | 125.7 (16.1) [78‐220] | 116.3 (18.6) [78‐205] | <.001 |
| DBP | 75.7 (11.4) [50‐127] | 77.5 (11.1) [50‐127] | 74.0 (11.3) [50‐123.5] | <.001 |
| MAP | 90.8 (12.3) [60‐144.7] | 93.6 (11.5) [65‐144.7] | 88.1 (12.5) [60‐142.8] | <.001 |
| PP | 45.2 (13.8) [10‐130] | 48.3 (13.1) [18‐130] | 42.3 (13.8) [10‐110.5] | <.001 |
| HR | 80.2 (13.8) [30‐200] | 79.9 (13.3) [30‐170] | 80.6 (14.3) [36‐200] | .263 |
| Type of anti‐HTN medication | 373 | 182 (48.8) | 191 (51.2) | |
| ACE inhibitor | 55 (17.1) | 28 (17.8) | 27 (16.5) | .745 |
| ARB | 107 (33.2) | 62 (39.2) | 45 (27.4) | .025 |
| Thiazide diuretica | 72 (22.4) | 32 (20.3) | 40 (24.4) | .373 |
| CCB | 78 (24.3) | 34 (21.7) | 44 (26.8) | .280 |
| BB | 165 (51.4) | 66 (42.0) | 99 (60.4) | .001 |
| Diureticsb | 22 (6.8) | 10 (6.3) | 12 (7.3) | .725 |
ACE, angiotensin converting enzyme; ARB, angiotensin receptor blocker; BB, beta blockers; CCB, Calcium channel blocker (including dihydropiridine [DHP] and non‐DHP's); DBP, diastolic blood pressure; HTN, hypertension; MAP, mean arterial pressure; PP, pulse pressure; SBP, systolic blood pressure; SD, standard deviation.
Data are mean (SD) [Minimum‐Maximum] for quantitative variables or percent for categorical.
Thiazide diuretic including: hydrochlorothiazide, chlorthalidone and indapamide.
Diuretics including: loop, potassium sparing and aldosterone antagonists.
Figure 1.
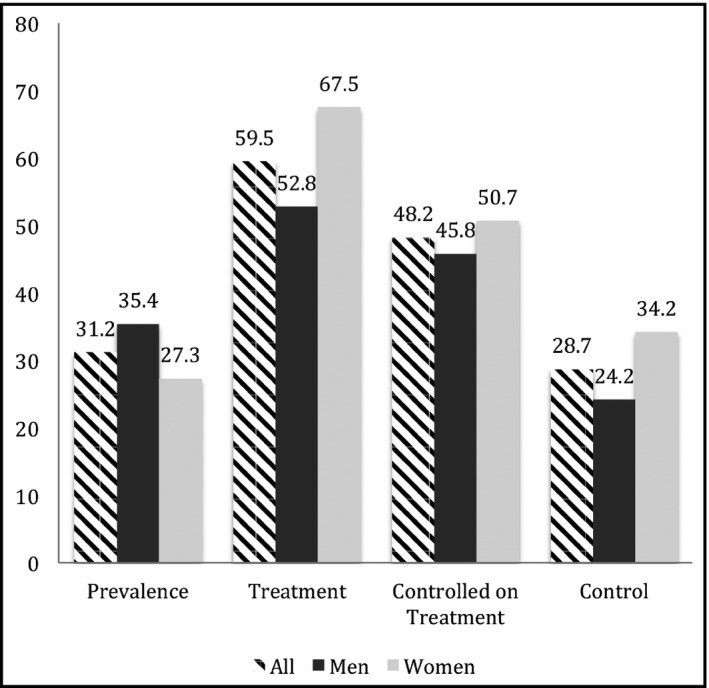
Hypertension prevalence, treatment, and control among men and women
Among treated individuals, the mean ± SD number was 1.6 ± 0.7 medications; 183 (57.0%) were taking monotherapy, 102 (31.8%) bi‐therapy, and 34 (11.2%) 3 or 4 drugs. Table 2 presents the agents used (the total percentage is higher than 100 because a patient may be using one or more drug) with beta‐blockers as the most commonly used medications (51.4%), followed by angiotensin receptor blockers (33.2%).
3.2. Nutritional and psychological aspect
Components of the LMDS are presented in Table S1 and were compared in hypertensive and non‐hypertensive individuals. Detrimental components, such as fast food, fried food, meat, and sweets were consumed less frequently in hypertensive individuals than in non‐hypertensive. This resulted in a higher mean ± SD detrimental score of 13.4 ± 2.6 compared to 12.1 ± 2.7 in non‐hypertensive individuals (P < .001), suggesting that those with hypertension were more adherent to the LMD. Beneficial components, such as olive oil, white bread, whole grain bread, cooked vegetables, and fruits were consumed more frequently by those with hypertension (P trend for all, P < .05). The beneficial score was similar in both groups (P > .05; data not tabulated). The overall LMD score is discussed in the gender‐stratified analysis.
Age and sex‐adjusted multivariable logistic regression of all components of the LMDS found a significant negative relationship with the consumption of olive oil and vegetable intake and a positive association with white bread (all P < .05).
Components of the BDS‐22 score were compared in both groups. Patients with HTN were more likely to exhibit more distress in 13 of the 22 items such as: feeling more despaired, empty, on the edge, etc. (P < .05).
3.3. Association between risk factors and HTN
Results of the gender‐stratified analysis comparing studied factors in hypertension and non‐hypertension groups are presented in Tables 3 and 4. Large differences in age between both groups were found and accordingly, age‐adjusted ORs are presented along with 95% CI. Overall, HTN was more prevalent in men (ORa = 1.459, 95% CI = 1.207‐1.763). In both sexes, HTN was more common with increasing BMI (P < .001) and in those with a lower range income than 2 000 000 Lebanese pounds (1333 USD). In females, HTN was more prevalent in those living in a rural area (P < .01), while it was less prevalent in working individuals (P = .01) and in those with a higher level of education (P = .001). In males, HTN was prevalent in married vs single individuals (P < .05).
Table 3.
Females’ characteristics in individuals with and without HTN
| Characteristic | Patients with HTN | Patients without HTN | P value | Age adjusted OR (95% CI) | P value |
|---|---|---|---|---|---|
| Number | 283 (27.3%) | 754 (72.7%) | |||
| Age (y) | 57.3 (17.2) [20‐97] | 35.6 (12.8) [20‐89] | * | 1.090 (1.078‐1.102) | <.001 |
| SBP | 135.4 (18.4) [85‐205] | 109.1 (12.6) [78‐139] | * | 1.101 (1.084‐1.118) | <.001 |
| DBP | 83.2 (12.4) [50‐123.5] | 70.6 (8.6) [50‐89] | * | 1.136 (1.112‐1.161) | <.001 |
| MAP | 100.6 (12.3) [66.7‐142.8] | 83.4 (8.9) [60‐103.7] | * | 1.165 (1.137‐1.194) | <.001 |
| PP | 52.2 (17.0) [10‐110.5] | 38.5 (10.2) [16‐80] | * | 1.049 (1.034‐1.063) | <.001 |
| HR | 78.5 (12.5) [44‐164] | 81.4 (14.8) [36‐200] | ** | 1.005 (0.993‐1.016) | .447 |
| Waist circumference (cm) | 95.7 (17.7) [36‐198] | 84.7 (16.3) [32‐189] | * | 1.017 (1.007‐1.027) | <.001 |
| BMI (Kg/m2) | 29.2 (6.0) [16‐66.6] | 25.0 (4.3) [16‐45.1] | * | 1.103 (1.066‐1.141) | <.001 |
| BMI categories | * | ||||
| Normal | 67 (24.1) | 416 (55.5) | 1 | <.001 | |
| Overweight | 100 (36.0) | 230 (30.7) | 1.513 (1.003‐2.281) | .048 | |
| Obese | 111 (39.9) | 104 (13.9) | 2.959 (1.913‐4.577) | <.001 | |
| Working status | * | ||||
| No | 200 (70.4) | 331 (44.0) | 1 | .008 | |
| Yes | 68 (23.9) | 416 (55.2) | 0.568 (0.395‐0.816) | .002 | |
| Retired | 16 (5.6) | 6 (0.8) | 1.117 (0.405‐3.083) | .831 | |
| Marital status | * | ||||
| Single | 50 (17.8) | 320 (43.0) | 1 | .382 | |
| Married | 172 (61.2) | 385 (51.7) | 0.988 (0.648‐1.509) | ||
| Widowed/divorced | 59 (21.0) | 39 (5.2) | 1.452 (0.761‐2.771) | ||
| Educational level | * | ||||
| Primary‐complementary | 171 (61.5) | 182 (24.2) | 1 | .003 | |
| Secondary | 62 (22.3) | 154 (20.5) | 0.752 (0.496‐1.140) | .179 | |
| University and higher | 45 (16.2) | 417 (55.4) | 0.458 (0.293‐0.718) | .001 | |
| Income of the house/mo in LBP | * | ||||
| More than 2 000 000 | 36 (14.1) | 222 (31.5) | 1 | .001 | |
| 1 000 000‐2 000 000 | 68 (26.7) | 192 (27.3) | 2.591 (1.154‐5.819) | .021 | |
| 500 000‐1 000 000 | 78 (30.6) | 219 (31.1) | 2.830 (1.265‐6.329) | .011 | |
| <500 000 | 73 (28.6) | 71 (10.1) | 4.634 (1.967‐10.917) <0.001 | ||
| Region type | *** | ||||
| Urban | 122 (45.4) | 381 (52.6) | 1 | ||
| Rural | 147 (54.6) | 344 (47.4) | 1.578 (1.117‐2.231) | .010 | |
| Smoking status | * | ||||
| Never smoker | 153 (54.1) | 403 (53.4) | 1 | .724 | |
| Current smoker | 97 (34.3) | 314 (41.6) | 0.869 (0.611‐1.236) | ||
| Previous smoker | 33 (11.7) | 38 (5.0) | 0.999 (0.531‐1.879) | ||
| Cigarette smoking | ** | ||||
| Non‐current smokera | 218 (78.4) | 601 (82.6) | 1 | .422 | |
| 0.1‐14.9 cig‐pack‐years | 21 (7.6) | 74 (10.2) | 0.637 (0.360‐1.126) | ||
| 15‐29.9 cig‐pack‐years | 16 (5.8) | 27 (3.7) | 0.751 (0.361‐1.563) | ||
| ≥30 cig‐pack‐years | 23 (8.3) | 26 (3.6) | 0.888 (0.455‐1.733) | ||
| Water pipe smoking | * | ||||
| Non‐current smokera | 245 (90.7) | 573 (80.0) | 1 | .799 | |
| 0.1‐19.9 WP‐years | 8 (3.0) | 65 (9.1) | 0.890 (0.396‐2.001) | ||
| 20‐39.9 WP‐years | 5 (1.9) | 36 (5.0) | 0.879 (0.277‐2.789) | ||
| ≥40 WP‐years | 12 (4.4) | 42 (5.9) | 1.420 (0.665‐3.033) | ||
| Alcohol consumption | NS | ||||
| No consumption | 194 (73.2) | 498 (70.2) | 1 | .690 | |
| Occasional | 70 (26.5) | 206 (29.1) | 0.930 (0.635‐1.364) | ||
| Everyday | 1 (0.4) | 5 (0.7) | 0.321 (0.019‐5.356) | ||
| Level of PA | * | ||||
| No regular activity | 220 (77.5) | 514 (68.1) | 1 | .008 | |
| Light‐moderate (MET ≤6) | 62 (21.8) | 172 (22.8) | 0.678 (0.455‐1.009) | .055 | |
| Vigorous (MET >6) | 2 (0.7) | 69 (9.1) | 0.127 (0.026‐0.619) | .011 | |
| Physically active | 40 (14.5) | 165 (22.4) | ** | 0.412 (0.261‐0.651) | <.001 |
| Random blood sugar | 126.1 (48.7) [76‐424] | 105.8 (26.6) [46‐494] | * | 1.008 (1.003‐1.013) | .002 |
| LMDS | 32.0 (4.9) [19‐46] | 31.2 (4.2) [18‐47] | NS | 0.978 (0.936‐1.023) | .339 |
| BDS‐22 | 35.7 (12.5) [11‐66] | 33.1 (10.7) [1‐66] | ** | 1.009 (0.994‐1.024) | .256 |
| FH of premature CHD | 20 (7.2) | 77 (10.5) | NS | 0.651 (0.362‐1.171) | .152 |
| Diabetes | 104 (36.7) | 53 (7.0) | * | 3.451 (2.244‐5.307) | <.001 |
| Any CVD | 55 (19.4) | 33 (4.4) | * | 4.077 (2.306‐7.208) | <.001 |
| Hypercholesterolemia | 109 (38.5) | 81 (10.8) | * | 2.976 (2.011‐4.405) | <.001 |
| Hypertriglyceridemia | 62 (22.5) | 34 (4.6) | * | 3.094 (1.854‐5.164) | <.001 |
| Rated health score | 6.6 (1.9) [0‐10] | 7.8 (1.7) [0‐10] | * | 0.781 (0.707‐0.863) | <.001 |
BDS‐22, Beirut Distress Scale; BMI, Body mass index (Kg/m2); CHD, Coronary heart disease; CVD, Cardiovascular disease (including patients with CHD and cerebrovascular accident); DBP, diastolic blood pressure; HTN, hypertension; LBP, Lebanese pounds; LMDS, Lebanese Mediterranean diet score; MAP, mean arterial pressure; MET, metabolic equivalent; PA, physical activity; PP, pulse pressure; SBP, systolic blood pressure; SD, standard deviation; WP, waterpipe.
Data are mean (SD) [Min‐Max] for quantitative variables or percent for categorical. *≤.001, **≤.01, ***≤.05, NS (Non significant) >.05.
Previous smokers were considered non‐smokers.
Table 4.
Males’ characteristics in individuals with and without HTN
| Characteristic | Patients with HTN | Patients without HTN | P value | Age adjusted OR (95% CI) | P value |
|---|---|---|---|---|---|
| Number | 345 (35.4) | 630 (64.6%) | |||
| Age (y) | 51.3 (17.7) [20‐91] | 35.5 (13.4) [20‐93] | * | 1.064 (1.054‐1.074) | <.001 |
| SBP | 138.8 (16.4) [86‐220] | 118.6 (10.4) [78‐139] | * | 1.133 (1.112‐1.154) | <.001 |
| DBP | 84.8 (12.4) [50‐127] | 73.5 (7.9) [50‐89.5] | * | 1.136 (1.114‐1.158) | <.001 |
| MAP | 102.8 (11.6) [65‐144.7] | 88.5 (7.6) [66‐105.3] | * | 1.185 (1.157‐1.214) | <.001 |
| PP | 54.0 (16.1) [20‐130] | 45.1 (9.8) [18‐70] | * | 1.044 (1.031‐1.058) | <.001 |
| HR | 79.7 (13.1) [48‐156] | 80.0 (13.4) [30‐170] | NS | 1.007 (0.995‐1.018) | .240 |
| Waist circumference (cm) | 101.5 (16.5) [41‐198] | 95.0 (14.2) [39‐180] | * | 1.028 (1.017‐1.038) | <.001 |
| BMI (Kg/m2) | 29.0 (5.0) [14.7‐45] | 26.8 (4.2) [17.3‐45] | * | 1.118 (1.082‐1.156) | <.001 |
| BMI categories | * | ||||
| Normal | 68 (19.9) | 230 (36.6) | 1 | <.001 | |
| Overweight | 140 (41.1) | 284 (45.2) | 1.374 (0.937‐2.013) | .103 | |
| Obese | 133 (39.0) | 115 (18.3) | 3.793 (2.506‐5.740) | <.001 | |
| Working status | * | ||||
| No | 47 (13.6) | 103 (16.4) | 1 | .576 | |
| Yes | 248 (71.9) | 507 (80.7) | 0.937 (0.601‐1.461) | ||
| Retired | 50 (14.5) | 18 (2.9) | 1.307 (0.619‐2.758) | ||
| Marital status | * | ||||
| Single | 72 (20.9) | 342 (54.4) | 1 | .020 | |
| Married | 259 (75.3) | 269 (42.8) | 1.556 (1.062‐2.280) | .023 | |
| Widowed/divorced | 13 (3.8) | 18 (2.9) | 0.761 (0.314‐1.843) | .544 | |
| Educational level | * | ||||
| Primary‐complementary | 152 (44.3) | 153 (24.4) | 1 | .582 | |
| Secondary | 74 (21.6) | 137 (21.8) | 1.017 (0.678‐1.525) | ||
| University and higher | 117 (34.1) | 338 (53.8) | 0.854 (0.593‐1.230) | ||
| Income of the house/mo in LBP | ** | ||||
| More than 2 000 000 | 96 (29.1) | 230 (39.8) | 1 | .006 | |
| 1 000 000‐2 000 000 | 109 (33.0) | 143 (24.7) | 2.200 (1.302‐3.716) | .032 | |
| 500 000‐1 000 000 | 91 (27.6) | 140 (24.2) | 1.794 (1.052‐3.059) | .003 | |
| <500 000 | 34 (10.3) | 65 (11.2) | 0.950 (0.484‐1.863) | .184 | |
| Region type | NS | ||||
| Urban | 171 (51.5) | 334 (56.4) | 1 | .112 | |
| Rural | 161 (48.5) | 258 (43.6) | 1.278 (0.944‐1.731) | ||
| Smoking status | * | ||||
| Never smoker | 116 (33.5) | 187 (29.6) | 1 | .108 | |
| Current smoker | 185 (53.5) | 411 (65.1) | 0.709 (0.513‐0.979) | ||
| Previous smoker | 45 (13.0) | 33 (5.2) | 0.859 (0.473‐1.558) | ||
| Cigarette smoking | *** | ||||
| Non‐current smokera | 207 (62.7) | 372 (63.4) | 1 | .582 | |
| 0.1‐14.9 cig‐pack‐years | 39 (11.8) | 102 (17.4) | 0.967 (0.614‐1.522) | ||
| 15‐29.9 cig‐pack‐years | 26 (7.9) | 46 (7.8) | 0.923 (0.525‐1.622) | ||
| ≥30 cig‐pack‐years | 58 (17.6) | 67 (11.4) | 0.732 (0.473‐1.135) | ||
| Water pipe smoking | ** | ||||
| Non‐current smokera | 273 (83.0) | 422 (73.6) | 1 | .669 | |
| 0.1‐19.9 WP‐years | 22 (6.7) | 77 (13.4) | 0.728 (0.427‐1.241) | ||
| 20‐39.9 WP‐years | 9 (2.7) | 18 (3.1) | 1.072 (0.449‐2.562) | ||
| ≥40 WP‐years | 25 (7.6) | 56 (9.8) | 1.070 (0.624‐1.834) | ||
| Alcohol consumption | * | ||||
| No consumption | 171 (52.6) | 242 (40.5) | 1 | <.001 | |
| Occasional | 132 (40.6) | 304 (50.9) | 0.519 (0.376‐0.717) | <.001 | |
| Everyday | 22 (6.8) | 51 (8.5) | 0.655 (0.349‐1.229) | .187 | |
| Level of PA | * | ||||
| No regular activity | 224 (64.9) | 398 (63.2) | 1 | .001 | |
| Light‐moderate (MET ≤6) | 97 (28.1) | 78 (12.4) | 1.495 (1.028‐2.174) | .035 | |
| Vigorous (MET >6) | 24 (7.0) | 154 (24.4) | 0.502 (0.309‐0.816) | .005 | |
| Physically active | 84 (25.1) | 177 (29.4) | NS | 0.808 (0.575‐1.137) | .221 |
| Random blood sugar | 125.8 (50.3) [61‐583] | 115.9 (39.6) [70‐369] | ** | 0.999 (0.996‐1.002) | .519 |
| LMDS | 31.7 (4.3) [21‐43] | 29.9 (4.8) [15‐49] | * | 0.969 (0.932‐1.008) | .113 |
| BDS‐22 | 32.1 (10.7) [2‐66] | 30.9 (10.8) [2‐66] | NS | 1.009 (0.995‐1.023) | .221 |
| FH of premature CHD | 35 (10.5) | 47 (7.6) | NS | 1.548 (0.941‐2.548) | .085 |
| Diabetes | 97 (28.1) | 84 (13.3) | * | 1.167 (0.802‐1.699) | .420 |
| Any CVD | 83 (24.1) | 35 (5.5) | * | 2.711 (1.692‐4.343) | <.001 |
| Hypercholesterolemia | 99 (28.7) | 55 (8.7) | * | 2.027 (1.355‐3.031) | .001 |
| Hypertriglyceridemia | 74 (22.1) | 40 (6.4) | * | 2.390 (1.529‐3.734) | <.001 |
| Rated health score | 7.4 (1.9) [0‐10] | 8.3 (1.5) [0‐10] | * | 0.862 (0.786‐0.945) | .002 |
BDS‐22, Beirut Distress Scale; BMI, body mass index (Kg/m2); CHD, coronary heart disease; CVD, cardiovascular disease (including patients with CHD and cerebrovascular accident); DBP, diastolic blood pressure; HTN, hypertension; LBP, Lebanese pounds; LMDS, Lebanese Mediterranean diet score; MAP, mean arterial pressure; MET, metabolic equivalent; PA, physical activity; PP, pulse pressure; SBP, systolic blood pressure; SD, standard deviation; WP, waterpipe.
Data are mean (SD) [Min‐Max] for quantitative variables or percent for categorical. *≤.001, **≤.01, ***≤.05, NS (Non‐significant) >.05.
Previous smokers were considered non‐smokers.
Regarding lifestyle behaviors, in both females and males, HTN was less seen in those with “vigorous intensity” physical activities compared to no activity (P trend <.05) and in women who are physically active versus those who are not (ORa 0.412; P < .001).
Among biologic risk factors and in both sexes, HTN was more common in individuals with hypertriglyceridemia and hypercholesterolemia. Previous CVD was also a common predictor of HTN as well as an overall lower self‐rated mean ± SD health score. Diabetes was associated with HTN in women.
There was no statistically significant difference with regards to dietary compliance (LMDS) and psychological distress (BDS‐22) and the development of HTN (Tables 3 and 4; P > .05). However, when evaluating the relationship between LMDS and SBP in a model adjusted to age and use of BP‐lowering medication, women had significantly lower adjusted SBP values in the higher quartiles (P = .003), suggesting that compliance with the Lebanese Mediterranean diet may be associated with a lower SBP level (Figure 2A), but in men we found an insignificant adjusted lower SBP. There was no relationship between BDS‐22 and SBP in both men and women (Figure 2B). Last, SBP significantly increased in both men and women among different and ascending BMI categories (Figure 2C; P for trend <.01).
Figure 2.
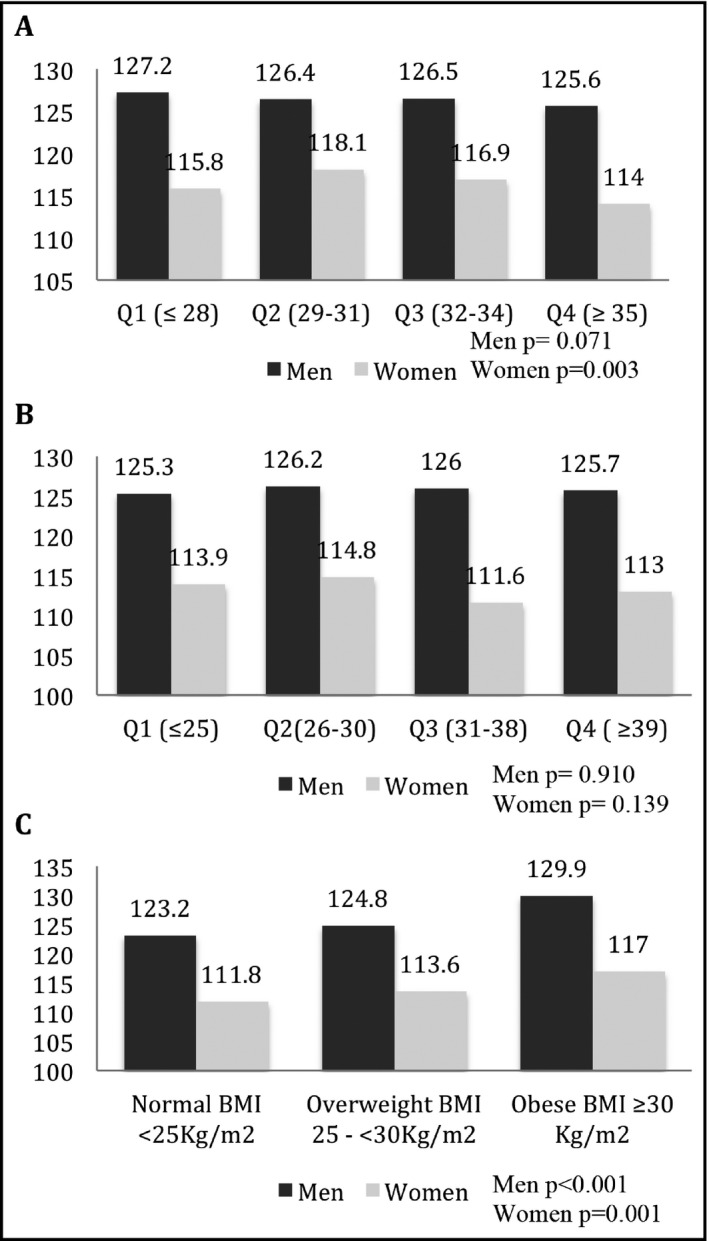
Adjusted mean SBP among studied factors (A) Adjusted mean SBP according to dietary adherence by LMDS quartiles. (B) Adjusted mean SBP according to psychological stress by BDS‐22 quartiles. (C) Adjusted mean SBP among body mass index categories. BDS‐22, Beirut distress score; LMDS, Lebanese Mediterranean diet score; SBP, Systolic blood pressure. Model: adjusted for age and use of anti‐hypertensive medications
3.4. Multivariable analysis
Table 5 presents the results of the multivariable logistic regression analysis that accounts for potential confounding factors. HTN increased with increasing age, BMI, and presence of previous CVD in both men and women, and was higher in married men and in women with diabetes. On the other hand, HTN decreased in men with occasional alcohol consumption and in women with higher education and physical activity.
Table 5.
Multivariable logistic regression analysis: adjusted relationship between HTN and its risk factors
| Independent variables in logistic regression model | Exp B | 95% CI | P value |
|---|---|---|---|
| Dependent variable is HTN | |||
| In males | |||
| Age, y | 1.047 | 1.033‐1.061 | <.001 |
| BMI, Kg/m2 | 1.118 | 1.077‐1.161 | <.001 |
| Occasional alcohol vs none | 0.634 | 0.432‐0.849 | .014 |
| Married vs single | 1.568 | 1.023‐2.405 | .039 |
| Previous CVD | 3.115 | 1.750‐5.545 | <.001 |
| In females | |||
| Age, y | 1.073 | 1.056‐1.090 | <.001 |
| BMI, Kg/m2 | 1.079 | 1.030‐1.131 | .001 |
| University or higher education | 0.513 | 0.289‐0.885 | .018 |
| Physically active | 0.478 | 0.273‐0.837 | .010 |
| Diabetes | 2.427 | 1.381‐4.265 | .002 |
| Previous CVD | 5.015 | 2.139‐11.759 | <.001 |
BMI, body mass index; CVD, cardiovascular disease.
4. DISCUSSION
Our findings show that, in Lebanon, the prevalence of HTN and poor BP control reached epidemic proportions comparable to the highest worldwide percentages. In both sexes, HTN prevalence increased with increasing age and BMI, and in the presence of previous CVD. In addition, in women there was an association between HTN and diabetes, educational level, and physical activity. While in men it was seen with alcohol consumption and marital status.
4.1. Prevalence and control of HTN
The prevalence and control of HTN were 31.2% and 28.7%, respectively, and were similar to the rates of 35.9% and 27% described from a previous study.10 A lower prevalence rate can be caused by differences in the study design of both studies. Nevertheless, this little inter‐country variation strengthens the accuracy of our results, represents the most up‐to‐date national data on HTN, and stresses that public health policies should be implemented in Lebanon in an effort to reduce the clinical implications of HTN. Our study was also in accordance with data from Arab countries, where a recent review found that the overall estimated prevalence of HTN was of 29.5% and highlighted a low level of optimal BP control.5 Despite the fact that worldwide guidelines recommend beta‐blockers as first‐line in patients with CHD,7 half of the hypertensive participants received beta‐blocker medications while less than one‐third had compelling indications for their use. This demonstrates the persistent and extensive use of beta‐blockers for the treatment of hypertension.10
4.2. Risk factors of HTN
4.2.1. BMI
We found that a higher BMI was significantly and positively related to an increase in the prevalence of HTN. This association has been discussed in previous studies with recent prospective data revealing that obesity is linked with incident HTN.26 Results of our study further ascertain the association between BMI and HTN; BMI persisted as a main causative modifiable factor in the HTN multivariable model in both sexes. Furthermore, an increase in the SBP was seen across BMI categories, underlining the influence of BMI on SBP variability. These findings further suggest that weight management and maintaining a healthy BMI should be emphasized for the primary prevention of HTN and in an effort to improve BP control in treated hypertensives.
4.2.2. Alcohol consumption
Our study described that HTN decreased with occasional alcohol consumption in men only. Differences between men and women with regards to alcohol intake and the risk of developing hypertension have been seen elsewhere,27 and can be attributed to the differences in the pattern of drinking and beverage choice. In addition, we believe that alcohol was underreported in our study because of religious reasons, thus further influencing our observed gender difference.
4.2.3. Physical activity
We found an inverse association between physical activity (PA) and the prevalence of HTN in women. This protective association has been demonstrated abundantly in studies conducted on women only.28 Also, this relationship appears to be with vigorous intensity activity compared to a low‐to‐moderate activity. This association was not seen in men and could be explained by under reported occupational or leisure time PA as well as by differences in socioeconomic and cultural factors that could interfere with being physically active.29
4.2.4. Lebanese Mediterranean diet
Adherence to LMDS was associated with reduced changes in mean levels of SBP across higher quartiles of the LMDS in women only. This relationship was described in a recent meta‐analysis of 6 studies, where adopting a MD pattern for at least 1 year had reduced the SBP levels.30 In addition, discrepancies between sexes was found in the Nutrinet‐Sante study, reporting that in women only, adherence to French nutritional guidelines as well as to a MD and the DASH diet was inversely associated with BP levels.31 Since our results were adjusted to age and use of antihypertensive medications only, other confounding factors such as socioeconomic, BMI, and other behavioral factors may explain the difference found between men and women. Some data suggest that sex‐related characteristics such as the level of sex hormones may interact with the results.32 Future research is needed to clarify the long‐term role of the LMD on BP prevention and management.
4.2.5. Socioeconomic status factors
Level of education remained significantly and inversely associated with HTN in women only. The advantage of education as a measure of SES is that it can be reliably recalled and unaffected by later adult health. Education level was suggested as the most important SES factor with an impact on HTN,33 and data from studies conducted in many countries (United States, Jamaica, Korea, Austria) found this association in women only.34, 35, 36 Although the reasons for the gender‐related difference remain unclear, individuals with lower education may exhibit unhealthy dietary and lifestyle behaviors (smoking, exercise, and alcohol) as well as less psychological support, increasing the risk of HTN.35, 37 In addition, in Lebanon, cultural and social factors may influence education in women and subsequent employment; those with low education may have higher possibility of unemployment and poor health compared to men.38 Marital status was associated with hypertension and was observed in married men. This was also seen in a previous study in Lebanon10 and the gender difference can be attributed to the cultural and social factors mentioned above.
5. STUDY STRENGTHS AND LIMITATIONS
The main strength of our study was its design, adopting a population‐based approach, a nationally representative sample, and a random selection of participants. In addition, we used standardized protocols in the different measurements taken, including BP, as well as validated and well‐recognized questionnaires to gather demographic, socioeconomic, and behavioral and health‐related factors. We also used the BDS‐22, an instrument that proved to adequately correlate with well known and recognized scales, to measure psychological distress.20 Additionally, the LMD score was correlated with European MD scores and aligned closest to Italians, highlighting that the LMD is in adherence to a Middle Eastern version of the MD.39 Moreover, to our knowledge, this is the first study conducted in Lebanon that discusses the association between HTN and dietary and psychological factors, as well as highlight the divergent factors associated in men and women.
On the other hand, there were some limitations that must be addressed. First, given the cross‐sectional design of our study, it was difficult to establish a causal relationship between HTN and the studied factors. In fact, participants may have modified their lifestyle habits in response to raised BP, introducing a reverse‐causality bias. This study design may as well be susceptible to misclassification bias when relying on the participants to report risk factors; as a consequence, this may underestimate smoking status and psychological distress, influencing the lack of association between smoking and BDS‐22 on HTN and SBP. Second, current practice guidelines recommend that the diagnosis of HTN be based on at least 2 BP measurements per visit (which was done) and on at least 2 visits, which is not feasible in large population studies. Although this might influence the prevalence of HTN, this approach is supported and commonly adopted in epidemiological studies. Third, we did not follow the traditional epidemiologic description of prevalence, awareness, treatment, and control of hypertension, because the survey did not account for the awareness of hypertension in the population. Fourth, BDS‐22 measures overall psychological distress and we suggest that further research includes a number of instruments to measure different and multiple stress factors (environmental, psychological, and biological). Finally, the LMDS index is based on a nonquantitative food frequency questionnaire, making the components equally weighed and similarly scored from 0 to 4, giving all foods same effect on HTN and BP, which may not be true. In addition, we did not account for intake of salt and alcohol19 and were unable to take into account total energy intake. Nevertheless, this type of dietary index is simple and has been extensively used in previous epidemiological studies.
6. CONCLUSIONS
This study has shown that in Lebanon, HTN and poor BP control are highly prevalent. We also found that the risk factors of HTN were age, BMI, and previous CVD, with other factors marginally associated with HTN in both genders. In this respect, we consider that prevention of HTN at the population level should mainly focus on overweight prevention by emphasizing nutritional and physical activity policies. Last, results of our study provide public health agencies in Lebanon additional evidence of the burden of HTN in the country and should encourage them to develop national health programs focusing on improving the treatment and control of HTN in Lebanon.
CONFLICT OF INTEREST
The authors report no conflicts of interest to disclose.
Supporting information
ACKNOWLEDGMENTS
The Foundation‐Medical Research Institutes (F‐MRI®) thanks all of those who participated in the data collection of 100 circumscriptions and their implementation for this study, particularly those in isolated rural areas despite the political and security challenges. We also thank “Omron Healthcare” Lebanon for providing the BP machines Omron M6 Comfort and “Roche,” represented by “Omnipharma S.A.L” in Lebanon, for the Accu‐Chek Blood Glucose Meters with strips.
Cherfan M, Blacher J, Asmar R, et al. Prevalence and risk factors of hypertension: A nationwide cross‐sectional study in Lebanon. J Clin Hypertens. 2018;20:867–879. 10.1111/jch.13268
Funding information
The study was conducted in 60/100 circumscriptions as an independent study by the Foundation‐Medical Research Institutes (F‐MRI) as sole sponsor with its own human and technical support. This study was funded by a restricted grant from Novartis Pharma Services Inc., Lebanon.
REFERENCES
- 1. Lim SS, Vos T, Flaxman AD, et al. A comparative risk assessment of burden of disease and injury attributable to 67 risk factors and risk factor clusters in 21 regions, 1990‐2010: a systematic analysis for the Global Burden of Disease Study 2010. Lancet. 2013;380:2224‐2260. [DOI] [PMC free article] [PubMed] [Google Scholar]
- 2. World Health Organization . A global brief on Hypertension; silent killer, global public health crisis. http://apps.who.int/iris/bitstream/10665/79059/1/WHO_DCO_WHD_2013.2_eng.pdf; 2013. Updated April, 2013. Accessed July 15, 2013.
- 3. Centers for Disease Control and Prevention (CDC) . Vital signs: awareness and treatment of uncontrolled hypertension among adults–United States, 2003‐2010. MMWR Morb Mortal Wkly Rep. 2012;61:703‐709. [PubMed] [Google Scholar]
- 4. Wolf‐Maier K, Cooper RS, Kramer H, et al. Hypertension treatment and control in five European countries, Canada, and the United States. Hypertension. 2004;43:10‐17. [DOI] [PubMed] [Google Scholar]
- 5. Tailakh A, Evangelista LS, Mentes JC, et al. Hypertension prevalence, awareness, and control in Arab countries: a systematic review. Nurs Health Sci. 2014;16:126‐130. [DOI] [PMC free article] [PubMed] [Google Scholar]
- 6. Niskanen L, Laaksonen DE, Nyyssonen K, et al. Inflammation, abdominal obesity, and smoking as predictors of hypertension. Hypertension. 2004;44:859‐865. [DOI] [PubMed] [Google Scholar]
- 7. Mancia G, Fagard R, Narkiewicz K, et al. 2013 ESH/ESC Guidelines for the management of arterial hypertension. J Hypertens. 2013;31:1281‐1357. [DOI] [PubMed] [Google Scholar]
- 8. Hercberg S, Chat‐Yung S, Chauliac M. The French National Nutrition and Health Program: 2001–2006–2010. Int J Public Health. 2008;53:68‐77. [DOI] [PubMed] [Google Scholar]
- 9. The World Bank . http://data.worldbank.org/country/lebanon. Accessed March 13, 2014.
- 10. Matar D, Frangieh AH, Abouassi S, et al. Prevalence, awareness, treatment, and control of hypertension in Lebanon. J Clin Hypertens (Greenwich). 2015;17:381‐388. [DOI] [PMC free article] [PubMed] [Google Scholar]
- 11. Zeidan RK, Farah R, Chahine MN, et al. Prevalence and correlates of coronary heart disease: first population‐based study in Lebanon. Vasc Health Risk Manag. 2016;12:75‐84. [DOI] [PMC free article] [PubMed] [Google Scholar]
- 12. Central Administration of Statistics . Index of circumscriptions, villages, and cities in Lebanon. June 2005, Beirut, Lebanon. Available on www.cas.gov.lb Accessed September 2, 2013.
- 13. O'Brien E, Asmar R, Beilin L, et al. European Society of Hypertension recommendations for conventional, ambulatory and home blood pressure measurement. J Hypertens. 2003;21:821‐848. [DOI] [PubMed] [Google Scholar]
- 14. Qiao Q, Keinanen‐Kiukaanniemi S, Rajala U, et al. Random capillary whole blood glucose test as a screening test for diabetes mellitus in a middle‐aged population. Scand J Soc Med. 1995;55:3‐8. [DOI] [PubMed] [Google Scholar]
- 15. Stern MP, Williams K, Haffner SM. Identification of persons at high risk for type 2 diabetes mellitus: do we need the oral glucose tolerance test? Ann Intern Med. 2002;136:575‐581. [DOI] [PubMed] [Google Scholar]
- 16. Rose GA. The diagnosis of ischaemic heart pain and intermittent claudication in field surveys. Bull World Health Organ. 1962;27:645‐658. [PMC free article] [PubMed] [Google Scholar]
- 17. Piepoli MF, Hoes AW, Agewall S, et al. 2016 European Guidelines on cardiovascular disease prevention in clinical practice: the Sixth Joint Task Force of the European Society of Cardiology and other societies on cardiovascular disease prevention in clinical practice. Eur Heart J. 2016;37:2315‐2381. [DOI] [PMC free article] [PubMed] [Google Scholar]
- 18. Issa C, Jomaa L, Salamé J, et al. Females are more adherent to Lebanese Mediterranean diet than males among university students. Asian Pac J Health Sci. 2014;1:345‐353. [Google Scholar]
- 19. Barbour B, Saadeh N, Salameh PR. Psychological distress in Lebanese young adults: constructing the screening tool “BDS‐22”. Int J Cult Ment Health. 2012;5:94‐108. [Google Scholar]
- 20. Ainsworth BE, Haskell WL, Herrmann SD, et al. 2011 Compendium of physical activities: a second update of codes and MET values. Med Sci Sports Exerc. 2011;43:1575‐1581. [DOI] [PubMed] [Google Scholar]
- 21. World Health Organization . Global Recommendations on Physical Activity for Health. Geneva: World Health Organization. http://www.ncbi.nlm.nih.gov/books/NBK305057/. Updated 2010. Accessed September 20, 2015. [Google Scholar]
- 22. McGorrian C, Yusuf S, Islam S, et al. Estimating modifiable coronary heart disease risk in multiple regions of the world: the INTERHEART Modifiable Risk Score. Eur Heart J. 2011;32:581‐589. [DOI] [PubMed] [Google Scholar]
- 23. Joseph S, Pascale S, Georges K, et al. Cigarette and water pipe smoking decrease respiratory quality of life in adults: results from a national cross‐sectional study. Pulm Med. 2012;2012:868294. [DOI] [PMC free article] [PubMed] [Google Scholar]
- 24. Central Administration of Statistics, Ministry of Social Affairs . Population. http://www.cas.gov.lb/index.php/demographic-and-social-en/population-en. Updated 2009. Accessed August 31, 2016.
- 25. Rumeau‐Rouquette C, Breart G, Padieu R. Methods in Epidemiology: Sampling, Investigations, and Analysis. Paris, France: Flammarion; 1985:71‐82. [Google Scholar]
- 26. Shuger SL, Sui X, Church TS, et al. Body mass index as a predictor of hypertension incidence among initially healthy normotensive women. Am J Hypertens. 2008;21:613‐619. [DOI] [PMC free article] [PubMed] [Google Scholar]
- 27. Sesso HD, Cook NR, Buring JE, et al. Alcohol consumption and the risk of hypertension in women and men. Hypertension. 2008;51:1080‐1087. [DOI] [PubMed] [Google Scholar]
- 28. Pavey TG, Peeters G, Bauman AE, et al. Does vigorous physical activity provide additional benefits beyond those of moderate? Med Sci Sports Exerc. 2013;45:1948‐1955. [DOI] [PubMed] [Google Scholar]
- 29. Azevedo MR, PavinAraújo CL, Reichert FF, et al. Gender differences in leisure‐time physical activity. Int J Public Health. 2007;52:8‐15. [DOI] [PMC free article] [PubMed] [Google Scholar]
- 30. Nissensohn M, Román‐Viñas B, Sánchez‐Villegas A, et al. The effect of the Mediterranean diet on hypertension: a systematic review and meta‐analysis. J Nutr Educ Behav. 2016;48:e1. [DOI] [PubMed] [Google Scholar]
- 31. Lelong H, Blacher J, Menai M, et al. Association between blood pressure and adherence to French dietary guidelines. Am J Hypertens. 2016;29:948‐958. [DOI] [PubMed] [Google Scholar]
- 32. Leblanc V, Hudon AM, Royer MM, et al. Differences between men and women in dietary intakes and metabolic profile in response to a 12‐week nutritional intervention promoting the Mediterranean diet. J Nutr Sci. 2015;4:e13. [DOI] [PMC free article] [PubMed] [Google Scholar]
- 33. Vargas CM, Ingram DD, Gillum RF. Incidence of hypertension and educational attainment: the NHANES I epidemiologic followup study. First National Health and Nutrition Examination Survey. Am J Epidemiol. 2000;152:272‐278. [DOI] [PubMed] [Google Scholar]
- 34. Bidulescu A, Ferguson TS, Hambleton I, et al. Educational health disparities in hypertension and diabetes mellitus among African descent populations in the Caribbean and the USA: a comparative analysis from the Spanish town cohort (Jamaica) and the Jackson heart study (USA). Int J Equity Health. 2017;16:33‐43. [DOI] [PMC free article] [PubMed] [Google Scholar]
- 35. Baek TH, Lee HY, Lim NK, et al. Gender differences in the association between socioeconomic status and hypertension incidence: the Korean Genome and Epidemiology Study (KoGES). BMC Public Health. 2015;15:852‐859. [DOI] [PMC free article] [PubMed] [Google Scholar]
- 36. Kautzky‐Willer A, Dorner T, Jensby A, et al. Women show a closer association between educational level and hypertension or diabetes mellitus than males: a secondary analysis from the Austrian HIS. BMC Public Health. 2012;12:392. [DOI] [PMC free article] [PubMed] [Google Scholar]
- 37. Barbeau EM, Krieger N, Soobader MJ. Working class matters: socioeconomic disadvantage, race/ethnicity, gender, and smoking in NHIS 2000. Am J Public Health. 2004;94:269‐278. [DOI] [PMC free article] [PubMed] [Google Scholar]
- 38. Higher Education & Labor Market . Outcomes in Lebanon. http://www.databank.com.lb/docs/Labor%20Market%20Study%20-%20Test.pdf. Updated 2009. Accessed February 20, 2015.
- 39. Naja F, Hwalla N, Itani L, et al. A novel Mediterranean diet index from Lebanon: comparison with Europe. Eur J Nutr. 2015;54:1229‐1243. [DOI] [PMC free article] [PubMed] [Google Scholar]
Associated Data
This section collects any data citations, data availability statements, or supplementary materials included in this article.
Supplementary Materials