

Abstract
To evaluate the association between blood pressure variability (BPV) and mortality in the elderly, all blood pressure measurements recorded in a cohort of individuals 65 years and older were collected and the association between BPV coefficient of variation (BPV divided by mean arterial pressure) was calculated. Mortality during a 10‐year period was compared between BPV coefficient of variation quartiles. Overall, 39 502 individuals 65 years and older were included in the analysis, of which 31 737 (80.3%) were hypertensive; 12 817 (32.4%) individuals died during the study period. Mortality was lower in the second and third blood pressure quartiles compared with the first quartile in both the normotensive and hypertensive groups. In both normotensive and hypertensive individuals, mortality was higher in the fourth quartile, but it was more pronounced in normotensive individuals (odds ratio, 1.18; 95% confidence interval, 1.06–1.31 in hypertensive individuals vs odds ratio, 1.27; 95% confidence interval, 1.17–1.37 in normotensive individuals). High and low BPV are associated with mortality in both hypertensive and normotensive elders.
Keywords: epidemiology, hypertension in the elderly, hypertension‐general
1. Introduction
Although mean arterial pressure is probably the single most important factor associated with cardiovascular morbidity and mortality, systolic blood pressure (SBP) variability (BPV), defined as variation in SBP levels over a period, has been proposed to play a pivotal role in the association between blood pressure (BP) control and cardiovascular morbidity and mortality. Systolic BPV has been found to be associated with mortality and adverse cardiovascular outcomes in several studies1, 2, 3 but not in others.4 Data regarding the association of long‐term systolic BPV with mortality in the elderly are lacking. In this paper, the association between long‐term systolic BPV and mortality was evaluated in a large cohort of hypertensive and normotensive community‐dwelling individuals 65 years and older.
2. Patients and Methods
2.1. Setting and patients
Clalit Health Services (CHS) is the largest health management organization in Israel, with more than 4 million members. Its comprehensive computerized data warehouse aggregates and stores continuous real‐time input from physicians and health service providers, including demographic parameters, medical diagnoses, findings from in‐hospital and outpatient laboratory tests, and medications dispensed, for each of its members. The cohort for the present retrospective study consisted of individuals insured by CHS–Tel Aviv District branch, which insures a mainly urban and Jewish population. All individuals who had at least one available BP measurement in 2002 were identified, but only those in whom BP was recorded at least five times in different years were included in the analysis. Systolic BPV was calculated as the standard deviation of SBP from the mean of all SBP measurements (normally distributed) recorded during the follow‐up period (2002–2012). For the purpose of analysis, we used the BPV coefficient of variation (CV). This value is calculated by dividing the BPV by the mean arterial pressure and multiplying by 100, thus decreasing the influence of the mean arterial pressure on mortality. The CHS database was queried for demographic parameters, comorbidities, outpatient laboratory data, and medications dispensed. In order to evaluate the burden of disease in the study population, the Charlson comorbidity index was used. This index, developed by Charlson and colleagues5 in 1987, is frequently used to predict mortality in the elderly in various settings. It is based on 17 parameters identified in the original cohort reported to be associated with mortality. Among the parameters included in the Charlson comorbidity index are a history of myocardial infarction, cerebrovascular disease, diabetes mellitus, and peripheral arterial disease. This index was used because it performs well in various settings in predicting mortality in the elderly over the long term and provides a simple and readily available method for estimating risk of death from comorbid conditions. The study was approved by the ethics committee of CHS. In accordance with the Israel Ministry of Health regulations, the need for informed consent was waived because the data were collected anonymously from electronic medical records. Data were analyzed with SPSS software version 21.0. (SPSS Inc, Chicago, IL, USA).
3. Results
The cohort included 44 286 patients 65 years and older who had at least one SBP measurement recorded in 2002. Of these, 39 502 had SBP recorded at least five times in different years and were included in the analysis (Figure 1). The average number of SBP measurements of the analyzed cohort was 7.6 and 4199 patients had SBP recorded at least once every year. The mean age of the study cohort was 83±5.9 years and mean BPV was 14.3±6.2 mm Hg. Diabetes mellitus was present in 13 925 patients (35.2%) from the study cohort, whereas hypertension and ischemic heart disease were present in 31 737 (80.3%) and 16 716 patients (42.3%), respectively. Ischemic heart disease was relatively prevalent in this cohort and was present in more than a third of patients in the lowest BPV quartile and almost half of patients in the highest BPV quartile. As ischemic heart disease is a component of the Charlson comorbidity index, it is not surprising that the Charlson comorbidity index paralleled the prevalence of ischemic heart disease (Table 1). Initial SBP values were associated with BPV, which was higher with increasing initial SBP tertiles (in patients with initial SBP ≤130 mm Hg, BPV was 2.11±1.09 mm Hg; in those with initial SBP 131–147 mm Hg, BPV was 2.31±1.08 mm Hg, and in those with initial SBP ≥148, BPV was 3.04±0.98 mm Hg; Figure 2).
Figure 1.
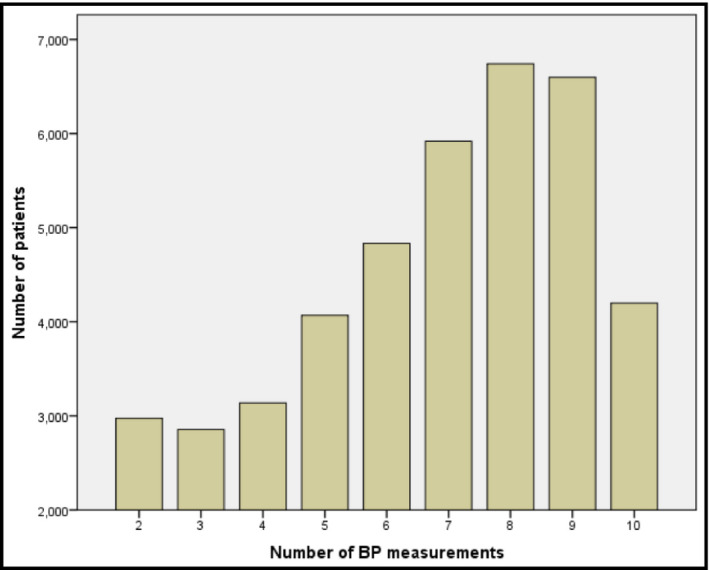
Number of blood pressure (BP) measurements available in the study cohort. Only patients who had at least five BP measurements in different years were included in the analysis
Table 1.
Prevalence of diabetes mellitus, ischemic heart disease, and hypertension across BP variability quintiles
| BP Variability | ≤10.56 mm Hg | 10.57–14.07 mm Hg | 14.08–17.94 mm Hg | ≥17.95 mm Hg | P Value |
|---|---|---|---|---|---|
| Age, y | 82.4±5.8 | 82.7±5.7 | 83.3±5.8 | 84±6.9 | <.01 |
| Systolic BP, first measurement, mm Hg | 131.5±12.5 | 137.1±15.8 | 143.2±19.1 | 152±25.1 | <.01 |
| Diastolic BP, first measurement, mm Hg | 76.8±7.7 | 77.7±8.7 | 78.6±9.7 | 80.1±10.9 | <.01 |
| Charlson comorbidity score | 2.8±2.5 | 3.2±2.6 | 3.6±2.7 | 3.9±2.8 | <.01 |
| Diabetes mellitus, % | 29.5 | 34.5 | 37.7 | 39.7 | <.01 |
| Hypertension, % | 64 | 79.3 | 87.7 | 91.5 | <.01 |
| Ischemic heart disease, % | 36.6 | 40.1 | 44.6 | 48.5 | <.01 |
Abbreviation: BP, blood pressure.
Figure 2.
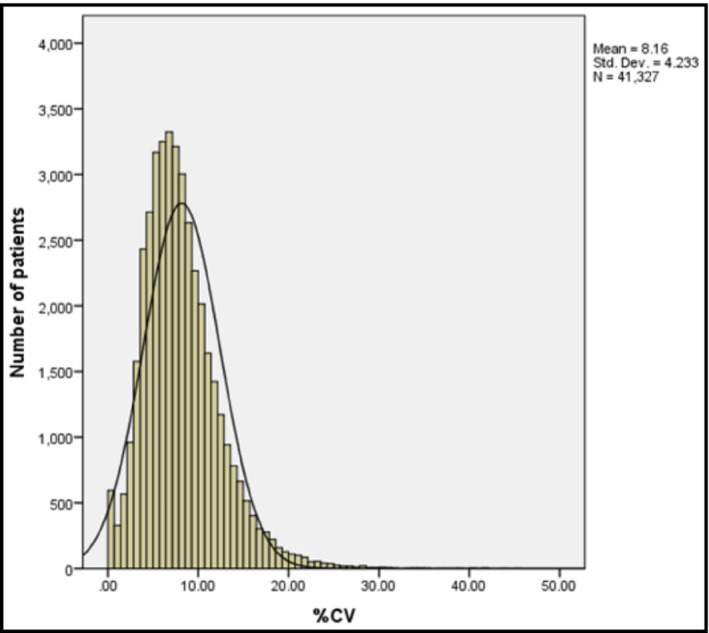
Distribution of blood pressure variability coefficient of variance (CV) in the study population
Mortality occurred in 12 817 (32.4%) individuals of the entire cohort: 10 067 of 31 737 (31.7%) of hypertensive individuals and 2750 of 7765 (35.4%) of normotensive individuals. Following adjustment for sex, age, Charlson comorbidity index, and initial SBP, mortality was higher in the fourth systolic BPV CV quartile compared with the first BPV CV quartile in both hypertensive and normotensive individuals. Mortality was lower in the second and third BPV CV quartiles compared with the first quartile in both normotensive and hypertensive individuals. This resulted in a U‐shaped pattern of association between BPV CV and mortality in both hypertensive and normotensive elderly (Table 2). BPV CV in the fourth quartile was more strongly associated with mortality in normotensive compared with hypertensive elderly patients (odds ratio, 1.27; confidence interval, 1.17–1.37 for normotensive individuals vs odds ratio, 1.18; confidence interval, 1.06–1.31 for hypertensive individuals).
Table 2.
Odds ratios for mortality with different BPV quartiles per coefficient of variation, adjusted for age, sex, Charlson comorbidity index, and baseline systolic blood pressure
| Normotensive | Hypertensive | |
|---|---|---|
| Quartile 1 (BPV ≤10.56 mm Hg) | 1 | 1 |
| Quartile 2 (BPV 10.57–14.07 mm Hg) | 0.62 (0.57–0.67) | 0.67 (0.60–0.75) |
| Quartile 3 (BPV 14.08–17.94 mm Hg) | 0.72 (0.67–0.78) | 0.73 (0.66–0.81) |
| Quartile 4 (BPV ≥17.95 mm Hg) | 1.27 (1.17–1.37) | 1.18 (1.06–1.31) |
Abbreviation: BPV, blood pressure variation.
4. Discussion
In this large study of elderly individuals, systolic BPV CV in the first and fourth BPV CV quartile was associated with increased mortality compared with the second and third quartiles, creating a U‐shaped association between BPV and mortality. A recent meta‐analysis6 reported that long‐term BPV was associated with cardiovascular and mortality outcomes. The conclusions of this database were based on 41 studies, of which approximately half were observational. These studies were performed in the general population, and data regarding the association between long‐term BPV and mortality in the elderly are much less robust. Another recently published study4 evaluated the association between BPV and mortality in the elderly and reported that diastolic but not systolic BPV was associated with overall and cardiovascular mortality, whereas mortality was increased in elderly patients in whom SBP differed by more than 20 mm Hg between measurements. This study was different from the present study because its analysis was based on BP measurements taken in a relatively small population evaluated in the setting of a clinical trial. A study with a similar design to ours was recently published and reported an association between BPV and mortality, coronary heart disease, stroke, and end‐stage renal disease.7 These associations were similar in hypertensive and normotensive individuals, similar to our study's results. This cohort had a very high disease burden with an extremely high prevalence of ischemic heart disease, and more than a third of the patients had diabetes. Mortality was also very high, with approximately one third of patients dying during a 10‐year follow‐up period. This mortality rate is similar to other studies performed in the elderly.4
Several theories have been used to explain the association between elevated BPV and mortality. One is that increased BPV represents nonadherence to treatment,8 whereas other possible explanations include changes in the elastic properties of blood vessels and aortic distensibility and disturbed baroreflex function leading to exaggerated pressor response to physical and emotional stimuli.9 The fact that mortality was highest in the highest BPV quintiles in normotensive individuals may serve as evidence that one of the last two proposed mechanisms is probably the most significant in elderly individuals. In fact, the association between high BPV and mortality was more pronounced in normotensive than in hypertensive individuals. The fact that systolic BPV in normotensive individuals has prognostic significance is important, as it may help to identify a subset of individuals at high risk for mortality, even in the absence of hypertension.
The U‐shaped pattern of association of systolic BPV with mortality is puzzling and, to our knowledge, this is the first time that such a finding has been reported. It is not surprising that mortality was maximal at the highest BPV quintile. One possible explanation for this finding is that low BPV in hypertensive patients may represent some form of autonomic dysfunction. This has been reported in a small study in which autonomic nervous system blockade in healthy individuals resulted in decreased BPV.10 In addition, it has been reported that BP in the elderly changes more significantly in response to orthostatic changes, perhaps representing a maladaptive repsonse.11 It is possible that elderly individuals with lower BPV may have less BP reduction and thus experience reduced consequences of orthostatic hypotension. It is important to note that many studies reported that high BPV is associated with autonomic dysfunction;12, 13 however, we did not find any studies performed in the elderly and it is possible that autonomic dysfunction in the elderly may manifest differently. Another possible explanation for the apparent increased mortality in the elderly with low BPV is that in hypertensive patients, low BPV may represent a poor response to treatment or nonadherence, because, in hypertensive patients, BPV may be at least partially attributed to response to treatment. This means that hypertensive patients would be expected to have a certain degree of BPV that represents treatment adjustments and response to treatment. Hypertensive patients with low BPV may represent a subpopulation who respond poorly to treatment or who are not treated adequately. In this regard, low BPV may help to identify hypertensive patients with poor compliance or poor response to treatment.
Study Limitations
This study has several limitations. First, it is a retrospective cohort study and has the inherent limitations of a study of this kind. Specifically, BP values used for calculation of BPV were performed by the treating physician, and the method used for these measurements could not have been validated. Second, because the CHS database contains only diagnosis without mention of date at which the diagnosis was made, the association between BPV and outcomes other than mortality (cerebrovascular disease, coronary heart disease, and end‐stage renal disease) could not have been evaluated. Therefore, we could not validate that BP measurements were performed prior to the occurrence of the outcome. Since date of prescription of medications was also unavailable in the database, we were unable to evaluate the association between medication use and systolic BPV and the effect of medication use on systolic BPV. Third, the diagnosis of hypertension and other comorbidities was based on the treating physician coding the diagnosis in the medical record. Fourth, the study was based on a cohort of community‐dwelling elders and its conclusions can only be applied to this population. Yet, because this population is continuously increasing, we believe that the conclusions are applicable to a significant proportion of the population with a high prevalence of cardiovascular morbidity and mortality. A potential bias of this study is that individuals suspected to be at higher cardiovascular risk may have had more BP measurements compared with those who were presumed to be at lower risk. This is highlighted by the fact that individuals at the highest BPV quintile had a higher prevalence of ischemic heart disease and diabetes. We attempted to correct for this by adjusting the risk for mortality according to the Charlson comorbidity index, which includes a large number of clinical variables such as ischemic heart disease and diabetes.
Conclusions
Despite these limitations, this is the largest database in which the association between BPV and mortality in the elderly was reported. The fact that a high BPV is associated with mortality in both hypertensive and normotensive elderly individuals is important and gives the clinician an additional tool in predicting mortality in the elderly. In addition, the fact that low BPV may be associated with increased mortality may also help to identify individuals who are at risk for increased mortality due to poor response to treatment or noncompliance. Whether this has specific clinical implications remains to be answered.
Conflict of Interest
None.
Authors' Contributions
All authors had access to the data and a role in the writing of the manuscript.
Weiss A, Beloosesky Y, Koren‐Morag N, Grossman A. Association between mortality and blood pressure variability in hypertensive and normotensive elders: A cohort study. J Clin Hypertens. 2017;19:753‐756. 10.1111/jch.12996
References
- 1. Rothwell PM. Limitations of the usual blood‐pressure hypothesis and importance of variability, instability, and episodic hypertension. Lancet. 2010;375:938‐948. [DOI] [PubMed] [Google Scholar]
- 2. Rothwell PM, Howard SC, Dolan E, et al; ASCOT‐BPLA and MRC Trial Investigators . Effects of β blockers and calcium‐channel blockers on within‐individual variability in blood pressure and risk of stroke. Lancet Neurol. 2010;9:469‐480. [DOI] [PubMed] [Google Scholar]
- 3. Rothwell PM, Howard SC, Dolan E, et al. Prognostic significance of visit‐to‐visit variability, maximum systolic blood pressure, and episodic hypertension. Lancet. 2010;375:895‐905. [DOI] [PubMed] [Google Scholar]
- 4. Wu C, Shlipak MG, Stawski RS, et al; Health ABC Study . Visit‐to‐visit blood pressure variability and mortality and cardiovascular outcomes among older adults: the health, aging, and body composition study. Am J Hypertens. 2017;30:151‐158. [DOI] [PMC free article] [PubMed] [Google Scholar]
- 5. Charlson ME, Pompei P, Ales KL, MacKenzie CR. A new method of classifying prognostic comorbidity in longitudinal studies: development and validation. J Chronic Dis. 1987;40:373‐383. [DOI] [PubMed] [Google Scholar]
- 6. Stevens SL, Wood S, Koshiaris C, et al. Blood pressure variability and cardiovascular disease: systematic review and meta‐analysis. BMJ. 2016;354:i4098. [DOI] [PMC free article] [PubMed] [Google Scholar]
- 7. Gosmanova EO, Mikkelsen MK, Molnar MZ, et al. Association of systolic blood pressure variability with mortality, coronary heart disease, stroke, and renal disease. J Am Coll Cardiol. 2016;68:1375‐1386. [DOI] [PMC free article] [PubMed] [Google Scholar]
- 8. Muntner P, Levitan EB, Joyce C, et al. Association between antihypertensive medication adherence and visit‐to‐visit variability of blood pressure. J Clin Hypertens (Greenwich). 2013;15:112‐117. [DOI] [PMC free article] [PubMed] [Google Scholar]
- 9. Shimbo D, Shea S, McClelland RL, et al. Associations of aortic distensibility and arterial elasticity with long‐term visit‐to‐visit blood pressure variability: the Multi‐Ethnic Study of Atherosclerosis (MESA). Am J Hypertens. 2013;26:896‐902. [DOI] [PMC free article] [PubMed] [Google Scholar]
- 10. Formes KJ, Wray DW, O‐Yurvati AH, Weiss MS, Shi X. Sympathetic cardiac influence and arterial blood pressure instability. Auton Neurosci. 2005;2:116‐124. [DOI] [PubMed] [Google Scholar]
- 11. Shi X, Huang G, Smith SA, Zhang R, Formes KJ. Aging and arterial blood pressure variability during orthostatic challenge. Gerontology. 2003;49:279‐286. [DOI] [PubMed] [Google Scholar]
- 12. Zhang Y, Agnoletti D, Blacher J, Safar ME. Blood pressure variability in relation to autonomic nervous system dysregulation: the X‐CELLENT study. Hypertens Res. 2012;35:399‐403. [DOI] [PubMed] [Google Scholar]
- 13. McKinlay S, Foster C, Clark A, et al. Increased blood pressure variability during 24 h blood pressure monitoring as an early sign of autonomic dysfunction in non‐insulin‐dependent diabetics. J Hum Hypertens. 1994;8:887‐890. [PubMed] [Google Scholar]