

Abstract
This systematic literature review aimed to investigate whether 24 hour diet recall and diet records are reliable and valid ways to measure usual dietary sodium intake compared with 24 hour urinary assessment. We searched electronic databases Medline, Embase, Cinahl, Lilacs, Google Scholar and the Cochrane Library using pre‐defined terms Studies were eligible for inclusion if they assessed adult humans in free‐living settings, and if they included dietary assessment and 24 hours urinary collection for assessment of sodium intake in the same participants. Studies that included populations with an active disease state that might interfere with normal sodium metabolism were excluded. Results of 20 studies using 24 hour diet recall recall (including 14 validation studies) and 10 studies using food records (including six validation studies) are included in this review. Correlations between estimates from dietary assessment and urinary excretion ranged from 0.16 to 0.72 for 24 hour diet recall, and 0.11 to 0.49 for food diaries. Bland‐Altman analysis in two studies of 24 hour diet recall showed poor agreement with 24 hours urinary sodium excretion. These results show that 24 hour diet recall and diet records inaccurately measure dietary sodium intake in individuals compared with the gold standard 24 hours urinary excretion. Validation studies of dietary assessment methods should include multiple days of assessment and 24 hours urine collection, use relevant food composition databases and Bland‐Altman methods of analysis.
Keywords: diet surveys, dietary sodium, urine specimen collection
1. BACKGROUND
Concerns expressed by many in the scientific community that low‐quality research, including research which poorly measures usual intake of dietary salt, is contributing to current controversies and is hampering the implementation of public health interventions in many countries.1 This is despite most international guidelines recommending intakes substantially lower than currently consumed, and the World Health Organization and United Nations recommending a 30% decrease in population salt intake by 2026.2 In response to these concerns, a consortium of international and national health and scientific organizations was formed to set minimum standards for the conduct of clinical and epidemiological research on dietary salt.3
This Review paper describes the results for studies that include either 24‐hour diet recall or diet records (food diaries or weighed food records) and assesses the validity of studies for assessing an individual's sodium intake, essential for epidemiological studies of dietary intake and health‐related outcomes. Twenty‐four–hour diet recalls are often used in large nutrition surveys, such as the National Health and Nutrition Examination Survey (NHANES),4 and involve researchers contacting participants and asking them to record all foods consumed the previous day. This can be done by interview (in person or by telephone), online, or some combination of both. Portion size estimates are made using recognized measures such as cups and spoons, or photographs of portion sizes.5 Recall bias may be reduced by multiple‐pass questioning methods, which include specific questions about frequently “forgotten foods”6; however, 24‐hour recalls are prone to underreporting, particularly for overweight participants.7, 8
Diet records (or food records) involve documenting all foods consumed over a specified time period (one or more days) prospectively by the participant, and involve estimates of portion size either through weighing (weighed diet record) or using other prompts and measures.9 Weighed diet records are often regarded as the most accurate way of assessing nutrient intakes.5 The prospective nature of data recording minimizes recall bias, and weighing all food consumed (including weighing any leftovers at the end of a meal) enables accurate assessment of portion size. To assess usual intake, several days of recording are undertaken, and are usually specified to include week and weekend days, and may include assessment over several weeks or months. Accurate weighed diet records, however, require detailed training of participants and a high degree of commitment on participants’ behalf. The prospective nature of recording may alter behavior; for example, participants may be less likely to eat out on recording days or be more likely to consume foods considered desirable or healthy.9
Quantification of discretionary salt (added in cooking or at the table) is particularly problematic in diet surveys. For weighed diet records, extremely accurate scales are required, as salt added to food is likely to be added as quantities less than a gram which may not register on commonly used equipment. Salt added to cooking is likely to be variably absorbed into different foods depending on specific cooking methods, with a substantial proportion lost if cooking liquids are drained or not consumed.10 For some individuals and populations, difficulty in measuring discretionary salt may not impair estimates, particularly if discretionary salt is not a substantial contributor to overall salt intake. However, salt added during cooking is a major source in some populations. In some populations, sauces and condiments are important contributors to discretionary salt intake and must be measured if valid estimates are to be obtained.11
Twenty‐four–hour urinary sodium is widely regarded as the most accurate method of measurement of dietary sodium intake, provided collection is complete. As a biomarker, it reflects around 90% of sodium ingested over the 24‐hour period. However, both undercollection and overcollection have been reported, and the various methods used to assess completeness of collections such as the use of para‐amino benzoic acid (PABA) or urine volume are not robust.12 Despite this, 24‐hour urine is the most suitable reference method or calibration instrument for comparison in validation studies of dietary assessment methods13, 14 and is therefore the reference method considered in this review.
This Review paper, commissioned by the TRUE (International Consortium for Quality Research on Dietary Sodium/Salt) consortium, describes a systematic review of studies examining sodium intake assessment from 24‐hour diet recall and diet record compared with the gold standard 24‐hour urine collection, in order to understand whether dietary assessment methods are a reliable and valid way of measuring an individual's usual dietary sodium intake. A previous Review paper described the results of studies that compared sodium intake estimates from Food Frequency Questionnaires and 24‐hour urinary excretion.15 The mandate of the TRUE consortium is to develop minimum standards for clinical and epidemiological research on dietary salt. Member organizations of the TRUE consortium include the American Heart Association, the British and Irish Hypertension Society, the Chinese Regional Office of the World Hypertension League, Hypertension Canada, the International Association of National Public Health Institutes, the International Council of Cardiovascular Prevention and Rehabilitation, the International Society of Hypertension, the International Society of Nephrology, the Journal of Clinical Hypertension, the World Health Organization Collaborating Centre for Population Salt Reduction, the Technical Advisory Group to mobilize cardiovascular disease prevention through dietary salt control policies and interventions, the Pan American Health Organization/World Health Organization, the World Hypertension League, and the World Stroke Organization.
2. METHODS
2.1. Search strategy
As described in our previous paper,15 the electronic databases, such as Medline, Embase, Cinahl, Lilacs, Google Scholar, and the Cochrane Library, were searched in 2015, and again in November 2016 using predefined terms (Appendix S1A).15 Two authors (RM and VF) independently reviewed the titles and abstracts of all Review papers identified, and consensus achieved by subsequent discussion. Titles, abstracts, and full‐text Review papers were obtained and translated into English if necessary. Both authors then reviewed the full‐text papers independently.
Additional Review papers not identified in the database search were identified by hand searching reference lists of included studies, and by enquiries with co‐authors and academic colleagues.
2.2. Eligibility criteria
Studies were eligible for inclusion if they were available in full text and assessed adult humans in free‐living settings. Studies were included if they included dietary assessment of sodium intake (24‐hour diet recall or diet record) and 24‐hour urinary collection for the assessment of sodium intake in the same participants. We excluded feeding studies or studies where the amount of sodium in the diet was controlled by investigators. There were no restrictions on language or study sample size. Studies that included populations with an active disease state that might interfere with normal sodium metabolism (eg, renal failure, congestive heart failure, pregnancy) were excluded. Studies that collected urine samples for <24 hours were excluded.
2.3. Data extraction
Two authors independently (RM and VF) extracted data to a spreadsheet, and accuracy was checked by a third author (AN). Extracted data included the study citation, study name, type of study (validation, cohort, or cross‐sectional), population studied (country, type of sample), participant characteristics (age, ethnicity, sex, disease status), whether 24‐hour urine collections were validated for completeness and how, 24‐hour urine sodium results, dietary assessment methods and whether discretionary salt (defined as salt added either during cooking or at the table, or both) was accounted for, dietary assessment results, whether dietary assessment and 24‐hour urine collections were concurrent, and what the methods of comparison were (if any) between the two methods.
As this review is exploratory in nature, no formal risk of bias assessment was carried out. All sodium consumption data are expressed in mg sodium/day using the following conversions: 1 mmol Na = 1 mEq Na = 23 mg Na, and 1 g Na = 2.54 g NaCl = 2.54 g salt.
3. RESULTS
The initial search of databases identified 503 Review papers, and 25 Review papers were identified from other sources (colleagues and networks, Review paper reference lists, and an updated search in November 2016) (seeFigure 1: Prisma Flow Diagram). After 70 duplicates were removed, 458 titles and abstracts were screened, and 108 full‐text Review papers were assessed for eligibility. One publication16 included results from five studies. Data were extracted for 20 studies that reported on results of 24‐hour diet recall and 24‐hour urinary sodium in the same participants (Table 1). Data from a further 10 studies that reported on results of diet records and 24‐hour urinary sodium are summarized in Table 2. Where data from more than one study were included in a single paper,16 data from individual studies were extracted separately where possible. Where data from a single study were reported in two papers,17, 18 this was treated as one study. Supporting papers which described methods of data collection for studies were reviewed for additional data (particularly on methods) where required.
Figure 1.
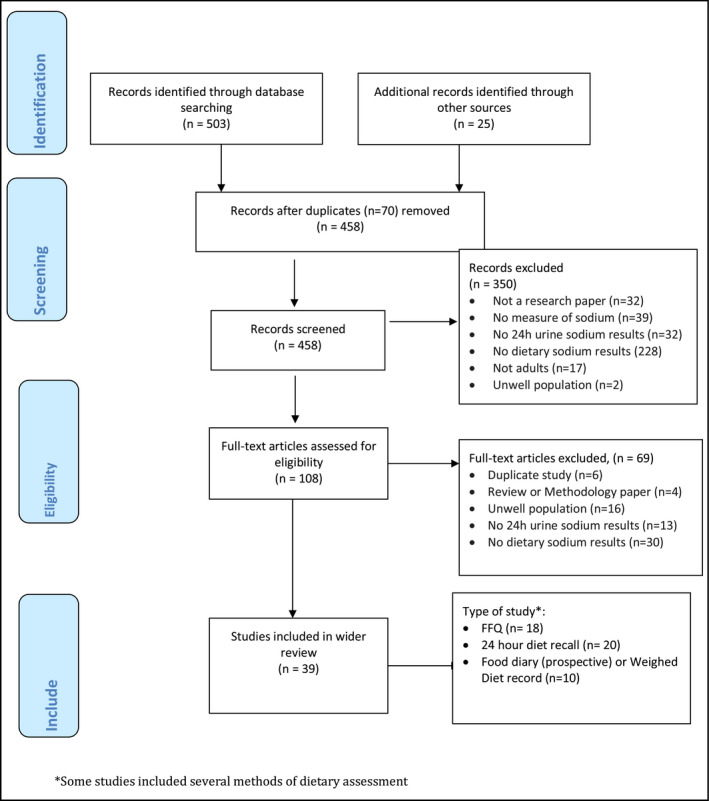
Prisma flow diagram search strategy
Table 1.
Characteristics of included studies with 24‐hour diet recall (summary table)
| First author, year/Name of Study | n (final analysis) | 24‐hour urine collection notes and whether validated for completeness? | Dietary assessment (24‐hour diet recall) | Discretionary salt accounted for? | 24‐hour urine and 24‐hour diet recall concurrent? | Method of comparison |
|---|---|---|---|---|---|---|
| Campino et al48 | 135 | Single collection, urinary creatinine concentration used to assess completeness | One 24‐hour diet recall, involving a qualitative and quantitative component. Quantities in household measures. Data analysis was based on Chilean food composition tables. | Yes | Yes | Correlation 0.390 (P < 0.001) |
| Charlton et al49 | 325 | Three collections, urine volume, urinary creatinine concentration, and PABA used to assess completeness | Three 24‐hour diet recall. Standard household measures, rulers, and photographs were used to quantify food portion sizes. Nutrient intake was calculated using Foodfinder III computer program based on Medical Research Council Food Composition Tables. | No | Yes | Analysis of variance for differences between ethnic groups |
| Cornejo et al24 | 70 | Single collection | Three 24‐hour diet recalls on nonconsecutive days. Chemical Composition Food Chilenos was used or nutritional food labeling to calculate dietary sodium. Intakes were adjusted for energy expenditure. | Yes | No | Bland‐Altman plot showed negative slope, mean difference not reported; correlation: 0.46 (P < 0.01) |
|
De Keyzer et al42 European Food Consumption Validation (EFCOVAL) study. (Belgium) |
123 | Two collections, PABA used to assess completeness | Two 24‐hour diet recalls using EPIC‐Soft protocols and software. Computer‐assisted assessment, face to face, or by phone. Portion size estimated by household measures, weight, volume drawings, and photographs. Country‐specific food composition tables were used to calculate sodium content in foods. | Yes | Yes | Ratio by country and sex. Geometric mean (95% CI) reporting accuracy: 0.67 (0.62,0.72). By sex, men: 0.80, women: 0.69. |
|
De Keyzer et al42 European Food Consumption Validation (EFCOVAL) study. (Czech Republic) |
118 | Two collections, PABA used to assess completeness | Two 24‐hour diet recalls using EPIC‐Soft protocols and software. Computer‐assisted assessment, face to face, or by phone. Portion size estimated by household measures, weight, volume drawings, and photographs. Country‐specific food composition tables were used to calculate sodium content in foods. | Yes | Yes | Ratio by country and sex. Geometric mean (95% CI) reporting accuracy: 0.79 (0.74, 0.85). By sex, men: 0.84, women: 0.87. |
|
De Keyzer et al42 European Food Consumption Validation (EFCOVAL) study. (Norway) |
124 | Two collections, PABA used to assess completeness | Two 24‐hour diet recalls using EPIC‐Soft protocols and software. Computer‐assisted assessment, face to face, or by phone. Portion size estimated by household measures, weight, volume drawings, and photographs. Country‐specific food composition tables were used to calculate sodium content in foods. | Yes | Yes | Ratio by country and sex. Geometric mean (95% CI) reporting accuracy: 0.73 (0.68, 0.79). By sex, men: 0.86, women: 0.73. |
|
INTERMAP (Overall) |
4680 | Two collections, collection time, urine volume, self‐report used to assess completeness | Four 24‐hour diet recalls, two on consecutive days, followed by another two on consecutive days 2‐6 weeks later. A multiple‐pass procedure was used for recording all foods and beverages. Country‐specific aids were used to assist with quantification of portion size. Country‐specific food and nutrient composition databases were used for analysis of dietary intake. | Yes | Yes | Correlation: overall 0.415 (adjusted for sample and sex). All men 0.417; all women 0.409. |
|
TONE Study |
873 | Six collections, collection time, and urine volume used to assess completeness | Eight 24‐hour diet recalls—standardized open‐ended interviews using Minnesota Nutrition Data System software, which automatically prompts participants for descriptions and recipes including salt added during cooking and discretionary use of table salt. | Yes | No | Ratios of average intakes from 24‐hour diet recall/24‐h urine ranged from 0.60 to 0.83 |
| Ferreira‐Sae et al38 | 132 | Single collection | One 24‐hour diet recall in face‐to‐face interview. Portion sizes reported in regionally typical utensil sizes, for example, cup and spoon. Nutrient intakes calculated using the Nutwin database software. | Yes | No | Correlation: 24‐hour recall +discretionary salt: 0.18 (P = 0.06). All others not significant. |
|
Nutrition and Physical Activity Assessment Study of the WHI Observational Study (NPAAS) 2007‐2009 |
450 | Single collection. Total excretion divided by 0.86[Link] | Three 24‐hour diet recalls on nonconsecutive days using Automated Multi‐pass method and the nutrient database Nutrition Data System for Research, University of Minnesota, was used to analyze the results. Conducted by trained study staff via telephone | N/S | N/S | Bias, attenuation factors, correlation coefficients adjusted for within‐person biomarker variation for pooled data. |
|
Freedman et al (2015) Nutrition Biomarker Study for Women's Health Initiative 2004‐200516, 27, 28 |
544 | Single collection, self‐report and PABA used to assess completeness. Total excretion divided by 0.86[Link] | Two 24‐hour diet recalls using Automated Multi‐pass method and software from University of Minnesota Nutrition Coordinating Center. | N/S | No | Bias, attenuation factors, correlation coefficients adjusted for within‐person biomarker variation for pooled data. |
|
Participants in the Automated Multiple‐Pass Method (AMPM) Validation Study. Healthy volunteers 2002‐2004 Also presented in Rhodes et al 201331 |
465 | Two collections, collection time, urine volume, self‐report, and urinary creatinine concentration used to assess completeness. Total excretion divided by 0.86[Link] | Three 24‐hour recalls in a 20% subset of participants—USDA Automated Multiple‐Pass 5‐step Method. Recalls were processed using USDA SURVEYNET software, and the USDA Food and Nutrient Database for Dietary Studies (FNDDS). The first recall was in person, and subsequent via telephone. | Yes | Yes | Bias, attenuation factors, correlation coefficients adjusted for within‐person biomarker variation for pooled data. Reporting accuracy of sodium intake also reported in Rhodes et al (2013)as 0.93 (95%CI 0.89, 0.97) for men and 0.90 (0.87, 0.94) for women. Reporting accuracy was lower for overweight and obese participants compared to normal weight. Correlations were 0.32 (crude) and 0.46 (adjusted for within‐person variation in biomarker) for men and 0.3 (crude) and 0.42 (adjusted) for women. |
|
Validation study data from Energetics Study—2006‐2009. |
263 | Two collections, PABA used to assess completeness | Eight 24‐hour recalls: Web‐based self‐administered—DietDay, Centrax Corporation, Chicago, IL, which includes multi‐passes similar to that of USDA multi‐pass method. Nutrient values are based on USDA values. Only the second, third, and fourth recalls were analyzed. | N/S | N/S | Bias, attenuation factors, correlation coefficients adjusted for within‐person biomarker variation for pooled data. |
|
Validation study data from OPEN Study—data collected 1999‐2000 |
484 | Two collections, PABA and self‐report used to assess completeness | Two 24‐hour recalls—a standardized five‐pass method developed by USDA. Information was collected in person by trained interviewers. Data were analyzed using a nutrient database the Food Intake Analysis System, version 3.99 based on the Continuing Survey of Food Intakes by Individuals. | N/S | No | Bias, attenuation factors, correlation coefficients adjusted for within‐person biomarker variation for pooled data. |
|
Food Choice at Work Study |
50 | Single collection, PABA used to assess completeness | Two face‐to‐face 24‐hour dietary recalls. Method was modified to include specific prompts for discretionary salt consumption (at the table and while cooking). Food and nutrient analysis calculated using NetWISP4. | Yes | Yes |
Bland‐Altman: Mean difference = 87 mg, 95% limits of agreement: −3105, 3180. R 2 = 0.32. |
|
Lassale et al34 NutriNet‐Sante Study |
193 | Two collections, collection time, urine volume, self‐report, and urinary creatinine concentration used to assess completeness | Three nonconsecutive 24‐hour recall. Self‐administered Web‐based tool. Portion sizes estimated by photographs corresponding to more than 200 different food items. Foods could also be directly entered in grams or volume measure, household measure. Nutrient intakes were calculated using the ad hoc NutriNet‐Sante composition table. | N/S | Yes | Correlation after adjustment for energy intake, age, BMI, and level of education. Men: 0.31 (95% CI 0.12,0.48), women: 0.34 (95% CI 0.14,0.52). Correlation coefficient and attenuation factor by sex. Men: r = 0.47 (0.23,0.71), attenuation factor = 0.37 (0.17,0.56). Women: r = 0.37 (0.03,0.70), attenuation factor = 0.23 (0.01,0.45). |
| Mercado et al22 | 402 | Single collection, urine volume, length of collection time, self‐report, and urinary creatinine concentration used to assess completeness | One Standardized interviewer administered 24‐hour diet recall (from the Automated Multiple‐Pass Method). 133 participants completed a second 24‐hour recall. Sodium content of each food was calculated using the USDA's Food and Nutrient Database for Dietary Studies. | Yes | Yes | Correlation Men 0.16, P < 0.05; women 0.25, P < 0.01. Difference (diet‐urine): men = 936.8 mg/d (787.1, 1086.5); women: 108.3 mg/d (11.1, 205.4) |
| Perin et al54 | 108 | Single collection | One Interviewer administrated 24‐hour recall (7 items relating to a meal to quantify sodium naturally present in foods). | Yes | N/S | Means and medians stated only |
| Reinivuo et al55 | 879 | Single collection, urinary creatinine concentration, and urine volume used to assess completeness | Trained nutritionists conducted one 48 hour recall. Portion sizes were estimated using a picture booklet. The Finnish Food Composition Database was used to calculate nutrient intake. Recall was validated against 3‐day food diary collected in 1992. | N/S | No | Correlation 0.30, P < 0.0001 (men = 0.25, women = 0.12) |
| Satoh et al23 | 203 | Single collection, urinary creatinine concentration used to assess completeness | One 24‐hour dietary recall. Beverages and food on the day of their 24‐hour urine collection. Touch panel computer in which participants entered their dietary intake. Dietary intake calculated using the Standard Tables of Food Composition in Japan and Dietary Reference Intakes for Japanese. | Yes | Yes |
Correlation (adjusted) 0.72, P < 0.0001 (unadjusted) 0.66, P < 0.0001 |
|
Trijsburg et al20 DuPLO study |
198 | Two collections, PABA used to assess completeness | Between 1 and 15 24‐hour recalls administered in two ways: Web‐based, based on five‐step multiple‐pass method. Portion sizes reported using household measures, standard portions, and weight in grams. And telephone‐based by trained dietitian using five‐step multiple‐pass method. Looked at potassium and sodium. | No | N/S | 24‐hour recall (telephone based) underestimated sodium by 28.7%; 24‐hour recall (Web‐based) underestimated sodium by 31.7% compared with 24‐hour urinary sodium excretion. |
| Zhang et al19 | 4122 | Single collection, urinary creatinine concentration used to assess completeness | One 24‐hour food record. Self‐administered questionnaire, verified in interview by trained dietitians. Dietary intake was calculated by food composition table of Paul and Southgate. | No | No |
Ratios (dietary/urinary) calculated from the individual values (mean (SD)): Men = 0.80 (0.64), β = −0.024, t = −6.11 Women = 0.71 (0.70), β = −0.017, t = −5.04 |
PABA, para‐amino benzoic acid; SD, standard deviation; CI, confidence interval; N/S not stated.
Consumption estimated assuming 86% of ingested sodium excreted in the urine.
Table 2.
Characteristics of included studies Food diaries (summary table)
| First author, year, name of study | n | 24‐hour urine collection | Dietary assessment (Diet record) | Discretionary salt accounted for? | 24‐hour urine and 24‐hour diet recall concurrent? | Method of comparison |
|---|---|---|---|---|---|---|
| Charlton et al56 | 72 | Single collection, urine volume used to assess completeness | Three‐day food diary, dietary data analyzed by FoodWorks 2007 nutrient analysis software and AUSNUT1999 and Aus Brands database off FSANZ database. | Yes | Yes | N/S |
|
Day et al57 EPIC‐Norfolk cohort study |
123 | Six collections, PABA used to assess completeness | Two 7‐day diet records 18 months apart. Photographs were provided to estimate portion size. Other measures, for example, weights and household units, were also encouraged. | N/S | Yes | Correlation (0.36) |
| Ferreira‐Sae et al38 | 121 | Single collection, urine volume used to assess completeness | Three‐day self‐administered food diary. Measures, including cups, glasses, and spoons, were used to estimate portion size. Nutrient intakes calculated using the Nutwin database software. | Yes | Yes | Spearman correlation (not significant) |
| Itoh et al58 | 763 | Single collection, self‐report, and urinary completeness and urinary creatinine concentration used to assess completeness | One‐day diet record. Records were analyzed using a nutrient database compiled from food composition table. | N/S | Yes | Pearson's correlation coefficients between dietary sodium and urinary sodium: Men 20‐49y r = 0.32, women 20‐49y r = 0.35. Men 50‐79y r = 0.34, women 50‐79y r = 0.27.All correlations were reported as statistically significant. |
| Johansson et al37 | 74 | Single collection, self‐report, PABA, and urinary creatinine concentration used to assess completeness | Four‐day weighed diet record using electronic scale for foods consumed in the home, foods consumed away from home had weight often estimated. All food records coded and analyzed using the national food database at the National Food administration, Uppsala, Sweden. | N/S | N/S | Ratios by three diet groups for diet/urine. Mixed diet ratio: 0.93, shellfish diet ratio:0.85, vegetarian diet ratio:0.74. |
| Kimira et al59 | 219 | Single collection, self‐report, and urine volume used to assess completeness | One‐day weighed diet record. Participants were interviewed after the 24‐hour period to check records. Data were analyzed using Gotei Japanese food standard component table. | Yes | N/S | Correlation (0.27 P < 0.01) |
| Lassale et al36 | 62 | Two collections, urinary creatinine concentration used to assess completeness | Two 4‐day weighed food records, four weeks apart. Each record was checked for accuracy with the participant. Results were analyzed using Australian Foodworks Professional Edition software, based on the Australian nutrient database. | N/S | Yes | Pearson's correlation (0.49 P < 0.01) |
| Lennon‐Edwards et al60 | 36 | Single collection, self‐report used to assess completeness | Three‐day diet record,estimating portion size. Results were analyzed using Nutrition Data System for Research, Minneapolis software. | N/S | Yes | N/S |
| Li et al61 | 2020 | Single collection | Three‐day weighed food record. Researchers visited every household and weighed food in the house, including salt and salty foods. Food was weighed following the 3‐day record. Participants recorded food consumed. | Yes | N/S | Correlation (0.13). Difference between means: 2.0 g salt (14.3% underestimated), proportion of individuals that underestimated (55.3%) and overestimated (42.4%) sodium intake compared with urinary sodium. |
| Liu et al35 | 655 | Single collection, urine volume, self‐report, and urinary creatinine concentration used to assess completeness | Three‐day food record. Sodium consumption of 15 food groups was calculated. Sodium content of each food was adopted from the Chinese Composition Table and a local food sodium database. | Yes | No | Pearson correlation and partial correlation. Observed correlation coefficient: r = 0.11, P < 0.01. Mean dietary sodium was on average 800 mg (14%) less than that estimated by 24‐hour urinary excretion. |
PABA, para‐amino benzoic acid; SD, standard deviation; CI, confidence interval; N/S, not stated.
3.1. Results 24‐hour diet recall
There were twenty studies with data on 24‐hour diet recall which are summarized in Table 1 and Appendix S2C. The three papers listed for De Keyzer describe one study which includes data from three different countries. Freedman (2015) described a pooled analysis of data from five studies. These are treated as separate studies. Of the 20 studies which described results of dietary assessment by 24‐hour diet recall, 14 were specifically validation studies of 24‐hour diet recall and six were population‐based cross‐sectional studies (see Appendix S2C). Seven studies were conducted in the United States, two in Chile, two in Japan, and one each in Brazil, South Africa, Belgium, Ireland, Netherlands, Finland, and Australia. Two studies included participants from more than one country, which included De Keyzer (2015) with participants in Norway, Czech Republic and Belgium, and Dennis (2003), which included participants from China, Japan, the United States, and the United Kingdom (Appendix S2C). Sample sizes of the studies ranged from 50 to 4680 participants, with results for a total of 14,941 participants across all 20 studies (Table 1). The majority of studies included both men and women, with two studies including women only (Appendix S2C). Twelve studies included only healthy participants and excluded those with known medical conditions, while four had participants with hypertension and two included participants who were hypertensive and normotensive. Two studies did not state the inclusion and exclusion criteria regarding health status19, 20 but are included as they are recruited from a population sample.
The number of 24‐hour urine collections carried out by each participants differed between studies (Appendix S2C). Eleven studies reported one collection, seven studies reported two collections, one study reported three collections, and in one study, participants had completed five urine collections. Sixteen studies described methods used to evaluate the completeness of the 24‐hour urine collections (Appendix S2C). Four studies used para‐amino benzoic acid (PABA) alone, three studies used urinary creatinine concentration alone, and nine studies used a combination of methods including collection time, self‐reported completeness, urine volume, PABA, and urinary creatinine concentration. PABA excretion cutoff levels for the determination of complete urine were as follows: between 70% and 103% PABA recovery, ≥78% PABA recovery, and 85%‐110% PABA recovery. One study reported that collections with less than 70% PABA recovery were excluded, and those with 70%‐85% recovery had sodium content adjusted to 93% PABA recovery. Another study stated that collections with less than 50% PABA recovery were excluded, and those with 50%‐85% recovery had sodium content adjusted to 93% PABA recovery. One study also reported PABA cutoffs of ≤75% or ≥97% recovery depending on urinary creatinine excretion. Methods of assessment for incomplete samples using creatinine excretion included an assessment of within‐ and between‐subject variability, exclusion of samples where creatinine (mmol/kg body weight) was outside a certain range (different for men and women), and exclusion of samples if creatinine ratio was below a certain value.
There was also variability in the number of 24‐hour diet recalls used to assess dietary sodium intake (Table 1). Six studies conducted a single 24‐hour diet recall, five studies conducted two recalls, five studies conducted three recalls, one study conducted four recalls, one study conducted five recalls, one study conducted eight recalls, and one study conducted between one and fifteen 24‐hour diet recalls per participant. Methods used to administer the 24‐hour diet recalls also differed between studies (Table 1). Ten studies were interviewer administered or in person, four were self‐administered, one was carried out via telephone, and three used a combination of methods including interview, telephone, Web‐based, and self‐administered. Two studies did not specify how the 24‐hour diet recalls were administered. Methods used to estimate portion sizes included photographs, household measures, weight in grams, volume measures, standard portions, rulers, and utensils including cups and spoons.
Ten studies specified that discretionary salt was accounted for, three studies did not include discretionary salt, and six studies did not provide details about whether discretionary salt was included in their assessment. For nine studies, the 24‐hour urine collection and 24‐hour diet recall were concurrent, seven studies were not, and four studies did not state whether the 24‐hour diet recall and 24‐hour urine collection covered the same time period (Table 1).
When reporting urinary sodium excretion results, seven studies divided the 24‐hour urine results by 0.86, two studies divided by 0.9, and one by 0.95, to account for incomplete excretion of dietary sodium in urine.16, 21 Estimates from the dietary assessment and the 24‐hour urine were presented as mean and standard deviation (n = 12), mean and standard error (n = 1), or geometric mean and 95%CI (n = 7).
Many studies reported the results of statistical comparison between methods, including ratios, correlation coefficients, percentage bias, and analysis of variance. Ten correlation coefficients of dietary with urinary measures were reported (adjusted and/or unadjusted) which ranged from 0.16 for men in Mercardo et al (2015)22 to 0.72 (men and women combined) in Satoh et al (2014).23 Both Mercardo et al and Satoh et al involved analysis of a single 24‐hour urine collection (using creatinine excretion to assess completeness) and a single 24‐hour diet recall which were collected concurrently. Mercardo et al used the United States Department of Agriculture (USDA) Automated Multiple‐Pass Method (AMPM) and the USDA Food and Nutrient Database, and demonstrated correlations for men of 0.16 and women of 0.25. Satoh et al used a computer‐based 24‐hour diet recall and food composition tables of Japan.
Two studies24, 25 reported results of Bland‐Altman limits of agreement analyses, which is used to assess differential bias according to the level of estimated sodium intake from both methods.26 Cornejo et al presented Bland‐Altman plots of the mean difference between dietary and urinary estimates, which show increasing urinary sodium excretion is associated with increasing underestimation by dietary method, although the limits of agreement are not reported.24 Kelly et al report a mean difference of 87 mg/d with 95% limits of agreement of −3105 and 3289 mg/d.25
Freedman et al16 reported on a pooled analysis from five validation studies: the Nutrition Biomarker Study for the Women's Health Initiative (two 24‐hour diet recalls and one 24‐hour urine assessments),27, 28 the Observing Protein and Energy Nutrition (OPEN) Study (two 24‐hour diet recalls and two 24‐hour urines),29 the AMPM Validation Study (three 24‐hour diet recalls and two 24‐hour urines),30, 31 the Energetics Study (eight 24hDRs and two 24‐hour urines, although only three of the 24‐hour diet recall results were analyzed in the pooled analysis),32 and the Nutrition and Physical Activity Assessment Study of the Women's Health Initiative Observational Study (NPAAS) (three 24‐hour diet recalls and one 24‐hour urine).27, 33 Twenty‐four–hour recalls were all on nonconsecutive days, and all included multiple‐pass methods. In the pooled analysis, sodium intake assessed by 24‐hour diet recall was on average 5% to 10% less than that measured in 24‐hour urine collections (ranging from an overestimate of 2% among women in the Energetics Study which collected two 24‐hour urines and eight 24‐hour diet recalls, to an underestimate of 28% among women in the Nutrition Biomarker Study where participants provided a single 24‐hour urine and two 24‐hour diet recalls). Underreporting of intake relating to sodium intake was positively associated with higher body mass index (BMI). In the pooled analysis, correlations of single 24‐hour, two 24‐hour diet recalls, and three 24‐hour diet recalls with 24‐hour urine sodium estimates were 0.39, 0.41, and 0.42 for men, and 0.24, 0.28, and 0.39 for women, respectively.
The authors also calculated attenuation factors (AFs) for each study (Table 1).16 Pooled AFs were around 0.20 for a single 24‐hour diet recall, 0.25 for two 24‐hour diet recalls, and 0.30 for three recalls.16 AFs were also reported in Lassale et al (2015), where they were 0.23 for women and 0.37 for men.34
3.2. Results—diet records
Data regarding diet record studies are summarized in Table 2 and Appendix S2D. Ten studies reported on results of diet records (including food diaries and weighed diet records) including six validation studies and four cross‐sectional studies (Appendix S2D). Of these, two were conducted in Australia, two in Japan, two in China, and one each in Brazil, Sweden, and the United Kingdom (Appendix S2D). Sample sizes of those included in the analysis range from 36 to 2020 participants, with results from a total of 4145 participants across all 10 studies (Table 2). Five of the studies included women only, and four studies included both men and women. One study did not specify the proportion of men and women in the study (Appendix S2D). Six studies reported including healthy participants and excluded participants with listed medical conditions, two studies included participants with hypertension, and two studies did not state whether participants were included or excluded on the basis of any medical conditions (Appendix S2D).
There was variability in the number of 24‐hour urine collections per participant: seven studies included a single collection, one study included two collections, and one included six collections. One study did not specify the number of 24‐hour urine collections. Six studies collected 24‐hour urine samples in the same time period as the food diary or weighed diet record was collected, one collected urine at a different time, and three did not specify whether the dietary assessment and urine collections were concurrent.
Eight studies described a method used to evaluate the completeness of 24‐hour urine collections (Table 2). Of the studies that used a single method of assessing completeness, one study used PABA, one study used an assessment of urine creatinine excretion, one study used urine volume, and one study relied on self‐reported completeness. Four studies used a combination of methods, including urine volume, self‐reported missing urine collections, PABA, and creatinine excretion. The criteria used to interpret 24‐hour urinary creatinine and PABA excretion, and therefore which urine samples were likely to be incomplete, varied between studies. For PABA excretion, one study reported that collections with recovery below 85% were adjusted to 93% for the determination of complete urine samples. Methods of assessment of incomplete samples using creatinine excretion included an assessment of within‐ and between‐subject variability and exclusion of samples where creatinine (mmol/kg body weight) was outside a certain range (different for men and women). For urine volume, cutoff levels for the determination of complete urine samples were as follows: >500 ml/24 h and >1000 ml/24 h.
Two studies collected a one‐day diet record, five studies collected three days, and one study four days. In one study, participants completed two four‐day diet records which were four weeks apart and one study conducted two seven‐day diet records that were 18 months apart (Table 2). For studies that collected dietary data on more than one day, four studies specified that the diet records were completed on consecutive days. Four studies used weighed diet records, and four studies estimated portion sizes through a combination of photographs, weighing and household measures, such as cups, spoons, bowls, and utensils. Two studies did not specify the methods used to estimate sodium intake for the diet record (Table 2).
Various methods were used to compare the different measures including ratios, correlation coefficient, and difference between the means. Correlation coefficients of dietary with urinary measures were reported for six studies and ranged from 0.11 in Liu et al (2014)35 to 0.49 in Lassale et al (2009).36 Two studies did not provide details for a method of comparison, one study reported ratios by three different diet groups (ratio diet record/24‐hour urine: mixed diet ratio, 0.93; shellfish diet ratio, 0.85; vegetarian diet ratio, 0.74),37 and one study reported that the correlation coefficient between dietary sodium intake and 24‐hour urinary sodium excretion was not significant.38 Liu et al reported the mean dietary sodium was on average 800 mg (14%) less than that estimated by 24‐hour urinary excretion using a single 24‐hour urine collection and a three‐day diet record.35 None used a Bland‐Altman analysis to compare diet records with 24‐hour urinary excretion.
4. DISCUSSION
This paper outlines the results of dietary sodium estimates from 24‐hour diet recall (20 studies) and diet records (food diaries and weighed food records) (10 studies) compared with 24‐hour urinary excretion to predict an individual's sodium consumption.
The variety of study methodologies precluded conclusive generalizations about the validity of using diet records or dietary recall to predict an individual's dietary sodium. Hence, study findings that rely on an assessment of individual sodium consumption based on dietary assessment and health outcomes must be viewed carefully and skeptically. It is highly likely however that dietary assessment methods will continue to be used in population and epidemiological studies due to their ability to measure intakes of multiple nutrients, as well as measure intakes of foods and food groups, and assess dietary patterns. Further, validation of specific dietary assessment methods is required, since food composition databases and particular methods of data collection (such as use of electronic data collection and multiple‐pass methods) vary between studies and populations. As methods are refined, more accurate methods of dietary assessment may be developed; however, these will be population specific and need to be validated in the population of interest. Only rigorous study designs with appropriate analysis can define the role of using diet records and dietary recall to predict an individual's dietary sodium.
In general, however, we found little evidence that dietary assessment is a valid method of measurement of usual sodium intake in individuals. Only two studies included in this review used the recommended Bland‐Altman method to validate 24‐hour recall dietary measures agsint 24‐hour urinary sodium Cornejo et al compared results of a single 24‐hour urine with average of three 24‐hour diet recalls and reported that the Bland‐Altman plot showed a negative slope, indicating that the 24‐hour diet recall underestimated intakes at higher levels of urinary excretion.24 This may reflect general underreporting of dietary intake at higher intakes, or social desirability bias due to reluctance to report “unhealthy” (high sodium) foods and further the mean difference in sodium was not reported. Other studies in this review (such as the Nutrition Biomarker Study and AMPM validation study) found underreporting of dietary intake is associated with higher body mass index and presumably higher usual energy intake,16, 31 suggesting a systematic error in 24‐hour dietary assessment methods. Kelly et al compared results from two 24‐hour diet recalls with a single 24‐hour urine collection and reported a mean difference of 87 mg/d; however, the 95% limits of agreement were very wide at −3105, 3180.25 This is much wider than would be considered useful for studies examining relationships between sodium intake and disease outcomes in individuals, although the degree to which this is typical of 24‐hour diet recalls is not known, due to limited use of Bland‐Altman methods in this review.
While correlation is most commonly reported in this review, a correlation coefficient is a measure of the degree to which the estimates are linearly related39 but is not necessarily a good measure of agreement, and will not give an indication of relative bias at different levels of intake26 For 24‐hour diet records, there was a wide range correlation coefficients from 0.1622 to 0.72.23 Many of the reported correlation coefficients were above 0.4, which is the level previously suggested as being acceptable in validation studies.16 Furthermore, in the pooled analysis of five validation studies by Freedman et al, it was demonstrated that correlation coefficients were higher with three 24‐hour diet recalls (0.42 for men and 0.39 for women) than only one 24‐hour diet recall (0.39 for men and 0.24 for women).16 This is consistent with other research which shows that multiple days of recording are required to better estimate usual sodium intake in individuals.40 The correlation coefficients reported in six of the 10 studies reporting on diet records were generally lower than those of 24‐hour diet recalls, ranging from 0.1135 to 0.49,36 with only one above the level of 0.4.
For validation studies such as these, Bland‐Altman analysis is generally preferred to correlation. The Bland‐Altman method, described by Bland and Altman in 1986,26 was developed as a way to compare two different ways of clinical measurement of the same parameter (here dietary sodium intake by dietary assessment and urinary excretion). Bland‐Altman plots display the average measurement using the two methods on the x‐axis, and the difference between the two measures on the y‐axis to assess agreement between the two measures. A horizontal line at zero on the y‐axis would indicate perfect agreement across the range of measures. The plots therefore give a graphical display of how well the two measures agree at different levels of intake, and can therefore show systematic (mean difference) and relative bias as well as limits of agreement. Bland‐Altman analysis therefore measures mean difference between estimates, limits of agreement (95% confidence interval of the mean difference) and displays relative bias at different levels of intake.26 Both studies that used this analysis reported wide limits of agreement, indicating poor agreement between dietary assessment and urinary measures, and Cornejo et al reported a relative bias, with greater difference at higher levels of intake.24, 25
Attenuation factors (AFs) were calculated in several studies; these relate to how the effect of a nutritional variable would be quantified in an association study. They estimate the relative bias in relative risk (RR) estimates caused by measurement error inherent in dietary assessment in classical cohort studies. AFs are greater than 0 and less than or equal to one; the smaller the AF the more the bias in the observed RR For example, if the observed RR for heart disease, comparing high‐ to low‐salt consumption, is 1.6 and the AF is 0.5, then the “true” RR is estimated as 3.2. The AFs are estimated from validation studies involving a gold standard method, such as a biomarker assay.13, 41 In the pooled analysis by Freedman et al, the attenuation factors for 24‐hour diet recalls were higher than those calculated for Food Frequency Questionnaires in the same studies, indicating that estimates from 24‐hour diet recalls are more suitable than Food Frequency Questionnaires for use in cohort studies investigating relationships between sodium intake and disease outcomes, because there is less attenuation of the relationship due to measurement error of sodium intake.16 Other methods of comparison included reporting a ratio of the means from two methods (dietary estimate/urinary sodium excretion) to estimate reporting accuracy.19, 31, 37, 42, 43
As with our first review evaluating Food Frequency Questionnaires,15 there was variability between studies as to number of days of dietary assessment, number of 24‐hour urines collected, and interpretation of 24‐hour urine results. Many of the 24‐hour diet recall studies reported using multiple‐pass methods of assessment, a technique that has been developed to minimize recall bias which involves an initial overview of foods consumed in the period, followed by more detailed questioning of each eating occasion. The USDA AMPM involves a five‐step computerized recall method, which includes a “forgotten foods” list including savory snacks and breads which can be important contributors to sodium intake.30 Validation studies of the AMPM show relatively high reporting accuracy compared with 24‐hour urinary excretion (0.93 for men and 0.90 for women). Reporting accuracy was lower for overweight and obese participants compared to normal weight.31 The authors conclude that the AMPM is a valid measure of estimating sodium intake among adults at a population (or group) level, based on these data. Correlations reported in the AMPM study were only moderate, however, at 0.32 (crude) and 0.46 (adjusted for within‐person variation in biomarker) for men and 0.3 (crude) and 0.42 (adjusted) for women.31 This suggests that 24‐hour diet recall is not an accurate measure of intake at an individual level. The overall correlation in the Freedman pooled analysis, which included results from the Energetics study, OPEN study, the Nutrition Biomarkers study, and the NPAAS, was 0.41,16 which is just over the 0.4 which has been suggested as the cutoff for acceptability in nutrition validation studies.16
The gold standard for assessing dietary sodium is quantifying 24‐hour urinary sodium. Although an accepted standard for assessing sodium intake, it is highly dependent on accurate and complete collection of 24 hours of urine.12 Various methods can be used to assess and exclude incomplete 24‐hour urine samples.44 However, when there is a high level of incomplete 24‐hour urines, the different methods of excluding incomplete urine samples can markedly alter estimations of sodium intake.44 Using PABA to assess completeness of 24‐hour urine samples has been recommended.12 In this study, a wide variety of differing methods was found for excluding 24‐hour urine samples based on PABA excretion. Also studies inappropriately corrected sodium intake based on PABA collections that were lower than 85%. PABA urinary excretion is high soon after ingestion and very low after 8 hours and therefore is not suited to linear corrections. A standard to exclude incomplete urine collections based on PABA excretion is needed. We suggest excluding 24‐hour urine collections with less than 80% PABA recovery or more than 110% PABA recovery. Studies with less than 80% complete urine samples should not be used in assessing the validation of other methods of assessing sodium intake.
Given the range of study designs included in this review, it is difficult to make definitive conclusions about the validity of 24‐hour diet recall or diet records with respect to measurement of dietary sodium in individuals. These include different numbers of dietary and urinary assessment, differences in specifics of 24‐hour diet recall (eg, use of multi‐pass methods, modalities of data collection, inclusion of discretionary salt intake, and different food composition databases) and different statistical analyses. Comparing mean levels using methods, such as reporting accuracy and ratio of means, may be suitable for studies where a tool is to be used for the assessment and monitoring of population‐level intakes, or for monitoring adherence in intervention studies such as clinical trials of dietary intervention. However, where an accurate measure of an individual's usual sodium intake is required such as in epidemiological studies, correlation and Bland‐Altman methods are required.
Limited use of more appropriate statistical methods of assessing agreement, such as Bland‐Altman methods, limits our ability to assess the suitability of these dietary methods as alternatives to 24‐hour urine. It is perhaps surprising that weighed diet records do not perform better as they are often considered the most accurate dietary assessment method.9 Prospectively collected diet records, however, are participant to bias if the individual changes dietary intake during the observation period. The inclusion of prompts, and forgotten foods lists in the multiple‐pass 24‐hour diet recall methods may also in some way account for the apparent superiority of 24‐hour diet recall methods. Nine of the studies specifically report the use of multiple‐pass methods16, 20, 22, 25, 45; however, due to the range of comparison statistics reported, it is difficult to assess whether multiple‐pass methods are more valid overall. A more standardized method of validation would enable better comparison between specific 24‐hour recall tools.
We have made a series of recommendations (Table 3) based on the findings of this review, and our previous review.3 We suggest that up to seven days of assessment using dietary and urinary methods are required for validation studies where an accurate measure of individual intake is required, due to evidence from studies conducted in carefully controlled environments.46, 47 These should be concurrent, and dietary assessment methods should include a measure of discretionary intake of salt and salty condiments and sauces, especially in countries where these make up a substantial proportion of overall sodium intake. Multiple‐pass methods are likely to improve accuracy of 24‐hour diet recalls, and local regularly updated food composition databases should be used to analyze nutrient data.
Table 3.
Recommendations for validation studies of 24‐hour diet recall or diet records measuring individual's usual sodium intake
| Twenty‐four–hour diet recall |
| Multiple preferably nonconsecutive days of dietary assessment per participant should be included.40 |
| Recall methods should include an estimate of discretionary salt used (in cooking or at the table), as well as high‐salt condiments and sauces where appropriate. |
| Multiple‐pass methods should be considered. |
| Diet records (weighed diet record or food diary) |
| Multiple preferably nonconsecutive days of dietary assessment per participant should be included. |
| Records should include an estimate of discretionary salt used (in cooking or at the table), as well as high‐salt condiments and sauces where appropriate. |
| Reference method: 24‐hour urine |
| 24‐hour urinary sodium excretion is the recommended reference method. |
| Multiple preferably nonconsecutive 24‐hour urine collections per participant should be collected.40 |
| Urine collections should be undertaken over the same period of assessment as the dietary assessment.62 |
| Twenty‐four–hour urine collections should be assessed for completeness using a suitable method (such as PABA excretion). |
| Statistical analysis |
| Multiple methods should be used, depending on the purpose of research62 |
| Bland‐Altman methods should be used to assess agreement and relative bias between sodium estimates from 24‐hour diet recall/diet records and urinary excretion. |
| Additional useful statistical methods include correlation, regression, and kappa if data are to be presented as categorical or binary. |
| Sample size should be carefully considered—at least 50‐100 participants for each population group has been suggested for nutritional validation studies.62 |
| Reporting |
| Details of results of validation studies should be reported in utilization studies (including mean difference and limits of agreement), rather than describing the dietary assessment as a “validated.” |
We also note the validity of any dietary assessment method will depend on access to accurate food composition data, and meticulous data collection. Twenty‐four–hour diet recall methods are more generic, and transferable across populations, unlike Food Frequency Questionnaires which require knowledge of which foods are likely to contribute substantially to sodium intake (such as sauces and condiments), which are population specific. All dietary assessment methods have difficulty estimating discretionary salt intake, and this is likely to be a limitation of these methods, especially in individuals and populations where discretionary salt is a major contributor to overall intake.
4.1. Recommendations
Twenty‐four–hour diet recall and diet records are not recommended to be used to assess sodium intake in research studies that examine associations between an individual's sodium intake and health‐related outcomes unless there has been a high‐quality validation study.
Validation studies should use a variety of methods, including Bland‐Altman, calculation of bias at different levels of intake. Attenuation factors that enable interpretation of how systematic measurement error may cause bias when estimating aetiological associations may also be used. Studies should not rely solely on correlation coefficients.
All methods require use of comprehensive, up‐to‐date, and accurate food composition databases. Validation studies only apply to research in populations where the food composition database is directly applicable.
Twenty‐four–hour urine collection (up to seven) should continue to be the reference method for validation studies.46, 47 Twenty‐four–hour urine collections should be assessed for completeness using a suitable method (such as PABA).
Multiple (up to seven) days of dietary assessment should be used for validation studies.46, 47
CONFLICT OF INTEREST
NC is a member of World Action on Salt and Health (a dietary salt reduction organization) and is a paid consultant to the Novartis Foundation, which involves travel expenses and personal fees for site visits, a one‐time contract (2016) to develop a survey, and was a paid member of an advisory board for Midmark in 2017. The other authors have no conflict of interests to disclose.
Supporting information
McLean RM, Farmer VL, Nettleton A, et al; TRUE Consortium (in Ternational Consortium for Quality Research on Dietary Sodium/Salt) . Twenty‐Four–Hour Diet recall and Diet records compared with 24‐hour urinary excretion to predict an individual’s sodium consumption: A Systematic Review. J Clin Hypertens. 2018;20:1360–1376. 10.1111/jch.13391
Funding information
This work was supported by a University of Otago Research Grant.
REFERENCE
- 1. Webster J, Waqanivalu T, Arcand J, et al. Understanding the science that supports population‐wide salt reduction programs. J Clin Hypertens (Greenwich). 2017;19(6):569‐576. [DOI] [PMC free article] [PubMed] [Google Scholar]
- 2. World Health . Organization. Follow‐up to the Political Declaration of the High‐level Meeting of the General Assembly on the Prevention and control of Non‐communicable Diseases: Sixty‐sixth World Health Assembly (WHA66.10). Geneva, Switzerland: World Health Organization, 2013. [Google Scholar]
- 3. TRUE Consortium . Recommended standards for assessing blood pressure in human research where blood pressure or hypertension is a major focus. J Clin Hypertens (Greenwich). 2017;19(2):108‐113. 10.1111/jch.12948. [DOI] [PMC free article] [PubMed] [Google Scholar]
- 4. Cogswell ME, Zhang Z, Carriquiry AL, et al. Sodium and potassium intakes among US adults: NHANES 2003–2008. Am J Clin Nutr. 2012;96(3):647‐657. 10.3945/ajcn.112.034413. [DOI] [PMC free article] [PubMed] [Google Scholar]
- 5. Baranowski T. 24‐Hour Recall and Diet Record Methods. In: Willett WC, ed. Nutritional Epidemiology. Oxford: Oxford University Press; 2013. [Google Scholar]
- 6. Conway JM, Ingwersen LA, Moshfegh AJ. Accuracy of dietary recall using the USDA five‐step multiple‐pass method in men: An observational validation study. J Am Diet Assoc. 2004;104(4):595‐603. 10.1016/j.jada.2004.01.007. [DOI] [PubMed] [Google Scholar]
- 7. Gemming L, Jiang Y, Swinburn B, et al. Under‐reporting remains a key limitation of self‐reported dietary intake: an analysis of the 2008/09 New Zealand Adult Nutrition Survey. Eur J Clin Nutr. 2013;68(2):259‐264. [DOI] [PubMed] [Google Scholar]
- 8. Bailey R. Evaluating Calorie Intake: Data Science Campus; 2018. https://datasciencecampus.ons.gov.uk/2018/02/15/eclipse/. Accessed 20 February 20, 2018.
- 9. Willett W. Nutritional Epidemiology. 3rd ed. Oxford: Oxford University Press; 2013. [Google Scholar]
- 10. James W, Ralph A, Sanchez‐Castillo CP. The dominance of salt in manufactured food in the sodium intake of affluent societies. The Lancet. 1987;21(1):426‐429. [DOI] [PubMed] [Google Scholar]
- 11. Anderson C, Appel LJ, Okuda N, et al. Dietary sources of sodium in China, Japan, the United Kingdom, and the United States, women and men aged 40 to 59 years: The INTERMAP Study. J Am Diet Assoc. 2010;110(5):736‐745. [DOI] [PMC free article] [PubMed] [Google Scholar]
- 12. John KA, Cogswell ME, Campbell NR, et al. Accuracy and usefulness of select methods for assessing complete collection of 24‐hour urine: a systematic review. J Clin Hypertens (Greenwich). 2016;18(5):456‐467. [DOI] [PMC free article] [PubMed] [Google Scholar]
- 13. Freedman LS, Schatzkin A, Midthune D, et al. Dealing with dietary measurement error in nutritional cohort studies. J Natl Cancer Inst. 2011;103(14):1086‐1092. [DOI] [PMC free article] [PubMed] [Google Scholar]
- 14. Thiebaut AC, Freedman LS, Carroll RJ, et al. Is it necessary to correct for measurement error in nutritional epidemiology? Ann Intern Med. 2007;146(1):65‐67. [DOI] [PubMed] [Google Scholar]
- 15. McLean RM, Farmer VL, Nettleton A, et al. Assessment of dietary sodium intake using a food frequency questionnaire and 24‐hour urinary sodium excretion: a systematic literature review. J Clin Hypertens (Greenwich). 2017;19(12):1214‐1230. [DOI] [PMC free article] [PubMed] [Google Scholar]
- 16. Freedman LS, Commins JM, Moler JE, et al. Pooled results from 5 validation studies of dietary self‐report instruments using recovery biomarkers for potassium and sodium intake. Am J Epidemiol. 2015;181(7):473‐487. [DOI] [PMC free article] [PubMed] [Google Scholar]
- 17. Murakami K, Sasaki S, Takahashi Y, et al. Misreporting of dietary energy, protein, potassium and sodium in relation to body mass index in young Japanese women. Eur J Clin Nutr. 2008;62(1):111‐118. [DOI] [PubMed] [Google Scholar]
- 18. Murakami K, Sasaki S, Uenishi K, et al. The degree of misreporting of the energy‐adjusted intake of protein, potassium, and sodium does not differ among under‐, acceptable, and over‐reporters of energy intake. Nutrition Research. 2012;32(10):741‐750. [DOI] [PubMed] [Google Scholar]
- 19. Zhang J, Temme EH, Sasaki S, et al. Under‐and overreporting of energy intake using urinary cations as biomarkers: relation to body mass index. Am J Epidemiol. 2000;152(5):453‐462. [DOI] [PubMed] [Google Scholar]
- 20. Trijsburg L, De Vries J, Boshuizen HC, et al. Comparison of duplicate portion and 24 h recall as reference methods for validating a FFQ using urinary markers as the estimate of true intake. Br J Nutr. 2015;114(8):1304‐1312. [DOI] [PubMed] [Google Scholar]
- 21. Holbrook J, Patterson K, Bodner J, et al. Sodium and potassium intake and balance in adults consuming self‐selected diets. Am J Clin Nutr. 1984;40(4):786‐793. [DOI] [PubMed] [Google Scholar]
- 22. Mercado CI, Cogswell ME, Valderrama AL, et al. Difference between 24‐h diet recall and urine excretion for assessing population sodium and potassium intake in adults aged 18–39 y. Am J Clin Nutr. 2015;101(2):376‐386. 10.3945/ajcn.113.081604. [DOI] [PMC free article] [PubMed] [Google Scholar]
- 23. Satoh M, Kato N, Hosaka M, et al. Validity of salt intake assessment system based on a 24‐h dietary recall method using a touch panel computer. Clin Exp Hypertens. 2014;36(7):471‐477. [DOI] [PubMed] [Google Scholar]
- 24. Cornejo K, Pizarro F, Atalah E, et al. Evaluación de la ingesta dietética y excreción urinaria de sodio y potasio en adultos assessment of dietary intake and urinary excretion of sodium and potassium in adults. Rev Med Chil. 2014;142(6):687‐695. [DOI] [PubMed] [Google Scholar]
- 25. Kelly C, Geaney F, Fitzgerald A, et al. Validation of diet and urinary excretion derived estimates of sodium excretion against 24‐hour urine excretion in a worksite sample. Nutr Metab Cardiovasc Dis. 2015;25:771‐779. [DOI] [PubMed] [Google Scholar]
- 26. Bland JM, Altman DG. Statistical methods for assessing agreement between two methods of clinical measurement. The Lancet. 1986;327(8476):307‐310. [PubMed] [Google Scholar]
- 27. Huang Y, Van Horn L, Tinker LF, et al. Measurement error corrected sodium and potassium intake estimation using 24‐hour urinary excretion. Hypertension. 2014;63(2):238‐244. 10.1161/hypertensionaha.113.02218. [DOI] [PMC free article] [PubMed] [Google Scholar]
- 28. Neuhouser ML, Tinker L, Shaw PA, et al. Use of recovery biomarkers to calibrate nutrient consumption self‐reports in the Women's Health Initiative. Am J Epidemiol. 2008;167(10):1247‐1259. [DOI] [PubMed] [Google Scholar]
- 29. Subar AF, Kipnis V, Troiano RP, et al. Using intake biomarkers to evaluate the extent of dietary misreporting in a large sample of adults: the OPEN study. Am J Epidemiol. 2003;158(1):1‐13. [DOI] [PubMed] [Google Scholar]
- 30. Moshfegh AJ, Rhodes DG, Baer DJ, et al. The US Department of Agriculture Automated Multiple‐Pass Method reduces bias in the collection of energy intakes. Am J Clin Nutr. 2008;88(2):324‐332. [DOI] [PubMed] [Google Scholar]
- 31. Rhodes DG, Murayi T, Clemens JC, et al. The USDA Automated Multiple‐Pass Method accurately assesses population sodium intakes. Am J Clin Nutr. 2013;97(5):958‐964. [DOI] [PubMed] [Google Scholar]
- 32. Arab L, Wesseling‐Perry K, Jardack P, et al. Eight self‐administered 24‐hour dietary recalls using the Internet are feasible in African Americans and Whites: the energetics study. J Am Diet Assoc. 2010;110(6):857‐864. [DOI] [PMC free article] [PubMed] [Google Scholar]
- 33. Prentice RL, Mossavar‐Rahmani Y, Huang Y, et al. Evaluation and comparison of food records, recalls, and frequencies for energy and protein assessment by using recovery biomarkers. Am J Epidemiol. 2011;174(5):591‐603. [DOI] [PMC free article] [PubMed] [Google Scholar]
- 34. Lassale C, Castetbon K, Laporte F, et al. Validation of a Web‐based, self‐administered, non‐consecutive‐day dietary record tool against urinary biomarkers. Br J Nutr. 2015;113(6):953‐962. [DOI] [PubMed] [Google Scholar]
- 35. Z‐m L, Ho SC, Tang N, et al. Urinary Sodium Excretion and Dietary Sources of Sodium Intake in Chinese Postmenopausal Women with Prehypertension. PLoS One. 2014;9(8):e104018‐ 10.1371/journal.pone.0104018. [DOI] [PMC free article] [PubMed] [Google Scholar]
- 36. Lassale C, Guilbert C, Keogh J, et al. Estimating food intakes in Australia: validation of the Commonwealth Scientific and Industrial Research Organisation (CSIRO) food frequency questionnaire against weighed dietary intakes. J Hum Nutr Diet. 2009;22(6):559‐566. [DOI] [PubMed] [Google Scholar]
- 37. Johansson G, Åkesson A, Berglund M, et al. Validation with biological markers for food intake of a dietary assessment method used by Swedish women with three different with dietary preferences. Public Health Nutr. 1998;1(03):199‐206. [DOI] [PubMed] [Google Scholar]
- 38. Ferreira‐Sae M‐CS, Gallani M‐CB, Nadruz W, et al. Reliability and validity of a semi‐quantitative FFQ for sodium intake in low‐income and low‐literacy Brazilian hypertensive subjects. Public Health Nutr. 2009;12(11):2168‐2173. [DOI] [PubMed] [Google Scholar]
- 39. Altman DG. Practical Statistics for Medical Research. London, UK: Chapman & Hall; 1991. [Google Scholar]
- 40. Cogswell ME, Maalouf J, Elliott P, et al. Use of urine biomarkers to assess sodium intake: challenges and opportunities. Annu Rev Nutr. 2015;35:349‐387. [DOI] [PMC free article] [PubMed] [Google Scholar]
- 41. Kipnis V, Subar AF, Midthune D, et al. Structure of dietary measurement error: results of the OPEN biomarker study. Am J Epidemiol. 2003;158(1):14‐21. [DOI] [PubMed] [Google Scholar]
- 42. De Keyzer W, Dofkova M, Lillegaard I, et al. Reporting accuracy of population dietary sodium intake using duplicate 24 h dietary recalls and a salt questionnaire. Br J Nutr. 2015;113(3):488‐497. [DOI] [PubMed] [Google Scholar]
- 43. Espeland MA, Kumanyika S, Wilson AC, et al. Lifestyle interventions influence relative errors in self‐reported diet intake of sodium and potassium. Ann Epidemiol. 2001;11(2):85‐93. [DOI] [PubMed] [Google Scholar]
- 44. Wielgosz A, Robinson C, Mao Y, et al. the impact of using different methods to assess completeness of 24‐hour urine collection on estimating dietary sodium. J Clin Hypertens (Greenwich). 2016;18(6):581‐584. [DOI] [PMC free article] [PubMed] [Google Scholar]
- 45. Dennis B, Stamler J, Buzzard M, et al. INTERMAP: the dietary data—process and quality control. J Hum Hypertens. 2003;17(9):609‐622. [DOI] [PMC free article] [PubMed] [Google Scholar]
- 46. Lerchl K, Rakova N, Dahlmann A, et al. Agreement between 24‐hour salt ingestion and sodium excretion in a controlled environment. Hypertension. 2015;66(4):850‐857. [DOI] [PMC free article] [PubMed] [Google Scholar]
- 47. Birukov A, Rakova N, Lerchl K, et al. Ultra‐long–term human salt balance studies reveal interrelations between sodium, potassium, and chloride intake and excretion, 2. Am J Clin Nutr. 2016;104(1):49‐57. [DOI] [PMC free article] [PubMed] [Google Scholar]
- 48. Campino C, Hill C, Baudrand R. et al. Usefulness and pitfalls in sodium intake estimation: comparison of dietary assessment and urinary excretion in chilean children and adults. Am J Hypertens. 2016;29(10):1212‐1217. 10.1093/ajh/hpw056. [DOI] [PubMed] [Google Scholar]
- 49. Charlton KE, Steyn K, Levitt NS, et al. Ethnic differences in intake and excretion of sodium, potassium, calcium and magnesium in South Africans. Eur J Cardiovasc Prev Rehabil. 2005;12(4):355‐362. [DOI] [PubMed] [Google Scholar]
- 50. Stamler J, Elliott P, Dennis B, et al. INTERMAP: background, aims, design, methods, and descriptive statistics (nondietary). J Hum Hypertens. 2003;17(9):591. [DOI] [PMC free article] [PubMed] [Google Scholar]
- 51. Espeland MA, Kumanyika S, Yunis C, et al. Electrolyte intake and nonpharmacologic blood pressure control. Ann Epidemiol. 2002;12(8):587‐595. [DOI] [PubMed] [Google Scholar]
- 52. Satterfield S, Cutler JA, Langford HG, et al. Trials of Hypertension Prevention phase I design. Ann Epidemiol. 1991;1(5):455‐471. [DOI] [PubMed] [Google Scholar]
- 53. Geaney F, Harrington J, Fitzgerald AP, et al. The impact of a workplace catering initiative on dietary intakes of salt and other nutrients: a pilot study. Public Health Nutr. 2011;14(8):1345‐1349. [DOI] [PubMed] [Google Scholar]
- 54. Perin MS, Cornelio ME, Rodrigues RC, et al. Characterization of salt consumption among hypertensives according to socio‐demographic and clinical factors. Rev Lat Am Enfermagem. 2013;21(5):1013‐1021. [DOI] [PubMed] [Google Scholar]
- 55. Reinivuo H, Valsta L, Laatikainen T, et al. Sodium in the Finnish diet: II trends in dietary sodium intake and comparison between intake and 24‐h excretion of sodium. Eur J Clin Nutr. 2006;60(10):1160‐1167. [DOI] [PubMed] [Google Scholar]
- 56. Charlton K, Yeatman H, Houweling F, et al. Urinary sodium excretion, dietary sources of sodium intake and knowledge and practices around salt use in a group of healthy Australian women. Aust N Z J Public Health. 2010;34(4):356‐363. [DOI] [PubMed] [Google Scholar]
- 57. Day N, McKeown N, Wong M, et al. Epidemiological assessment of diet: a comparison of a 7‐day diary with a food frequency questionnaire using urinary markers of nitrogen, potassium and sodium. Int J Epidemiol. 2001;30(2):309‐317. [DOI] [PubMed] [Google Scholar]
- 58. Itoh R, Suyama Y, Oguma Y, et al. Dietary sodium, an independent determinant for urinary deoxypyridinoline in elderly women. A cross‐sectional study on the effect of dietary factors on deoxypyridinoline excretion in 24‐h urine specimens from 763 free‐living healthy Japanese. Eur J Clin Nutr. 1999;53(11):886‐890. [DOI] [PubMed] [Google Scholar]
- 59. Kimira M, Kudo Y, Takachi R, et al. Associations between dietary intake and urinary excretion of sodium, potassium, phosphorus, magnesium, and calcium. Nihon Eiseigaku Zasshi. 2004;59(1):23‐30. [DOI] [PubMed] [Google Scholar]
- 60. Lennon‐Edwards S, Allman BR, Schellhardt TA, et al. Lower potassium intake is associated with increased wave reflection in young healthy adults. Nutr J. 2014;13:39. [DOI] [PMC free article] [PubMed] [Google Scholar]
- 61. Li J, Lu Z, Yan L, et al. Comparison of dietary survey, frequency and 24 hour urinary Na methods in evaluation of salt intake in the population. Zhonghua Yu Fang Yi Xue Za Zhi. 2014;48(12):1093‐1097. [PubMed] [Google Scholar]
- 62. Cade J, Burley V, Warm D, et al. Food‐frequency questionnaires: a review of their design, validation and utilisation. Nutr Res Rev. 2004;17(01):5‐22. [DOI] [PubMed] [Google Scholar]
Associated Data
This section collects any data citations, data availability statements, or supplementary materials included in this article.
Supplementary Materials