

Abstract
Obstructive sleep apnea (OSA) causes blood pressure (BP) surges during sleep, which may lead to increased sleep‐onset cardiovascular events. The authors recently developed a triggered nocturnal BP monitoring system that initiates BP measurements when oxygen desaturation falls below a variable threshold. The distribution and reproducibility of hypoxia‐triggered nocturnal BP parameters compared with those of fixed‐interval nocturnal BP parameters for two consecutive nights in 147 OSA patients (mean age 59.4 years, 86.4% men) were evaluated. The mean and distribution (standard deviation [SD]) of the hypoxia‐peak systolic BP (SBP) were significantly greater than that of the mean nocturnal SBP (mean±SD: 148.8±20.5 vs 123.4±14.2 mm Hg, P<.001). The repeatability coefficient (expressed as %MV) of hypoxia‐peak SBP between night 1 and night 2 was comparable to that of mean nocturnal SBP (43% vs 32%). In conclusion, hypoxia‐peak nocturnal BP was much higher than mean nocturnal BP, and it was as reproducible as mean nocturnal BP.
Obstructive sleep apnea (OSA) is the most frequent cause of secondary hypertension and resistant hypertension.1 When an OSA episode occurs, it causes a blood pressure (BP) surge. Such surges can lead to increases in not only nocturnal BP level but also nocturnal BP variability, each of which increase the cardiovascular risk independently of each other.2, 3 It could be clinically meaningful to measure BP surges, as they may contribute to cardiovascular risks through a huge and repetitive BP load. It is of particular interest that the onset time of cardiovascular events in OSA patients differs from that of non‐OSA patients, and that sleep‐onset cardiovascular events occur more frequently during sleep periods in OSA patients.4, 5 An exaggerated nocturnal BP surge triggered by hypoxic episodes of sleep apnea would trigger sleep‐onset cardiovascular events in OSA patients.6, 7
Ambulatory BP monitoring (ABPM), the gold standard of nocturnal BP monitoring, measures an individual's BP at fixed intervals (eg, 30 minutes), and many reports have shown a relationship between BP values measured by ABPM and target organ damage or cardiovascular events.8, 9, 10, 11 However, ABPM would underestimate the cardiovascular risk during sleep in individuals with OSA, because intermittent BP measurements taken only at fixed intervals cannot detect nocturnal BP surges triggered by apnea episodes in a timely manner.
To solve this problem, we recently developed a triggered nocturnal BP monitoring (TNP) method based on an oxygen‐trigger function that initiates a BP measurement when the patient's oxygen saturation falls below a variable threshold.12, 13, 14, 15 In the present study, to determine whether this triggered BP monitoring would be useful for the stratification of high‐risk OSA patients and for monitoring the quality of BP control, we evaluated the distribution and reproducibility of the measurements of hypoxia‐triggered nocturnal BP parameters and compared them with the corresponding values of fixed‐interval nocturnal BP parameters in 147 patients suspected of having OSA.
Methods
Study Design and Patients
Figure 1 shows the flow of study participants. The participants were outpatients in whom polysomnography (PSG) was planned for the diagnosis of sleep apnea. Inclusion criteria were as follows: patients who had a 3% oxygen desaturation index (ODI) more than 15 per hour in the screening test of sleep apnea syndrome (SAS) with pulse oximetry and who had subjective symptoms of SAS such as heavy sleepiness during the day. A total of 147 patients were recruited as the study patients between June 2009 and March 2013. All patients underwent overnight full PSG with a PS2 Plus Sleep Watcher system (Compumedics Limited, Inc., Melbourne, Australia) and TNP simultaneously for two consecutive nights in the sleep laboratory of Washiya Hospital (Tochigi, Japan). This study was approved by the institutional research board of Washiya Hospital, and informed consent for participation in the study was provided by every participant.
Figure 1.
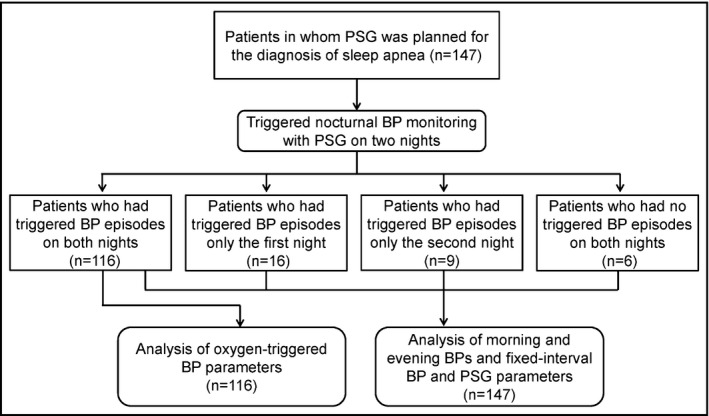
Flow of study patients. PSG indicates polysomnography; BP, blood pressure.
Clinic BP Measurements
Clinic BP was measured before bedtime (evening BP) and after waking (morning BP) on both measurement days. In each clinic BP measurement, triplicate BP measurements were taken by a nurse with an HEM‐780 validated cuff oscillometric BP monitor (Omron Healthcare, Kyoto, Japan)16 with the patient in the sitting position with his or her back supported, without his or her legs crossed, and with both arms supported at the heart level after a 5‐minute rest. The average value of these three readings was used in the analysis.
TNP Monitoring
The TNP system has two different BP measurement functions. The first is the fixed‐interval function, which measures BP at a fixed interval (the same function as that of ABPM). The second, novel function is an oxygen‐triggered function that initiates BP measurement when the patient's oxygen saturation (SpO2) level (which is continuously monitored by pulse oximetry) falls below a threshold. In this study, the BP measurement was obtained by both the fixed‐interval function (every 30 minutes) and by the oxygen‐triggered function with the variable threshold algorithm we developed.12, 13 In the variable threshold algorithm, the threshold to initiate BP measurement is initially set to the patient's baseline SpO2 value (ie, the SpO2 value immediately before bedtime) minus 10% of that value. Once triggered, the threshold is continuously decreased according to the current SpO2 value until the dip of SpO2 is reached, and, thereafter, the threshold is increased at a rate of 10% per hour from the values of the SpO2 dip. When the current SpO2 value falls below the current threshold, the TNP system's HEM‐780 BP monitor takes three measurements—systolic BP (SBP), diastolic BP (DBP), and pulse rate (PR)—at 15‐second intervals.
Definition of Nighttime BP Parameters
We defined the hypoxia‐peak SBP as the maximum SBP value measured by the oxygen‐triggered function. We defined nocturnal SBP surge as the difference between the hypoxia‐peak SBP and the average of the SBP values measured by the fixed‐interval function within 30 minutes before and after the hypoxia‐peak SBP (Figure 2).17 The mean nocturnal SBP was the average of the nocturnal BP values measured only by the fixed‐interval function. The minimum nocturnal SBP was the lowest SBP value among all of the nocturnal BP values measured by either the oxygen‐triggered or fixed‐interval functions.
Figure 2.
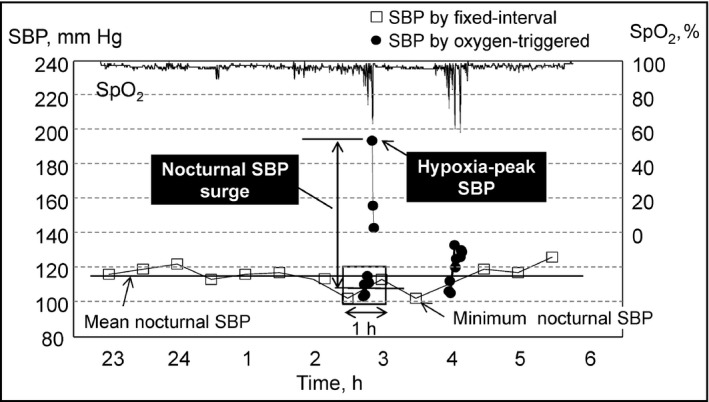
Definition of nocturnal blood pressure (BP) parameters measured by triggered nocturnal BP monitoring. SBP indicates systolic blood pressure; SpO2, oxygen saturation measured by pulse oximetry.
Classification of Nocturnal Hypertension and Its Reproducibility
We evaluated the distributions of the mean nocturnal SBP and hypoxia‐peak SBP values by calculating the standard deviation (SD) and coefficient of variation (CV). By using the mean nocturnal SBP and hypoxia‐peak SBP, we defined the following groups of patients: those with hypoxia‐induced surge nocturnal hypertension were the patients who had mean nocturnal SBP ≥120 mm Hg and hypoxia‐peak SBP ≥160 mm Hg; those with nonsurge nocturnal hypertension were the patients who had mean nocturnal SBP ≥120 mm Hg and hypoxia‐peak SBP <160 mm Hg; those with surge nocturnal normotension were the patients who had mean nocturnal SBP <120 mm Hg and hypoxia‐peak SBP ≤160 mm Hg; and those with nocturnal normotension were the patients who had mean nocturnal SBP <120 mm Hg and hypoxia‐peak SBP <160 mm Hg. The threshold of 120 mm Hg for mean nocturnal SBP was referred by a diagnosis threshold of nocturnal hypertension, and the threshold of 160 mm Hg for hypoxia‐peak SBP was referred by an average value of hypoxia‐peak SBP (164 mm Hg) in 11 hypertensive OSA patients observed in our previous study.17
Among the patients who had mean nocturnal SBP and hypoxia‐peak SBP on both nights, we classified the patients by mean nocturnal SBP and a hypoxia‐peak SBP using the criteria described above with respect to each of the two nights. We then determined the prevalence of the patients with each classification and the concordance rate of the patients who were stratified into the same classification on both nights.
Reproducibility of Nocturnal BP Parameters
For each measurement night, we calculated the means±SDs of the clinic and nocturnal BP parameters and used the paired t test to compare the mean values between the 2 days. P values <.05 (two‐tailed) were considered significant. Reproducibility was evaluated using the repeatability coefficient (RC) and the intraclass correlation coefficient (ICC). The RC is twice the SD of the within‐subject differences between repeat recordings (the second value minus the first value). As described,18 we also calculated the %M as the percentage of the mean of the repeat measurements, and the %MV as the percentage of four times the SD of the average of the repeat measurements. All statistical analyses were performed with SPSS version 15 software (IBM, Armonk, NY).
Results
The clinical characteristics of the 147 study patients are shown in Table 1. The mean±SD age of the patients was 59.4±13.7 years, and most of the patients were men (86.4%) and mildly obese (body mass index [BMI]: 28.5±5.3). Many of the patients had hypertension (62.6%) for which they took antihypertensive treatment and hyperlipidemia (21.1%). For all patients, the apnea hypopnea index (AHI), which is the number of apnea or hypopnea episodes per hour, was 36.7±18.8 for the first night and 36.6±17.8 for the second night (P=.89).
Table 1.
Clinical Characteristics of the Study Patients (n=147)
| Age, y | 59.4±13.7 |
| Male:female, No. (%) | 127:20 (86.4:13.6) |
| BMI, kg/m2 | 28.5±5.3 |
| Hypertension, % | 62.6 |
| Hyperlipidemia, % | 21.1 |
| Diabetes, % | 15.0 |
| History of angina, % | 6.1 |
| History of myocardial infarction, % | 3.4 |
| History of stroke, % | 2.0 |
| Antihypertensive drugs | 67.3 |
| Calcium channel blockers, % | 44.2 |
| ACE inhibitors/ARBs, % | 55.1 |
| Diuretics, % | 25.9 |
| Others, % | 21.6 |
Abbreviations: ACE, angiotensin‐converting enzyme; ARBs, angiotensin receptor blockers; BMI,body mass index. Data are expressed as mean±standard deviation or percentages.
According to the classification of the International Classification of Sleep Disorders, Third Edition,19 the percentage of patients with mild SA (5≤AHI<15), moderate SA (15≤AHI<30), and severe SA (AHI ≥30) were 9.5%, 29.9%, and 60.6%, respectively. The reproducibility of the PSG parameters was very good (the results are shown in Supplementary Table 1); however, the arousal index in the first night (36.2±17.4) was slightly, but not significantly, higher (P=.09) than that of the second night (33.3±18.0), which may be the result of the first night effect.20
Distribution of Nocturnal BP
Among the 147 patients, 116 had at least one more triggered BP episode on both nights (Figure 1. Therefore, the effective number of patients for the analysis of BP and PR parameters measured by the TNP system's oxygen‐triggered function was 116, and that of the analysis of BP and PR parameters measured by the system's fixed‐interval function, morning BP, morning PR, evening BP, and evening PR was 147.
Figure 3 shows the distributions of mean nocturnal SBP and hypoxia‐peak SBP values measured on both nights. The hypoxia‐peak SBP values (mean, 148.8 mm Hg) were higher than the mean nocturnal SBP values (mean, 123.4 mm Hg), and the range of distribution of the hypoxia‐peak SBP values (SD=20.5 mm Hg, CV=0.14) was greater than that of the mean nocturnal SBP (SD=14.2 mm Hg, CV=0.11). The prevalence of patients who had hypoxia‐peak SBP ≥160 mm Hg was 28.0%.
Figure 3.
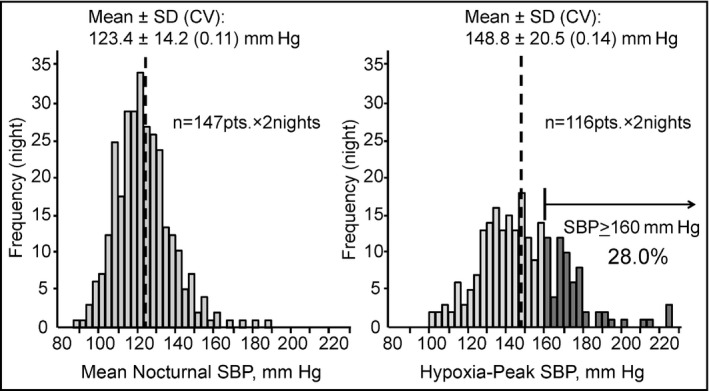
Distributions of mean nocturnal systolic blood pressure (SBP) and hypoxia‐peak SBP. The hypoxia‐peak SBP values were higher than the mean nocturnal SBP values, and the range of the distribution of hypoxia‐peak SBP was wider than that of the mean nocturnal SBP. SD indicates standard deviation; CV, coefficient of variation.
Reproducibility
The BP and PR levels on each night and their reproducibility are shown in Table 2. The values of all of the nocturnal BP parameters on the first night were higher than those on the second night. The morning SBP values (first night: 137.6±17.9, second night: 134.6±16.5) on both nights were significantly higher than those of evening SBP (first night: 129.1±15.1, second night: 125.7±14.9) (P<.001 for both the first and second nights). The SD of SBP measured by the fixed‐interval function was almost the same as that of the SBP measured by the oxygen‐triggered function, and it was significantly correlated with both the hypoxia‐peak SBP (r=0.23, P=.01) and the SD of the SBP values measured by the oxygen‐triggered function (r=0.53, P<.001).
Table 2.
Blood Pressure and Pulse Rate Levels in Each Day and Associated Reproducibility
| First | Second | P Value | Reproducibility | ICC | |||
|---|---|---|---|---|---|---|---|
| RC | %M | %MV | |||||
| Evening (n=147) | |||||||
| SBP, mm Hg | 129.1±15.1 | 125.7±14.9 | <.01 | 22.7 | 18 | 41 | 0.69 |
| DBP, mm Hg | 80.5±11.2 | 78.9±12.2 | <.01 | 13.6 | 17 | 30 | 0.82 |
| PR, beats per min | 69.0±10.3 | 70.0±10.6 | .08 | 12.8 | 18 | 32 | 0.81 |
| Nighttime | |||||||
| Fixed‐interval function (n=147) | |||||||
| Mean SBP, mm Hg | 124.7±14.9 | 122.2±14.9 | <.01 | 18.2 | 15 | 32 | 0.80 |
| SD of SBP, mm Hg | 11.3±3.6 | 11.8±3.3 | .12 | 6.7 | 58 | 56 | 0.51 |
| SBP at 2 am, mm Hg | 122.6±19.7 | 120.4±20.0 | .12 | 35.5 | 29 | 50 | 0.60 |
| Mean SBP of 2 am and 3 am, mm Hg | 122.7±18.2 | 119.5±17.9 | <.01 | 29.0 | 24 | 44 | 0.67 |
| Mean SBP of 2 am, 3 am, and 4 am, mm Hg | 122.9±18.0 | 120.0±17.2 | <.01 | 27.0 | 22 | 41 | 0.70 |
| Mean DBP, mm Hg | 76.0±10.5 | 74.4±11.2 | <.001 | 10.1 | 13 | 24 | 0.88 |
| Mean PR, beats per min | 59.5±7.9 | 59.9±8.1 | .25 | 7.0 | 12 | 23 | 0.90 |
| Oxygen‐triggered function (n=116) | |||||||
| Hypoxia‐peak SBP, mm Hg | 149.7±21.9 | 147.9±22.7 | .28 | 35.3 | 24 | 43 | 0.69 |
| Mean SBP, mm Hg | 127.0±16.2 | 123.5±16.3 | <.01 | 24.2 | 19 | 40 | 0.70 |
| SD of SBP, mm Hg | 10.2±4.0 | 10.8±4.4 | .13 | 8.7 | 82 | 60 | 0.46 |
| Mean DBP, mm Hg | 78.0±10.9 | 75.5±11.6 | <.001 | 14.1 | 18 | 33 | 0.78 |
| Mean PR, beats per min | 59.9±7.7 | 59.7±7.3 | .63 | 7.8 | 13 | 27 | 0.87 |
| Nocturnal SBP surge, mm Hg | 26.0±15.5 | 25.7±15.8 | .85 | 36.8 | 142 | 72 | 0.32 |
| Minimum nocturnal SBP, mm Hg (n=147) | 98.9±16.2 | 94.8±15.5 | <.01 | 30.7 | 32 | 55 | 0.51 |
| Morning (n=147) | |||||||
| SBP, mm Hg | 137.6±17.9 | 134.6±16.5 | .01 | 29.4 | 22 | 47 | 0.62 |
| DBP, mm Hg | 83.2±12.3 | 81.5±13.0 | .09 | 23.5 | 29 | 52 | 0.57 |
| PR, beats per min | 62.5±9.6 | 64.1±10.3 | <.01 | 13.5 | 21 | 36 | 0.76 |
Abbreviations: DBP, diastolic blood pressure; ICC, intraclass correlation coefficient; %M, percentage of the mean of the repeat measurements; %MV, percentage of four times the standard deviation of the average of the repeat measurements PR, pulse rate; RC, repeatability coefficient; SBP, systolic blood pressure.
The repeatability coefficient (expressed as the %MV; a low %MV indicates good reproducibility) of the hypoxia‐peak SBP was 43%, which is nearly as low as that of the mean nocturnal SBP (32%). On the other hand, the RC of the nocturnal SBP surge measured by the oxygen‐triggered function was 72%, which is worse than that of the mean nocturnal SBP. These tendencies were observed in our ICC analysis (large ICC values indicate good reproducibility). The ICC of hypoxia‐peak SBP was 0.69, which is as good as that of the mean nocturnal SBP (0.80), and both of these values are considered “substantial” by Landis's criteria.21
On the other hand, the ICC of the nocturnal SBP surge was 0.33, which was judged as “fair.” The reproducibility in the group of moderate SA (15≤AHI<30) and severe SA (30 ≤AHI) patients tended to be worse than that of the group of mild SA (5≤AHI<15) patients (Supplementary Table 2). The reproducibility of SBP at 2 am (%MV=50, ICC=0.60) was worse compared with that of the mean nocturnal SBP, the mean SBP at 2 am and at 3 am (%MV=44, ICC=0.67), and that of the mean SBP at 2 am, 3 am, and 4 am (%MV=41, ICC=0.70).
Classification of Uncontrolled Nocturnal Hypertension
Figure 4 shows the scatterplot of the mean nocturnal SBP values and hypoxia‐peak SBP values of 116 patients × two nights (n=232). The percentages of stratified patients were as follows: hypoxia‐induced surge nocturnal hypertension, 27.6%; nonsurge nocturnal hypertension, 30.2%; surge nocturnal normotension, 0.9%; and nocturnal normotension, 41.4%. Clinical characteristics of the study patients in each classification of nocturnal hypertension are described in Supplementary Table 3. The prevalence of hypoxia‐induced surge nocturnal hypertension was increased along with the SA severity (5.9% for the patients with mild SA, 19.3% for the patients with moderate SA, and 32.9% for the patients with severe SA). The concordance rate of the prevalence of the patients who were stratified as the same classification on the first and second nights was 63.8% (74 patients among 116 patients).
Figure 4.
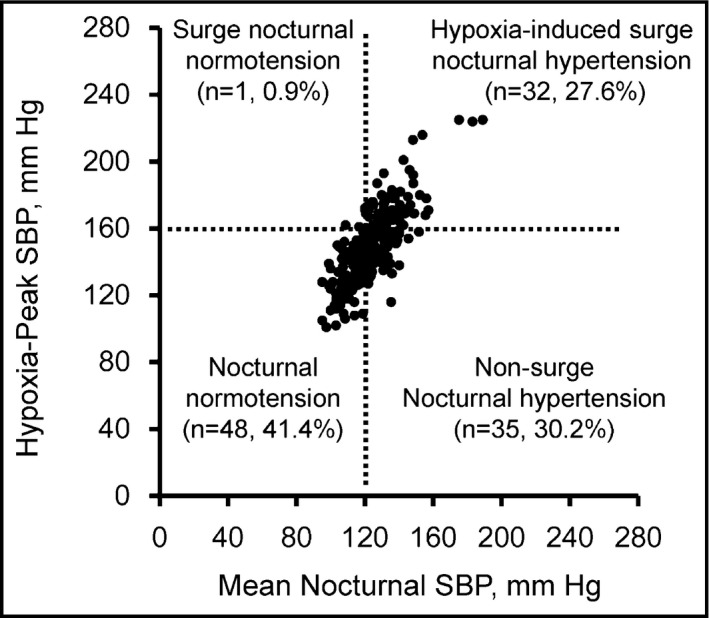
Scattered plots of nocturnal blood pressure (BP) values (n=232) in patients with different statuses of nocturnal hypertension defined by mean nocturnal systolic BP (SBP) and hypoxia‐peak SBP.
Discussion
The present study is the first to have evaluated the distribution and reproducibility of hypoxia‐triggered nocturnal BP parameters compared with those of fixed‐interval nocturnal BP parameters obtained by conventional ABPM in patients suspected of having SA. Our findings clearly demonstrated that the hypoxia‐peak SBP measured by the TNP system's novel oxygen‐triggered function was markedly higher (by approximately 25 mm Hg) and ranged more broadly than the mean nocturnal SBP measured by the same system's fixed‐interval function. We also observed that approximately one third of the patients suspected of having OSA had hypoxia‐peak SBP values >160 mm Hg, and there were some patients in whom the hypoxia‐peak SBP reached approximately 200 mm Hg even when their mean nocturnal SBP was approximately 120 to 140 mm Hg, identified as “hypoxia‐induced surge nocturnal hypertension.” Our results also demonstrated that the measurements of hypoxia‐peak SBP were as reproducible as those of mean nocturnal SBP. Together our findings indicate that hypoxia‐triggered TNP could be a promising tool to identify patients at high risk for experiencing a cardiovascular event and to monitor the BP surge‐related cardiovascular risk during sleep in OSA patients.
Clinical Implications
Repeated exaggerated BP surges may be regarded as a cause of organ damage such as left ventricular hypertrophy and as a trigger of cardiovascular events in hypertensive patients with and without OSA.22, 23, 24, 25 Therefore, lowering patients' hypoxia‐peak SBP might help suppress hypertensive target organ damage and the onset of cardiovascular events especially during sleep in OSA patients, whose cardiovascular events occurred more frequently during sleep.4, 5, 6, 7 The present study's results demonstrated that even among OSA patients with comparable levels of mean nocturnal BP, the magnitude of hypoxia‐peak SBP was quite different.
This difference might be partially explained by different degrees of baroreceptor reflex dysfunction and of sympathetic nervous activation.26, 27 In fact, catheter‐based renal denervation (which ablates the afferent and efferent sympathetic nerves around the renal artery) significantly reduced peak nocturnal BP values in drug‐resistant hypertensive patients,28 especially those with OSA.29 More directly, the hypoxia‐peak SBP detected by TNP was significantly reduced by 10 mm Hg after renal denervation.30 Another study performed in hypertensive patients with OSA showed that hypoxia‐peak SBP was significantly reduced by approximately 23 mm Hg after the administration of an antihypertension treatment, ie, the bedtime dosing of carvedilol 20 mg.17 These findings confirmed that hypoxia‐peak nocturnal BP would be triggered at least partly by the sympathetic overdrive associated with each apneic episode.
Nocturnal Hypertension with BP Variability
An international study conducted in 2014 demonstrated that nocturnal BP variability expressed as the SD of SBP values obtained by ABPM during sleep has additive predictive value for cardiovascular events and mortality.31 Thus, in addition to the mean nocturnal SBP, the SD of nighttime SBP measured by the fixed‐interval function is helpful for the assessment of cardiovascular risk. In the present study, the SD of SBP measured by the fixed‐interval function was significantly correlated with both the hypoxia‐peak SBP and the SD of SBP measured by the oxygen‐triggered function, which were induced by OSA episodes. These results indicate that some OSA patients were included in the subgroup with a high SD of SBP measured by ABPM in another study.31 Thus, the TNP system could detect these OSA‐related high‐risk patients directly, contributing to more effective individualized management of hypertension.
In this study, we divided the patients with uncontrolled nocturnal hypertension into those with uncontrolled hypoxia‐peak SBP ≥160 mm Hg (hypoxia‐induced surge nocturnal hypertension) and those with relatively controlled hypoxia‐peak SBP <160 mm Hg (nonsurge nocturnal hypertension). The prevalence of hypoxia‐induced surge nocturnal hypertension was almost one half of the total patients with nocturnal hypertension among those suspected of having OSA in this study (27.6% vs 30.2% for nonsurge nocturnal hypertension), and it was higher in the patients with more severe OSA. Further studies on the association between BPs obtained by TNP and organ damage and prognosis are necessary to clarify the clinical implications of surge nocturnal hypertension vs nonsurge nocturnal hypertension.
Reproducibility of Hypoxia‐Triggered Nocturnal BP Parameters
In the present study, we observed that the reproducibility of hypoxia‐peak SBP was substantial according to Landis's criteria. This level of repeatability, expressed as the %MV of hypoxia‐peak SBP, was almost equal to that of the nocturnal SBP (the average of nocturnal BPs) measured by ABPM in our previous study,32 which revealed that nocturnal SBP values obtained by ABPM were fairly reproducible. Thus, the present results suggest that hypoxia‐peak SBP values measured by the TNP system's oxygen‐triggered function are clinically acceptable in terms of reproducibility.
On the other hand, the reproducibility of the nocturnal SBP surge (the difference between hypoxia‐peak SBP and the average of the SBP values measured by the fixed‐interval function within 30 minutes before and after the hypoxia‐peak SBP) was not good. Because the reproducibility of hypoxia‐peak SBP was relatively good, the cause of the insufficient reproducibility of the nocturnal SBP surge may be due in part to the SBP values measured by the fixed‐interval function within 30 minutes before and after the hypoxia‐peak SBP. The minimum nocturnal SBP was also not reproducible. Because minimum nocturnal SBP was defined as just the lowest SBP among all of the nocturnal BP values measured by both the oxygen‐triggered and fixed‐interval functions, this index may not reflect the basal BP determined by the circulating volume and the structure of the arteries in the condition of the lowest sympathetic nerve activity during sleep, but it may partly reflect a reactive hypotensive reaction. If triggered BP monitoring could detect basal BP at the time of the lowest heart rate during sleep, for example, the reproducibility of this index would be improved. Moreover, in this study, there was a possibility that the BP reduction of the reaction after a temporary BP surge induced by an apnea episode might be selected as the minimum nocturnal SBP. This could also be a cause of the lack of good reproducibility of minimum nocturnal SBP.
Reproducibility of the Fixed‐Interval Nocturnal BP Parameters
It is well‐known that cardiovascular risk is more closely associated with nocturnal BP measured by ABPM than awake BP, particularly in medicated patients.33 The clinical importance of nocturnal BP measured by ABPM is thus increasingly highlighted. In the present study, the reproducibility of the nocturnal SBP (the average of all nocturnal BP values measured at fixed 30‐minute intervals) was substantially good, confirming the findings of studies that reported good reproducibility of nocturnal SBP by ABPM32, 34, 35 and that it was better than that of clinic SBP,34, 35, 36, 37 even when the patients had SAS.
In this study, the reproducibility of the SD of SBP measured by the fixed‐interval function was not good, and this finding is similar to that of a study that evaluated hypertensive patients.34 However, the reproducibility of the SD of SBP measured by the fixed‐interval function was improved when the study population was confined to the patients who had an AHI <15/h. This result might indicate that SAS per se causes poor reproducibility of the SD of SBP measured by the fixed‐interval function.
Limitations and Perspectives
The present study has some limitations. First, the patients underwent TNP monitoring with PSG only two consecutive nights. Therefore, the nocturnal BP on the first night could have been subjected to a novelty effect (or a “first‐night effect”). Indeed, all of the nocturnal BP values on the first night were higher than those on the second night. This could have led to an underestimation of the reproducibility of the data. A more appropriate study design, such as randomized sequence and a longer interval between the two recordings, could be useful for future studies. Second, the BP values obtained by the TNP system's oxygen‐triggered function were measured by a cuff inflation–based BP monitor, and thus may have been underestimated compared with the actual peak of the BP surges induced by an OSA episode. This also might have affected the reproducibility of the nocturnal BP data obtained by the oxygen‐triggered function.
In addition, this study was performed under hospital conditions. Although BP is affected by daily lifestyle factors such as alcohol intake, smoking, and exercise habit, these factors are restricted under hospital conditions. Thus, there is a possibility that the reproducibility in this study is overestimated compared with that under home conditions. To address this issue, we have introduced TNP into an information technology–based TNP management system and started monitoring the day‐by‐day variability of mean nocturnal BP and hypoxia‐related BP in patients' daily lives, in the prospective Sleep Pressure and Disordered Breathing in Resistant Hypertension and Cardiovascular Disease (SPREAD) registry study.38, 39 We expect to report the reproducibility results of TNP parameters at home in the near future. Hypertensive target organ surrogate marker data are also being collected in the SPREAD study. Further analyses of the relationships between hypoxia‐triggered nocturnal BP parameters and hypertensive surrogate markers and the determinant factors of hypoxia‐triggered nocturnal BP will also be conducted.
Conclusions
Hypoxia‐peak systolic BP values measured by triggered nocturnal BP monitoring were markedly higher (by approximately 25 mm Hg) than mean nocturnal systolic BP values measured by conventional fixed‐interval BP monitoring, and its distribution was much wider than that of the mean nocturnal SBP values. In addition, the reproducibility of the hypoxia‐peak systolic BP measurements was good and comparable to that of mean nocturnal BP measurements, even in OSA patients. Mean SBP values obtained by triggered BP monitoring, which might reflect BP load induced by hypoxia, were slightly higher than mean nocturnal systolic BP values measured by conventional fixed‐interval BP monitoring, and it was reproducible as much as mean nocturnal BP measurements. These results indicate that triggered nocturnal BP monitoring could provide potential new hemodynamic biomarkers triggered by apnea episodes, and that these biomarkers could be useful for identifying high‐risk patients and may be helpful in the treatment of OSA patients.
Supporting information
Table S1. Polysomnography parameters in each day and its reproducibility (n=147).
Table S2. Reproducibility of blood pressure and pulse rate in severe and not severe SAS groups.
Table S3. Clinical characteristics of the study patients in each classification of nocturnal hypertension (N=116).
Acknowledgments
We gratefully acknowledge Mrs Ayako Okura for her editorial support.
Disclosure
The authors have no disclosures to declare.
Funding
This research was supported by a Grant‐in‐Aid for Scientific Research (B) (21390247) from the Ministry of Education, Culture, Sports, Science and Technology (MEXT), Japan, to KK, 2009–2013, and by the MEXT‐Supported Program for the Strategic Research Foundation at Private Universities, 2011–2015.
J Clin Hypertens (Greenwich). 2017;19:30–37. DOI: 10.1111/jch.12878 © 2016 Wiley Periodicals, Inc.
References
- 1. Pedrosa RP, Drager LF, Gonzaga CC, et al. Obstructive sleep apnea: the most common secondary cause of hypertension associated with resistant hypertension. Hypertension. 2011;58:811–817. [DOI] [PubMed] [Google Scholar]
- 2. Kario K. Obstructive sleep apnea syndrome and hypertension: ambulatory blood pressure. Hypertens Res. 2009;32:428–432. [DOI] [PubMed] [Google Scholar]
- 3. Kario K. Obstructive sleep apnea syndrome and hypertension: mechanism of the linkage and 24‐h blood pressure control. Hypertens Res. 2009;32:537–541. [DOI] [PubMed] [Google Scholar]
- 4. Gami AS, Howard DE, Olson EJ, Somers VK. Day‐night pattern of sudden death in obstructive sleep apnea. N Engl J Med. 2005;352:1206–1214. [DOI] [PubMed] [Google Scholar]
- 5. Kuniyoshi FH, Garcia‐Touchard A, Gami AS, et al. Day‐night variation of acute myocardial infarction in obstructive sleep apnea. J Am Coll Cardiol. 2008;52:343–346. [DOI] [PMC free article] [PubMed] [Google Scholar]
- 6. Kario K, Morinari M, Murata M, et al. Nocturnal onset ischemic stroke provoked by sleep‐disordered breathing advanced with congestive heart failure. Am J Hypertens. 2004;17:636–637. [DOI] [PubMed] [Google Scholar]
- 7. Yoshida T, Kuwabara M, Hoshide S, Kario K. Recurrence of stroke caused by nocturnal hypoxia‐induced blood pressure surge in a young adult male with severe obstructive sleep apnea syndrome. J Am Soc Hypertens. 2016;10:201–204. [DOI] [PubMed] [Google Scholar]
- 8. Staessen JA, Thijs L, Fagard R, et al. Predicting cardiovascular risk using conventional vs ambulatory blood pressure in older patients with systolic hypertension. Systolic Hypertension in Europe Trial Investigators. JAMA 1999;282:539–546. [DOI] [PubMed] [Google Scholar]
- 9. Kario K, Pickering TG, Matsuo T, et al. Stroke prognosis and abnormal nocturnal blood pressure falls in older hypertensives. Hypertension. 2001;38:852–857. [DOI] [PubMed] [Google Scholar]
- 10. Fagard RH, Van Den Broeke C, De Cort P. Prognostic significance of blood pressure measured in the office, at home and during ambulatory monitoring in older patients in general practice. J Hum Hypertens. 2005;19:801–807. [DOI] [PubMed] [Google Scholar]
- 11. Kikuya M, Ohkubo T, Asayama K, et al. Ambulatory blood pressure and 10‐year risk of cardiovascular and noncardiovascular mortality: the Ohasama study. Hypertension. 2005;45:240–245. [DOI] [PubMed] [Google Scholar]
- 12. Shirasaki O, Yamashita S, Kawara S, et al. A new technique for detecting sleep apnea–related “midnight” surge of blood pressure. Hypertens Res. 2006;29:695–702. [DOI] [PubMed] [Google Scholar]
- 13. Shirasaki O, Kuwabara M, Saito M, et al. Development and clinical application of a new technique for detecting ‘nocturnal blood pressure surges’ in sleep apnea patients based on a variable desaturation threshold. Hypertens Res. 2011;34:922–928. [DOI] [PubMed] [Google Scholar]
- 14. Kuwabara M, Kario K. Development of a triggered nocturnal blood pressure monitoring which detects nighttime blood pressure surges in sleep apnea syndrome. Curr Hypertens Rev. 2016;12:27–31. [DOI] [PubMed] [Google Scholar]
- 15. Kario K, Hamasaki H. Nocturnal blood pressure surge behind morning surge in obstructive sleep apnea syndrome: another phenotype of systemic semodynamic atherothrombotic syndrome. J Clin Hypertens (Greenwich). 2015;17:682–685. [DOI] [PMC free article] [PubMed] [Google Scholar]
- 16. Viera AJ, Hinderliter AL. Validation of the HEM‐780REL with easy wrap cuff for self‐measurement of blood pressure according to the European society of hypertension international protocol. Blood Press Monit. 2007;12:335–338. [DOI] [PubMed] [Google Scholar]
- 17. Kario K, Kuwabara M, Hoshide S, et al. Effects of nighttime single‐dose administration of vasodilating vs sympatholytic antihypertensive agents on nocturnal blood pressure in hypertensive patients with sleep apnea syndrome. J Clin Hypertens (Greenwich). 2014;16:459–466. [DOI] [PMC free article] [PubMed] [Google Scholar]
- 18. Winzner B, Dechering DG, Thijs L, et al. Short‐term and long‐term repeatability of the morning blood pressure in older patients with isolated systolic hypertension. J Hypertens. 2008;26:1328–1335. [DOI] [PubMed] [Google Scholar]
- 19. American Academy of Sleep Medicine: International Classification of Sleep Disorders. 3rd ed. Darien, CT;2014. [Google Scholar]
- 20. Agnew HW, Webb WB, Williams R. The first night effect: an EEG study. Psychophysiology. 1966;2:263–266. [DOI] [PubMed] [Google Scholar]
- 21. Landis JR, Koch GG. The measurement of observer agreement for categorical data. Biometrics. 1977;33:159–174. [PubMed] [Google Scholar]
- 22. Bradley TD, Floras JS. Sleep apnea and heart failure: part I: obstructive sleep apnea. Circulation. 2003;107:1671–1678. [DOI] [PubMed] [Google Scholar]
- 23. Tanriverdi H, Evrengul H, Kaftan A, et al. Effect of obstructive sleep apnea on artic elastic parameters ‐relationship to left ventricular mass and function. Circ J. 2006;70:737–743. [DOI] [PubMed] [Google Scholar]
- 24. Kario K. Prognosis in relation to blood pressure variability: pro side of the argument. Hypertension. 2015;65:1163–1169. [DOI] [PubMed] [Google Scholar]
- 25. Sampol G, Remero O, Salas A, et al. Obstructive sleep apnea and thoracic aorta dissection. Am J Respir Crit Care Med. 2003;168:1528–1531. [DOI] [PubMed] [Google Scholar]
- 26. Parati G, Rienzo MD, Bonsignore MR, et al. Autonomic cardiac regulation in obstructive sleep apnea syndrome: evidence from spontaneous baroreflex analysis during sleep. J Hypertens. 1997;15:1621–1626. [DOI] [PubMed] [Google Scholar]
- 27. Conway J, Boon N, Jones JV, Sleight P. Involvement of the baroreceptor reflexes in the changes in blood pressure with sleep and mental arousal. Hypertension. 1983;5:746–748. [DOI] [PubMed] [Google Scholar]
- 28. Kario K, Bhatt DL, Brar S, et al. Effect of catheter‐based renal denervation on morning and nocturnal blood pressure. Insights from SYMPLICITY HTN‐3 and SYMPLICITY HTN‐Japan. Hypertension. 2015;66:1130–1137. [DOI] [PubMed] [Google Scholar]
- 29. Kario K, Bhatt DL, Kandzari DE, et al. Impact of renal denervation on patients with obstructive sleep apnea and resistant hypertension: insights from the SYMPLICITY HTN‐3 trial. Circ J. 2016;80:1404–1412. [DOI] [PubMed] [Google Scholar]
- 30. Kario K, Ikemoto T, Kuwabara M, et al. Catheter‐based renal denervation reduces hypoxia‐triggered nocturnal blood pressure peak in obstructive sleep apnea syndrome. J Clin Hypertens (Greenwich). 2016;18:707–709. [DOI] [PMC free article] [PubMed] [Google Scholar]
- 31. Palatini P, Reboldi G, Beilin LJ, et al. Added predictive value of night‐time blood pressure variability for cardiovascular events and mortality the ambulatory blood pressure–international study. Hypertension. 2014;64:487–493. [DOI] [PubMed] [Google Scholar]
- 32. Eguchi K, Hoshide S, Hoshide Y, et al. Reproducibility of ambulatory blood pressure in treated and untreated hypertensive patients. J Hypertens. 2010;28:918–924. [DOI] [PubMed] [Google Scholar]
- 33. Boggia J, Li Y, Thijs L, et al. International database on ambulatory blood pressure monitoring in relation to cardiovascular outcomes (IDACO) investigators. Prognostic accuracy of day versus night ambulatory blood pressure: a cohort study. Lancet. 2007;370:1219–1229. [DOI] [PubMed] [Google Scholar]
- 34. Fotherby MD, Potter JF. Reproducibility of ambulatory and clinic blood pressure measurements in elderly hypertensive subjects. J Hypertens. 1993;11:573–579. [DOI] [PubMed] [Google Scholar]
- 35. Mansoor GA, McCabe EJ, White WB. Long‐term reproducibility of ambulatory blood pressure. J Hypertens. 1994;12:703–708. [PubMed] [Google Scholar]
- 36. Emelianov D, Thijs L, Staessen JA, et al. Conventional and ambulatory measurements of blood pressure in old patients with isolated systolic hypertension: baseline observations in the Syst‐Eur trial. Blood Press Monit. 1998;3:173–180. [PubMed] [Google Scholar]
- 37. Stergiou GS, Baibas NM, Gantzarou AP, et al. Reproducibility of home, ambulatory, and clinic blood pressure: implications for the design of trials for the assessment of antihypertensive drug efficacy. Am J Hypertens. 2002;15(2 pt 1):101–104. [DOI] [PubMed] [Google Scholar]
- 38. Kario K. Proposal of a new strategy for ambulatory blood pressure profile‐based management of resistant hypertension in the era of renal denervation. Hypertens Res. 2013;36:478–484. [DOI] [PubMed] [Google Scholar]
- 39. Kario K. Evidence and perspectives on the 24‐hour management of hypertension: hemodynamic biomarker‐initiated ‘anticipation medicine’ for zero cardiovascular event. Prog Cardiovasc Dis. 2016;59:262–281. [DOI] [PubMed] [Google Scholar]
Associated Data
This section collects any data citations, data availability statements, or supplementary materials included in this article.
Supplementary Materials
Table S1. Polysomnography parameters in each day and its reproducibility (n=147).
Table S2. Reproducibility of blood pressure and pulse rate in severe and not severe SAS groups.
Table S3. Clinical characteristics of the study patients in each classification of nocturnal hypertension (N=116).