

Abstract
The use of pulse wave analysis may guide the provider in making choices about blood pressure treatment in prehypertensive or hypertensive patients. However, there is little clinical guidance on how to interpret and use pulse wave analysis data in the management of these patients. A panel of clinical researchers and clinicians who study and clinically use pulse wave analysis was assembled to discuss strategies for using pulse wave analysis in the clinical encounter. This manuscript presents an approach to the clinical application of pulse waveform analysis, how to interpret central pressure waveforms, and how to use existing knowledge about the pharmacodynamic effect of antihypertensive drug classes in combination with brachial and central pressure profiles in clinical practice. The discussion was supplemented by case‐based examples provided by panel members, which the authors hope will provoke discussion on how to understand and incorporate pulse wave analysis into clinical practice.
This manuscript arose from a workshop sponsored by North American Artery (www.naartery.com) held in New York City in December 2013. The goal of the workshop was to assemble a panel of researchers and clinicians to address the role of pulse wave analysis (PWA) in the clinic setting. The discussion centered on a review of the physiology of the pulse wave, when measurement of the pulse wave contour could help inform clinical decision making, how to interpret the results, and what therapy to consider based on the results.
Physiology of the Pulse Wave Contour
Each heart beat generates a pulse wave that travels forward in the circulation, increasing pulsatile pressure and flow. This pulse wave encounters changes that occur in its path, which present challenges to forward transmission, including changes in vessel caliber, branching, turns, plaque, and in the very nature of the arterial wall itself that generates wave reflection. This results in reflected waves, which travel retrograde from their origin, usually at abrupt changes in vascular resistance or at bifurcation points, toward the heart. Multiple tiny reflected waves sum into a composite reflected wave that impacts the shape of the aortic pressure wave (which ultimately is the sum of the forward and backward wave) as shown in Figure 1.
Figure 1.
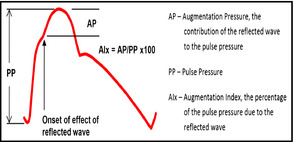
Idealized central aortic pressure waveform. Left ventricle ejection initiates the pressure wave. The return of the reflected wave before the conclusion of systole generates a deflection in the systolic contour upstroke (marked with the arrow) and produces an augmentation in the pressure profile. The total excursion of the pressure wave (PP) is the central pulse pressure. AP indicates augmentation pressure; AIx, augmentation index.
The reflected wave predominantly affects the systolic pulse wave contour as the mean and diastolic arterial pressures change very little, traveling from the heart to the microcirculation. Empirically, this has been repeatedly verified in multiple mammalian species by placing a pressure‐sensing wire or catheter at the aortic valve, recording the waveform and the pressures generated, then withdrawing it gradually to the femoral insertion site, stopping periodically to again sample the waveform (Figure 2). The amount of change in the systolic component of the pressure wave as it travels in the major arteries such as the aorta varies remarkably between individuals and is modified by sex, height, heart rate, and age.1
Figure 2.
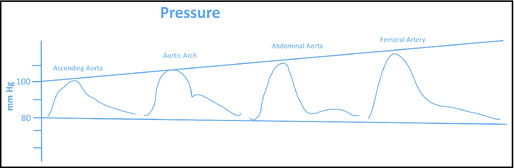
Changes in contour and magnitude as the blood pressure wave moves distally. Published from Nichols et al.14
As an example, in a young, healthy man, the difference in systolic pressure at the proximal aorta compared with the brachial artery may be more than 25 mm Hg, while in an elderly healthy woman it may be as little as 4 mm Hg to 6 mm Hg. This individual variability in the amplification of the systolic pressure as the pressure waveform travels from the proximal aorta to the periphery may be an important factor in understanding the heterogeneity of outcomes in trials in which individuals with the same level of brachial systolic blood pressure (BP) may have very different aortic pressures. The differences in the amplification of systolic BP are not readily apparent from the brachial systolic and diastolic BPs. However, analysis of the brachial or radial artery pressure waveform can be used to estimate the central aortic pressure waveform using a validated algorithm,2 thus providing information on the pressure load experienced by the left ventricle. A primary objective of the workshop was to determine how that information might be used to assist in the management of high BP, particularly in situations in which management decisions were not clear.
Several devices are available that allow the noninvasive recording of the arterial waveform and the generation of a proximal aorta pressure profile. These devices have, in general, been validated in catheterization laboratories and when accurately calibrated have been shown to be within 1 mm Hg to 2 mm Hg of the actual pressure in the proximal aorta.3 This use of the BP waveform is in line with the CPT code issued in 2013 (0311T) “Non‐invasive calculation and analysis of central arterial pressure waveforms with interpretation and report.” It should be noted that the intention of this group was not to recommend replacing brachial pressure with central pressure in the management of BP. Such a replacement is not yet supported by sufficient evidence from randomized clinical trials. Our intent was to determine how information from the central pressure and the analysis of the central pressure waveform provides additional information to physicians managing BP beyond current brachial BP goals. Pulse waveforms can be obtained either using a tonometer (handheld or stationary), which captures the radial artery waveform, or by oscillometric methods, which use a cuff encircling the limb. Both methods produce a waveform, either from the brachial (oscillometric) or radial (tonometric) arteries, which is usually subjected to a general transfer algorithm to produce a central pressure profile. A typical duration of waveform capture is on the order of 10 seconds.
When Could PWA Help in Decision‐Making?
The discussion here was predicated on the need to begin with an office brachial BP. No panel member felt that PWA would replace brachial BP measures currently. This question was addressed by consideration of clinical cases where PWA was used in a clinical scenario to guide decision‐making for altering, or not altering, therapy in patients with hypertension. The situations where PWA may be useful to aid clinical decision‐making include:
Deciding whether to initiate, intensify, or change therapy in younger, asymptomatic individuals with systolic hypertension
Deciding on which class of antihypertensive agent to add when another medication is needed based on the brachial BP
Deciding on whether a change in a previous office encounter has had as desirable effect on central pressure as it may have had on brachial BP
Interpreting Waveforms
This section is a summary of what the workshop attendees felt were the most useful components of central pressure waveforms.
Waveform Quality
Prior to clinically interpreting the central pressures it is important to assess the quality of the measured waveform. Most devices often provide an assessment of the quality of the waveform by a series of variability parameters or an operator index. However, the panel felt that visual inspection of the waveform was also important. An example of a good‐quality waveform is illustrated in Figure 3 and one of a poor‐quality waveform is given in Figure 4 (left panels are radial and right panels are central waveforms).
Figure 3.
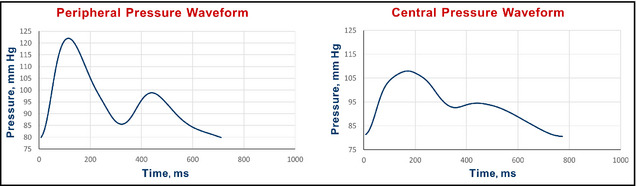
Example of a good‐quality pulse wave analysis study.
Figure 4.
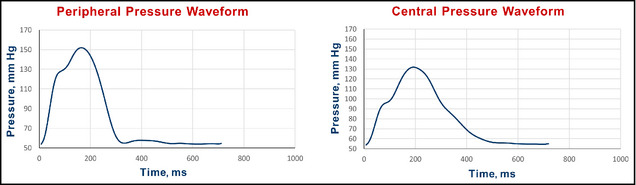
Example of a poor‐quality pulse wave analysis waveform. A normal radial artery upstroke (the left side of Figure 4) should not have a deviation mid segment as shown just above 110 mm Hg. Such deviations are likely secondary to the tonometer being slightly off‐center in alignment to the radial artery. The diastolic portion is also flattened as a result of too great a pressure on the tonometer used to obtain the radial waveform.
Validation and Reproducibility
Knowing that a central waveform accurately reflects measured central pressures is most useful when either an invasive calibration, or demonstration of comparability to a device that was validated invasively, is available.4, 5 When using these devices in the clinic, it is useful to know what kind of validation studies have been undertaken to assure the clinician that the central pressure waveform appearing in the readout is reasonably representative of an invasively measured pressure waveform and how reproducible the measurements are when repeated within a short period, such as the minutes within a clinical encounter.6, 7, 8
Clinically Important Information in the Waveform
The panel discussed what to extract from the waveform that might be of clinical utility. Referring to the idealized aortic waveform in Figure 1, the magnitude of amplification in the pulse pressure from the central to the peripheral circulation was felt to be useful.9, 10 A typical increase is ≥30% (ie, brachial pulse pressure/central pulse pressure >1.3). However, this value is greatly affected by age, being higher in younger and lower in older people, and is also affected by heart rate and sex. Several publications propose reference ranges for central pressure amplification, which are linked to age and sex.11, 12
Next was the level of central systolic pressure, per se. The panel used a central systolic value of 124 mm Hg as a reasonable upper limit of normal, as found in some longitudinal cohorts to correspond to a brachial value of about 140 mm Hg, acknowledging that this is influenced by age. The reference paper by Herbert and colleagues11 was published after our meeting, which recommended values of 126 mm Hg in women and 122 mm Hg in men, very close to the 124 mm Hg used by the panel. We note that this threshold may be too low for older patients, who (in the absence of vasoactive therapy) usually demonstrate little pulse pressure amplification, such that brachial systolic pressure is close to central systolic pressure. However, this is a reasonable threshold for younger patients (younger than 50 years) with isolated systolic hypertension based on brachial readings, among whom a threshold to define “central hypertension” may be clinically useful (please refer to section: “When Could Pulse Wave Analysis Help in Decision‐Making?” above). Similarly, this threshold may be regarded as a “desirable” central systolic pressure value in younger and older patients who are being treated with antihypertensive medications.
The panel also discussed the value of the augmentation index (AIx; see Figure 1) derived by dividing the augmentation pressure by the central pulse pressure. In Figure 1, for example, if the augmentation pressure was 10 mm Hg and the central pulse pressure was 40 mm Hg, the AIx would be 25%. Again, this value is strongly linked to age and sex. The panel's impression was that rather than absolute levels, changes in AIx were more useful. In general, interventions that reduce the AIx are more likely to demonstrate benefit as compared with interventions that increase the AIx.
What to Consider Based on the Results
There is a large body of literature that provides clinical guidance on the effects of antihypertensive agents on the central BP profile. Nuances of clinical pharmacodynamics within classes, particularly with the β‐blocking drugs, will drive heterogeneity of effects, therefore, it is important to measure the central changes after an intervention to provide assurance that the results are in the direction expected. The Table 1 presents the expected direction of changes, and their magnitude, on central pressure profile.
Table 1.
General Effects of Antihypertensive Drugs on Central Pressures
| Central Systolic Pressure | Augmentation Index | |
|---|---|---|
| Angiotensin receptor blockers | ↓↓ | ↓↓ |
| Angiotensin‐converting enzyme inhibitors | ↓↓ | ↓↓ |
| β‐Blockers | ↓ or <–> | ↑ |
| Calcium channel blockers | ↓↓ | ↓↓ |
| Diuretics | ↓ | ↓ |
| Organic nitrates | ↓↓ | ↓↓↓↓ |
In the examples that follow, we used real cases obtained with several PWV devices using different iterations of software. In each example given, an interpretation follows that will orient the reader to the salient central pressure profile features of each case. The panel was cognizant of the different software programs and versions used, but, in each clinical case, the essential information available is reviewed in the interpretation section to keep the reader oriented.
Clinical Case Examples
Case 1: Persistent Systolic Hypertension on a Single Agent
Clinical Question: Increase Dose or Add Other Medication?
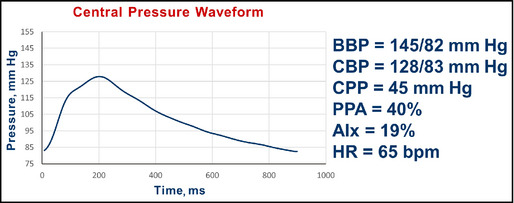
Data: A 33‐year‐old man started on an ACE inhibitor for systolic and diastolic hypertension 1 year ago. He is tolerating medication well and his physical examination today is unremarkable. There are no comorbidities and he is a nonsmoker. In the clinic today, the brachial BP is 144/74 mm Hg (average of three readings, seated). Results from electrocardiography were normal 1 year ago. Figure 5 shows his radial and central aortic pressure profiles.
Figure 5.
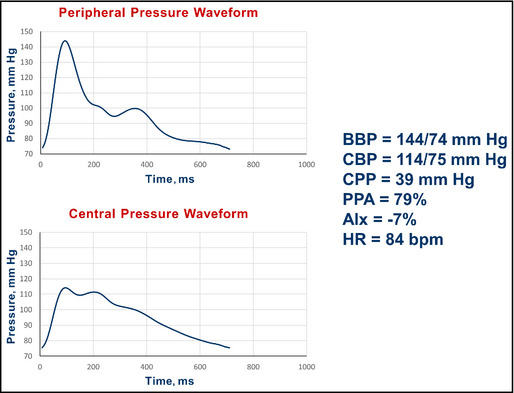
Pulse wave analysis in a 33‐year‐old Caucasian man with persistent systolic hypertension. BBP indicates brachial blood pressure systolic/diastolic; CBP, central blood pressure systolic/diastolic; CPP, central pulse pressure; PPA, pulse pressure amplification; AIx, augmentation index; HR, heart rate; bpm, beats per minute.
Rx: Ramipril 10 mg daily.
Initial PWA is shown in Figure 5.
Interpretation: The central systolic BP of 114 mm Hg is 10 mm Hg less than the proposed upper limit of 124 mm Hg. He has a pulse pressure amplification of 79%. The central pressure profile was interpreted as supporting current management, and his medication was not increased.
Summary: This instance shows a case of persistent brachial systolic hypertension on therapy with acceptable central pressure readings. The central pressure readings provided support for not altering current management. As acknowledged by the authors above, the intent here is not to overrule brachial BP management, but to allow the use of clinical judgment in decision‐making in select clinical scenarios, as recommended in the JNC 8 document.13
Case 2: Untreated Hypertensive Patient
Clinical Question: Initiate Drug Therapy?
Data: A 41‐year‐old sedentary man with an office pressure of 142/64 mm Hg. No comorbidities.
Rx: None.
Initial PWA is presented in Figure 6.
Figure 6.
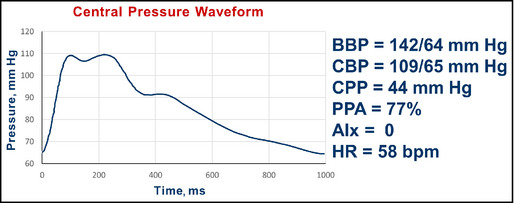
Pulse wave analysis in an unmedicated 41‐year‐old man. BBP indicates brachial blood pressure systolic/diastolic; CBP, central blood pressure systolic/diastolic; CPP, central pulse pressure; AIx, augmentation index; HR, heart rate; bpm, beats per minute.
Interpretation: The substantial pulse pressure amplification (brachial 78 mm Hg/central 44 mm Hg; 77%) and the central systolic BP <124 mm Hg argues against drug therapy. An exercise regimen was recommended and followed. He returned 3 months later (Figure 7).
Figure 7.
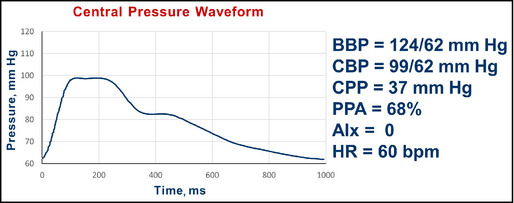
Follow‐up pulse wave analysis in an unmedicated 41‐year‐old man. BBP indicates brachial blood pressure systolic/diastolic; CBP, central blood pressure systolic/diastolic; CPP, central pulse pressure; AIx, augmentation index; HR, heart rate; bpm, beats per minute.
Interpretation: He returns with brachial systolic pressure improvement and continued substantial pulse pressure amplification (brachial 62 mm Hg/central 37 mm Hg; 68%). No additional pharmacologic therapies were prescribed and he was encouraged to continue the exercise program.
Summary: This instance provided support for two clinical decisions. One was not to pharmacologically treat the modest brachial systolic pressure elevation. The other was to support the value of exercise, which resulted in brachial BP improvement without loss of the advantageous central pressure profile.
Case 3: Hypertensive With Comorbidity
Clinical Question: Alter Regimen?
Data: A 64‐year‐old man, first evaluated in 2013, who smoked, had a history of heart attack, and placement of two coronary stents. Brachial BP is 151/78 mm Hg.
Rx: Metoprolol XL 200 mg daily, hydralazine 100 mg twice daily, lisinopril 20 mg daily, furosemide 20 mg daily, and atorvastatin 40 mg daily.
Initial PWA is shown in Figure 8.
Figure 8.
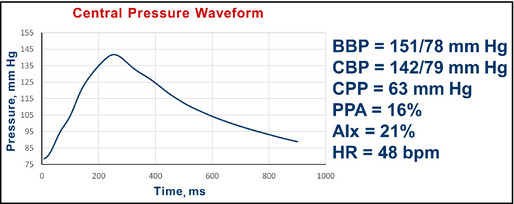
Pulse wave analysis in a 64‐year‐old smoker with comorbidity and hypertension. BBP indicates brachial blood pressure systolic/diastolic; CBP, central blood pressure systolic/diastolic; CPP, central pulse pressure; AIx, augmentation index; HR, heart rate; bpm, beats per minute.
Interpretation: The central pressure profile indicated a pulse pressure amplification of 16% (less than the desired value of 30%). The central systolic pressure of 142 mm Hg is more than 124 mm Hg. The AIx was 21%.
Intervention: During follow‐up, a number of changes in medications were made, as well as advice to stop smoking. The goal of the medication changes was to reduce brachial systolic to <140 mm Hg, increase pulse pressure amplification, and reduce central systolic pressure to <124 mm Hg. β‐Blockers tend to blunt amplification and the dose of the β‐blocker was gradually reduced. Furosemide was changed to indapamide, a longer‐acting diuretic. A calcium channel blocker (CCB) was initiated and the ACE inhibitor was changed, with the dose increased and then merged with the CCB in a fixed‐dose combination. In addition, counseling on cigarette smoking was provided. These changes were made gradually over the ensuing 8 months.
Rx at follow‐up (8 months later): Metoprolol XL 25 mg daily, amlodipine/benazepril 10 mg/40 mg daily, spironolactone 25 mg daily, and indapamide 1.25 mg daily. The patient ceased cigarette smoking and a follow‐up PWV study was obtained (Figure 9).
Figure 9.
Follow‐up pulse wave analysis in a 64‐year‐old ex‐smoker with comorbidity and hypertension. BBP indicates brachial blood pressure systolic/diastolic; CBP, central blood pressure systolic/diastolic; CPP, central pulse pressure; AIx, augmentation index; HR, heart rate; bpm, beats per minute.
Interpretation: The central pressure profile indicates that pulse pressure amplification has increased from 16% to 40%. The central systolic pressure of 128 mm Hg is closer to the desired value of 124 mm Hg. The AIx was lowered slightly from 21% to 19% (from the software, not shown in the figure). In the 8‐month interval, the heart rate is now 65 beats per minute (increased from 48 beats per minute).
Summary: The initial brachial pressures were in need of attention. Changes were made in the antihypertensive regimen with a goal of maintaining some β‐blockade but to increase the vasodilatory aspect of the regimen, relying especially on the central pressure–lowering effects of ACE inhibitors and dihydropyridine CCBs.
Case 4: Uncontrolled Hypertension
Clinical Question: Add or Titrate, and What Medication?
Data: A 45‐year‐old man with diabetes, obesity, and hypertension. Office BP recorded as 174/104 mm Hg.
Rx: Metformin 1 g twice daily, perindopril 5 mg daily, and indapamide 1.25 mg daily.
Initial PWA is shown in Figure 10.
Figure 10.
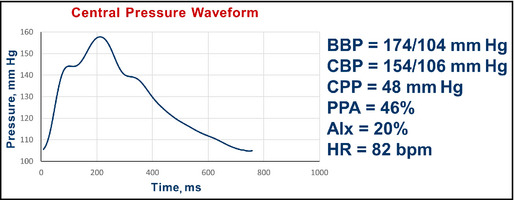
Pulse wave analysis in a 45‐year‐old man with diabetes, obesity, and hypertension. BBP indicates brachial blood pressure systolic/diastolic; CBP, central blood pressure systolic/diastolic; CPP, central pulse pressure; AIx, augmentation index; HR, heart rate; bpm, beats per minute.
Interpretation: The central pressure profile indicated a pulse pressure amplification of 46%. The central systolic pressure of 154 mm Hg is more than the desired value of 124 mm Hg. The AIx was 20%.
Intervention: The first step taken to treat the elevated brachial BP, given the heart rate of 82 beats per minute, was the use of atenolol 50 mg daily. The patient returned 3 weeks later taking atenolol, perindopril, and indapamide, and the pulse waveform analysis showed the pattern (Figure 11.
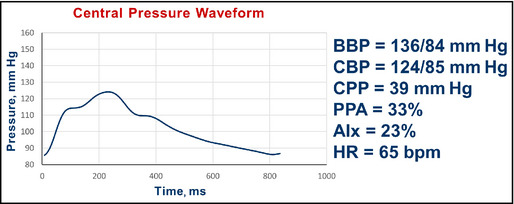
Figure 11.
Pulse wave analysis in a 45‐year‐old man with diabetes, obesity, and hypertension after addition of atenolol. BBP indicates brachial blood pressure systolic/diastolic; CBP, central blood pressure systolic/diastolic; CPP, central pulse pressure; AIx, augmentation index; HR, heart rate; bpm, beats per minute.
Interpretation: Predictably (see Table 1), although the brachial BP improved, the pulse pressure amplification fell from 46% to 20%. The central systolic pressure of 147 mm Hg remains more than the desired value of 124 mm Hg. The AIx increased from 20% to 32%.
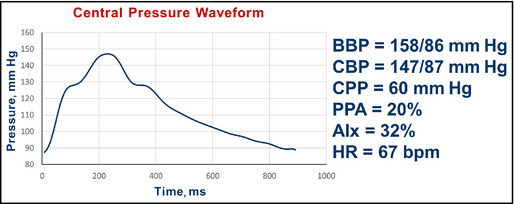
Intervention: Improvement in the brachial pressure was attended by less desirable changes in the central pressure profile. Amlodipine was added to reduce brachial pressure further and to offset the changes in central pressure from atenolol treatment. The third measurement is shown in Figure 12.
Figure 12.
Pulse wave analysis in a 45‐year‐old man with diabetes, obesity, and hypertension after addition of atenolol and subsequent addition of amlodipine. BBP indicates brachial blood pressure systolic/diastolic; CBP, central blood pressure systolic/diastolic; CPP, central pulse pressure; AIx, augmentation index; HR, heart rate; bpm, beats per minute.
Interpretation: The brachial BP improved further and the central pulse pressure amplification is 33%. The central systolic pressure of 124 mm Hg is near the desired value of 124 mm Hg. The AIx fell from 32% to 23%. No further changes were made.
Summary: This example shows the added value of central pressure measurements in a circumstance where improvement in brachial pressure is not attended by a parallel improvement in central pressures.
Case 5: Uncontrolled Hypertension With Diabetes
Clinical Question: Medication Adjustment in a Complex Regimen
Data: A 58‐year‐old African American woman with diabetes mellitus and hypertension. Her brachial BP while seated was 220/103 mm Hg, with a heart rate of 70 beats per minute.
Rx: Amlodipine 10 mg daily, clonidine patch #2 once weekly, lisinopril 20 mg daily, rosiglitazone 30 mg daily, metformin 1000 mg daily, simvastatin 20 mg daily, and aspirin 81 mg daily.
Initial PWA is shown in Figure 13.
Figure 13.
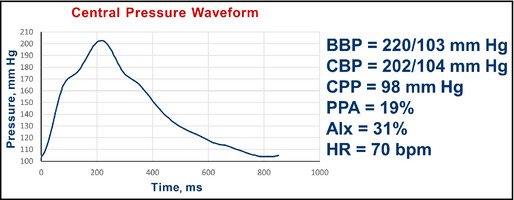
Pulse wave analysis in a 58‐year‐old African American woman with diabetes and hypertension. BBP indicates brachial blood pressure systolic/diastolic; CBP, central blood pressure systolic/diastolic; CPP, central pulse pressure; AIx, augmentation index; HR, heart rate; bpm, beats per minute.
Interpretation: The central pressure profile indicated a pulse pressure amplification of 19%. The central systolic pressure of 202 mm Hg is much more than the desired value of 124 mm Hg. The AIx was 31%. In this case, there is a clear second peak in the aortic pressure contour just above 170 mm Hg with a systolic pressure of 202 mm Hg. This indicates that about 30 mm Hg of the 98 mm Hg, ie, AIx of approximately 31%, central pulse pressure is augmented pressure.
Intervention: The approach emphasized vasodilation while trying to preserve heart rate to improve pulse pressure amplification while reducing brachial BP. The nitric oxide–promoting β‐blocker nebivolol 5 mg was started, amlodipine dosage (after discussion with the patient) was increased to 20 mg daily, and combination hydrochlorothiazide/spironolactone 25 mg/25 mg was added. Her clonidine patch was tapered and discontinued. The changes in the PWA are shown in Figure 14.
Figure 14.
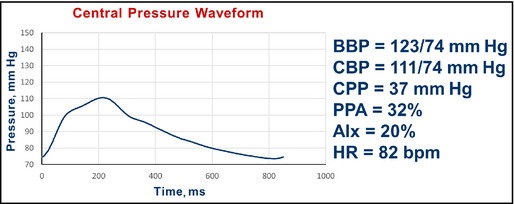
Pulse wave analysis in a 58‐year‐old African American woman with diabetes and hypertension after the addition of nebivolol and a diuretic, along with increase in amlodipine. BBP indicates brachial blood pressure systolic/diastolic; CBP, central blood pressure systolic/diastolic; CPP, central pulse pressure; AIx, augmentation index; HR, heart rate; bpm, beats per minute.
Interpretation: The central pressure profile now shows a pulse pressure amplification of 32%. The central systolic pressure of 111 mm Hg is less than the desired value of 124 mm Hg. The AIx was reduced from 31% to 20%. No further changes were made.
Summary: In this instance, the central pressure profile was used to help guide alteration of her regimen, which included the addition of a β‐blocker and other changes, without the loss of a desirable central pressure profile.
Case 6: Hypertensive Patient With Chronic Kidney Disease
Clinical Question: Altering Therapy in the Presence of Kidney Failure and Low Diastolic BP
Data: A 70‐year‐old woman with hypertension and chronic kidney disease stage 4 (estimated glomerular filtration rate 28 mL/min/1.73 m2). Brachial BP was 177/56 mm Hg with a hear rate of 46 beats per minute.
Rx: Chlorthalidone 25 mg daily, carvedilol CR 20 mg daily, and lisinopril 20 mg daily.
Initial PWA is shown in Figure 15.
Figure 15.
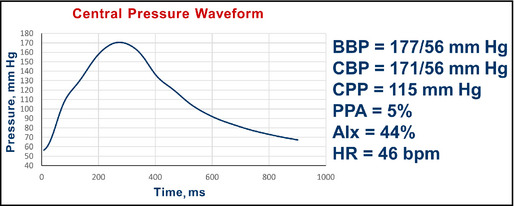
Pulse wave analysis in a 70‐year‐old woman with hypertension and chronic kidney disease. BBP indicates brachial blood pressure systolic/diastolic; CBP, central blood pressure systolic/diastolic; CPP, central pulse pressure; AIx, augmentation index; HR, heart rate; bpm, beats per minute.
Interpretation: The central pressure profile indicated a pulse pressure amplification of 5%. The central systolic pressure of 171 mm Hg is higher than the desired value of <124 mm Hg. The AIx is about 44%. In this case, the onset of the second peak is found in the aortic pressure contour at approximately 120 mm Hg. With a central pulse pressure of 115 mm Hg, this indicates that about 51 mm Hg of the 115 mm Hg, ie, an AIx of approximately 44%, central pulse pressure is augmented pressure.
Intervention: Acknowledging that the patient was already taking several medications and had low diastolic BP, the physician remained concerned about poor central pulse pressure amplification and the high brachial systolic pressure; therefore, amlodipine 5 mg daily was added, with the intention to lower brachial and central pressures but not heart rate. Follow‐up study showed the waveform (Figure 16).
Figure 16.
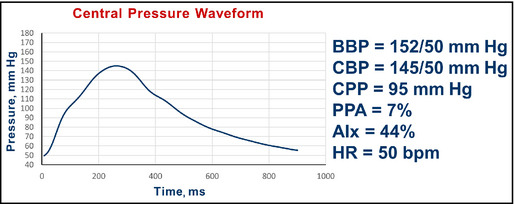
Pulse wave analysis in a 70‐year‐old woman with hypertension and chronic kidney disease after amlodipine. BBP indicates brachial blood pressure systolic/diastolic; CBP, central blood pressure systolic/diastolic; CPP, central pulse pressure; AIx, augmentation index; HR, heart rate; bpm, beats per minute.
Interpretation: The central pressure profile indicated virtually no change in pulse pressure amplification, which was 5% and is now 7%. The central systolic pressure of 145 mm Hg remained higher than the desired value of 124 mm Hg. The AIx remained at about 44%. At this time, the physician decided that 50 mm Hg of diastolic pressure was the limit she felt comfortable accepting and no further changes were made.
Summary: In this case, the addition of amlodipine produced an expected disproportionate decline in brachial systolic (25 mm Hg) compared with brachial diastolic (6 mm Hg) BP. Changes in the central pressure profile from the PWV provided assurance that the central pressure declined in parallel with brachial pressure. However, the central systolic pressure remained above desirable levels. The addition of vasoactive agents that selectively reduce central pressures without profoundly reducing mean arterial pressure or diastolic pressure (such as organic nitrates) may have desirable hemodynamic consequences on central hemodynamics in this context. However, no clinical guidance exists regarding the use of such agents in this setting. This should be the focus of future research.
Conclusions
These six cases are not meant to be the definitive ways to manage hypertensive patients, but are presented as examples of how central pressure monitoring can supplement routine brachial BP readings. There is little in terms of practical guidance in the published literature, outside of research studies, on using central pressure readings clinically. Our hope is that this manuscript fosters discussion and learning about this aspect of clinical hemodynamics. In addition, we hope it leads to the development and testing of therapies that may have greater central than peripheral BP effects, such as organic nitrates, in outcome trials.
Disclosures
This symposium was supported by an unrestricted grant to North American Artery from AtCor Medical, which covered travel costs and a small stipend for attendees. RRT: National Institutes of Health grant in a relevant area; HRB, JAC, PUF, KCF, MG, CR, SPS, and JAS: nothing to declare.
J Clin Hypertens (Greenwich). 2015;17:503–513. DOI: 10.1111/jch.12574. © 2015 Wiley Periodicals, Inc.
References
- 1. McEniery CM, Yasmin, McDonnell B, et al. Central pressure: variability and impact of cardiovascular risk factors. The Anglo‐Cardiff collaborative trial II. Hypertension. 2008;51:1476–1482. [DOI] [PubMed] [Google Scholar]
- 2. O'Rourke MF, Gallagher DE. Pulse wave analysis. J Hypertens Suppl. 1996;14:S147–S157. [PubMed] [Google Scholar]
- 3. Pauca AL, O'Rourke MF, Kon ND. Prospective evaluation of a method for estimating ascending aortic pressure from the radial artery pressure waveform. Hypertension. 2001;38:932–937. [DOI] [PubMed] [Google Scholar]
- 4. Ding FH, Fan WX, Zhang RY, et al. Validation of the noninvasive assessment of central blood pressure by the SphygmoCor and omron devices against the invasive catheter measurement. Am J Hypertens. 2011;24:1306–1311. [DOI] [PubMed] [Google Scholar]
- 5. Chen CH, Ting CT, Nussbacher A, et al. Validation of carotid artery tonometry as a means of estimating augmentation index of ascending aortic pressure. Hypertension. 1996;27:168–175. [DOI] [PubMed] [Google Scholar]
- 6. Filipovsky J, Svobodova V, Pecen L. Reproducibility of radial pulse wave analysis in healthy subjects. J Hypertens. 2000;18:1033–1040. [DOI] [PubMed] [Google Scholar]
- 7. Frimodt‐Moller M, Nielsen AH, Kamper AL, Strandgaard S. Reproducibility of pulse‐wave analysis and pulse‐wave velocity determination in chronic kidney disease. Nephrol Dial Transplant. 2008;23:594–600. [DOI] [PubMed] [Google Scholar]
- 8. Wilkinson IB, Fuchs SA, Jansen IM, et al. Reproducibility of pulse wave velocity and augmentation index measured by pulse wave analysis. J Hypertens. 1998;2:2079–2084. [DOI] [PubMed] [Google Scholar]
- 9. Agnoletti D, Zhang Y, Salvi P, et al. Pulse pressure amplification, pressure waveform calibration and clinical applications. Atherosclerosis. 2012;224:108–112. [DOI] [PubMed] [Google Scholar]
- 10. Benetos A, Thomas F, Joly L, et al. Pulse pressure amplification a mechanical biomarker of cardiovascular risk. J Am Coll Cardiol. 2010;55:1032–1037. [DOI] [PubMed] [Google Scholar]
- 11. Herbert A, Cruickshank JK, Laurent S, Boutouyrie P. Establishing reference values for central blood pressure and its amplification in a general healthy population and according to cardiovascular risk factors. Eur Heart J. 2014;35:3122–3133. [DOI] [PubMed] [Google Scholar]
- 12. Cheng HM, Chuang SY, Sung SH, et al. Derivation and validation of diagnostic thresholds for central blood pressure measurements based on long‐term cardiovascular risks. J Am Coll Cardiol. 2013;62:1780–1787. [DOI] [PMC free article] [PubMed] [Google Scholar]
- 13. James PA, Oparil S, Carter BL, et al. 2014 Evidence‐based guideline for the management of high blood pressure in adults: report from the panel members appointed to the eighth Joint National Committee (JNC 8). JAMA. 2014;311:507–520. [DOI] [PubMed] [Google Scholar]
- 14. Nichols WW, O'Rourke MF, Vlachopoulos C. McDonald's Blood Flow in Arteries, 6th ed. London: Hodder Arnold; 2011. [Google Scholar]