

Abstract
Triglyceride (TG) to high‐density lipoprotein cholesterol (HDL‐C) ratio (TG/HDL‐C) has been suggested as a simple method to identify unfavorable cardiovascular outcomes in the general population. The effect of the TG/HDL‐C ratio on essential hypertensive patients is unclear. About 900 consecutive essential hypertensive patients (mean age 52.9±12.6 years, 54.2% male) who visited our outpatient hypertension clinic were analyzed. Participants were divided into quartiles based on baseline TG/HDL‐C ratio and medical records were obtained periodically for the occurrence of fatal events and composite major adverse cardiovascular events (MACEs) including transient ischemic attack, stroke, aortic dissection, acute coronary syndrome, and death. Participants were followed for a median of 40 months (interquartile range, 35–44 months). Overall, a higher quartile of TG/HDL‐C ratio at baseline was significantly linked with higher incidence of fatal and nonfatal cardiovascular events. Using multivariate Cox regression analysis, plasma TG/HDL‐C ratio was independently associated with increased risk of fatal events (hazard ratio [HR], 1.25; 95% confidence interval [CI], 1.13–1.37; P≤.001] and MACEs (HR, 1.13; 95% CI, 1.06–1.21; P≤.001). Increased plasma TG/HDL‐C ratio was associated with more fatal events and MACEs in essential hypertensive patients.
Despite advancements in technology, diagnosis, and treatment, cardiovascular diseases including essential hypertension remain the leading causes of death worldwide.1 Traditional risk factors such as increased age, diabetes, and obesity are well‐known risk factors for adverse outcomes. However, recent evidence suggests that nontraditional risk factors such as inflammation, oxidative stress, insulin resistance, and endothelial dysfunction also play a major role in adverse outcomes associated with cardiovascular disorders.2 For better risk stratification regarding cardiovascular outcomes, a simple, accurate, reproducible, and easily measurable marker is needed. Recently, a new parameter known as triglyceride (TG) to high‐density lipoprotein cholesterol (HDL‐C) ratio (TG/HDL‐C) has been suggested as a simple way to identify apparently healthy individuals who are insulin resistant and at increased cardiometabolic risk.3, 4, 5, 6, 7 In addition, the joint occurrence of high TG and low HDL‐C in association with elevated apolipoprotein B and small dense low‐density lipoprotein (LDL) particles is strongly predictive of coronary heart disease (CHD).8 Gaziano and colleagues9 were the first to report in a case control study that this ratio strongly predicts risk of myocardial infarction. Others have linked a high TG/HDL‐C ratio to coronary atherosclerosis,10, 11 impaired heart rate recovery after exercise,12 CHD incidence,13 and CHD and cardiovascular and all‐cause death.11 However, despite all these data, the prognostic role of TG/HDL‐C ratio is limited. As a result, before using TG/HDL‐C ratio as a prognostic marker, more data are clearly needed to support this hypothesis. For this reason we conducted the current study with the aim of investigating whether TG/HDL‐C ratio has a prognostic impact with regard to major adverse cardiovascular events (MACEs) in essential hypertensive patients as acknowledged in the literature.
Materials and Methods
Study Population
In this follow‐up study, we included a total of 900 consecutive essential hypertensive patients who visited our outpatient hypertension clinic between February 2008 and December 2011. Hypertension was defined as a systolic BP (SBP) of >140 mm Hg and/or a diastolic BP (DBP) of >90 mm Hg (mean of three measurements, at least two visits). Patients with secondary hypertension, chronic liver disease, obvious active illness (eg, malignancy or acute infection) at baseline, history of cerebrovascular events, CHD, significant cardiac arrhythmias, obstructive sleep apnea, or familial hyperlipidemias were excluded from the cohort. The study complied with the Declaration of Helsinki, the study protocol was approved by the Turkey Yuksek Ihtisas Education and Research Hospital ethics committee, and informed consent was obtained from all participants.
Patients’ Blood Tests and Clinical Data Collection
All blood samples were obtained from patients in the morning after 12 hours of fasting for measurement plasma glucose and lipids. Plasma triglyceride and high‐density lipoprotein levels were measured using a semiautomated enzymatic method with a Beckman Coulter AU analyzer (AU 680; Beckman Coulter, Brea, CA). Diabetes mellitus was defined according to international guidelines. Smokers were defined as current smokers. Body mass index was calculated as weight (kg)/height (m2). Estimated GFR (eGFR) were calculated according to the Chronic Kidney Disease Epidemiology Collaboration equation.
Follow‐Up and Endpoints
Patients’ medical records were obtained periodically for the occurrence of fatal and nonfatal cardiovascular outcomes. All patients were followed up for time‐to‐event analysis until MACE occurrence, including transient ischemic attack, stroke, aortic dissection, acute coronary syndrome, or death. MACEs were recorded by reviewing outpatient clinic visits in the medical records and telephone contact if such information was not available. We also checked deaths from the national death report system regularly.
Statistical Analysis
Statistical analyses were performed using SPSS software version 19.0 (SPSS Inc; IBM, Armonk, NY). The Kolmogorov‐Smirnov method was used to test the distribution of data. Analysis of variance test was used to compare groups’ data displaying normal distribution and Kruskal‐Wallis test was applied to the data without normal distribution. For correlation analysis, Spearman's correlation coefficient rho was used. Categorical variables were compared with the chi‐square test. Data were summarized as mean±standard deviation, median and interquartile range, or proportions. The effects of different variables on fatal and nonfatal cardiovascular endpoints were calculated in univariate Cox regression analysis for each. The variables for which the unadjusted P value was <.10 in univariate analysis were identified as potential risk markers and included in the multivariable Cox regression model. The survival analysis for TG/HDL quartiles was performed by Kaplan‐Meier method and statistical assessment was performed using log‐rank test. A P value <.05 was considered to be statistically significant for all analyses.
Results
A total 900 consecutive essential hypertensive patients (mean age 52.9±12.6 years, 54.2% male) who visited our outpatient hypertension clinic were included in our study. Demographic characteristics including age, sex, body mass index, presence of diabetes, use of antihypertensive medication, follow‐up time, and laboratory parameters are given in Table 1.
Table 1.
Baseline Characteristics of Patients According to Quartiles of Triglyceride/HDL Ratio
| Variables | Triglyceride/HDL Ratio Quartiles | P for Trend | |||
|---|---|---|---|---|---|
| Q1 (n=225) | Q2 (n=224) | Q3 (n=227) | Q4 (n=224) | ||
| Age, y | 58.0±12.6 | 57.7±12.6 | 58.5±13.6 | 57.4±11.7 | .813 |
| Male, No. (%) | 95 (42) | 128 (57) | 126 (56) | 139 (62) | <.001 |
| Current smoker, No. (%) | 44 (20) | 53 (24) | 51 (23) | 53 (24) | .692 |
| Diabetes mellitus, No. (%) | 28 (12) | 30 (13) | 47 (21) | 47 (21) | .017 |
| Body mass index, kg/m2 | 27.1±1.5 | 26.9±1.6 | 27.0±1.5 | 26.8±1.5 | .122 |
| Fasting glucose, mg/dL | 98 (90–110) | 97 (89–111) | 100 (91–121) | 102 (93–118) | .001 |
| eGFR, mL/min/1.73 m2 | 102 (84–131) | 100 (83–119) | 97 (77–118) | 94 (75–114) | .011 |
| Hemoglobin, g/L | 14.2±1.4 | 14.3±1.4 | 14.5±1.4 | 14.7±1.4 | .002 |
| WBC count, ×109/L | 7 (6.1–8) | 6.7 (6–8) | 7.1 (6–8.4) | 7.6 (6.6–9) | <.001 |
| HDL, mg/dL | 58.9±11.5 | 46.4±7.6 | 41.0±8.3 | 35.7±7.5 | <.001 |
| LDL, mg/dL | 126.7±26.3 | 125.8±30.2 | 124.9±26.1 | 125.6±31.5 | .944 |
| Triglycerides, mg/dL | 100.0±31.1 | 123.9±19.7 | 155.0±34.1 | 246.9±45.6 | <.001 |
| Office SBP, mm Hg | 155 (146–174) | 160 (149–172) | 160 (150–175) | 159 (149–173) | .303 |
| Office DBP, mm Hg | 99 (91–113) | 101 (91–115) | 101 (91–115) | 98 (90–114) | .747 |
| Use of antihypertensive drugs, No. (%) | 102 (45) | 79 (35) | 86 (38) | 99 (44) | .952 |
| Use of antihyperlipidemic drugs, No. (%) | |||||
| Statins | 83 (37) | 84 (38) | 96 (42) | 103 (46) | .029 |
| Fibrats | 2 (1) | 12 (5) | 27 (12) | 56 (25) | <.001 |
| Others | 0 | 0 | 0 | 0 | – |
| Total | 85 (38) | 96 (43) | 121 (53) | 148 (66) | <.001 |
| Follow up time, mo | 38.5±7.1 | 38.9±7.5 | 38.5±7.5 | 38.2±7.4 | .782 |
Abbreviations: DBP, diastolic blood pressure; eGFR, estimated glomerular filtration rate; HDL, high‐density lipoprotein; LDL, low‐density lipoprotein; SBP, systolic blood pressure; WBC, white blood cell.
Patients with the highest TG/HDL‐C were mostly male and diabetic and had higher fasting blood glucose and lower eGFR. TG/HDL‐C ratio was correlated both with eGFR (Spearman's rank correlation coefficient: −0.118; P<.001) and diabetes (Spearman's rank correlation coefficient, 0.099; P=.003).
Table 2 shows fatal and nonfatal cardiovascular events according to TG/HDL‐C during follow‐up. As seen in Table 2, total mortality and MACEs are highest in the highest TG/HDL‐C quartile. Table 3 shows that age, smoking, diabetes, eGFR, and TG/HDL‐C were independent predictors of mortality. Table 4 shows that age, smoking, diabetes, eGFR, and TG/HDL‐C were independent predictors of fatal and nonfatal events. Lastly, the mortality and MACE curves according to TG/HDL‐C quartiles are shown in the Figure.
Table 2.
Fatal and Nonfatal Cardiovascular Events During Follow‐Up
| Variables | Triglyceride/HDL Ratio Quartiles (%) | P Value | |||
|---|---|---|---|---|---|
| Q1 (n=225) | Q2 (n=224) | Q3 (n=227) | Q4 (n=224) | ||
| Nonfatal cardiovascular events | |||||
| Transient ischemic attack | 3 (1) | 2 (1) | 2 (1) | 2 (1) | 1.00 |
| Stroke | 3 (1) | 5 (2) | 6 (3) | 4 (2) | .670 |
| Acute coronary syndrome | 6 (3) | 9 (4) | 14 (6) | 19 (9) | .003 |
| Aortic dissection | 1 | 4 (2) | 0 | 2 (1) | .865 |
| Mortality | 3 (1) | 9 (4) | 13 (6) | 21 (9) | <.001 |
| Total major cardiovascular events | 15 (7) | 24 (11) | 30 (13) | 39 (17) | <.001 |
Abbreviation: HDL, high‐density lipoprotein. Bold values indicate significance.
Table 3.
Predictors of Mortality in Univariable and Multivariable Cox Regression Analyses
| Variables | Univariable | Multivariable | ||
|---|---|---|---|---|
| HR (95% CI) | P Value | HR (95% CI) | P Value | |
| Age, y | 1.08 (1.05–1.10) | <.001 | 1.07 (1.04–1.10) | <.001 |
| Male sex | 1.06 (0.59–1.90) | .832 | – | – |
| Smoking | 1.14 (1.03–1.26) | .023 | 1.21 (0.61–2.42) | .584 |
| Diabetes mellitus | 6.14 (3.44–10.96) | <.001 | 3.33 (1.67–6.65) | <.001 |
| Use of antihyperlipidemic drug | 1.54 (1.24–1.87) | .001 | 0.61 (0.24–1.49) | .283 |
| eGFR, mL/min/1.73 m2 | 0.97 (0.96–0.98) | <.001 | 0.98 (0.97–0.99) | .033 |
| Hemoglobin, g/L | 0.88 (0.72–1.07) | .198 | – | – |
| WBC count, ×109/L | 1.08 (0.93–1.26) | .289 | – | – |
| LDL level | 1.01 (1.00–1.02) | .043 | 1.01 (0.99–1.02) | .091 |
| TG/HDL ratio | 1.23 (1.13–1.34) | <.001 | 1.25 (1.13–1.37) | <.001 |
Abbreviations: CI, confidence interval; eGFR, estimated glomerular filtration rate; HDL; high‐density lipoprotein; HR, hazard ratio; LDL, low‐density lipoprotein; TG; triglyceride; WBC, white blood cell. Bold values indicate significance.
Table 4.
Predictors of Fatal and Nonfatal Events in Univariable and Multivariable Cox Regression Analyses
| Variables | Univariable | Multivariable | ||
|---|---|---|---|---|
| HR (95% CI) | P Value | HR (95% CI) | P Value | |
| Age, y | 1.06 (1.05–1.08) | <.001 | 1.05 (1.03–1.07) | <.001 |
| Male sex | 1.03 (0.54–1.14) | .207 | – | – |
| Smoking | 1.55 (1.03–2.35) | .036 | 1.66 (1.09–2.53) | .019 |
| Diabetes mellitus | 4.18 (2.85–6.13) | <.001 | 2.80 (1.72–4.48) | <.001 |
| Use of antihyperlipidemic drugs | 1.62 (1.24–2.03) | <.001 | 1.08 (0.65–1.79) | .762 |
| eGFR, mL/min/1.73 m2 | 0.97 (0.96–0.98) | <.001 | 0.99 (0.98–0.99) | .004 |
| Hemoglobin, g/L | 0.98 (0.91–1.08) | .574 | – | – |
| WBC count, ×109/L | 1.10 (0.99–1.21) | .068 | – | – |
| LDL level | 1.01 (1.00–1.01) | .025 | 1.00 (1.00–1.01) | .040 |
| TG/HDL ratio | 1.15 (1.08–1.22) | <.001 | 1.13 (1.06–1.21) | <.001 |
Abbreviations: CI, confidence interval; eGFR, estimated glomerular filtration rate; HDL; high‐density lipoprotein; HR, hazard ratio; LDL, low‐density lipoprotein; TG; triglyceride; WBC, white blood cell. Bold values indicate significance.
Figure 1.
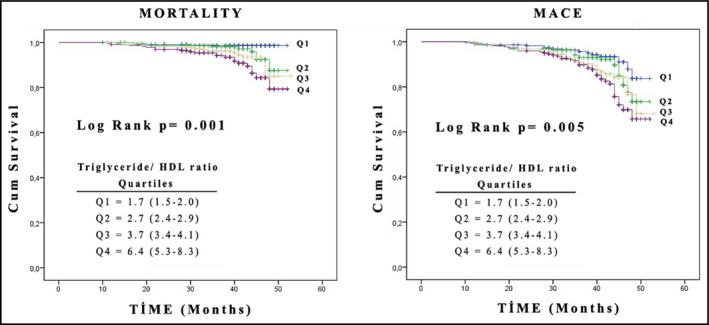
Kaplan‐Meier survival curves of fatal and composite major adverse cardiovascular events in patients with essential hypertension stratified by quartiles of triglyceride/high‐density lipoprotein (HDL) cholesterol ratio.
Discussion
In the current study, we investigated the prognostic impact of TG/HDL‐C with respect to mortality and MACEs prospectively. As a result, we showed that high TG/HDL‐C ratio was independently associated with both mortality and MACEs.
TG/HDL ratio is a simple and reproducible parameter that can easily be calculated during daily practice, and this study adds to recent evidence suggesting that this parameter has important prognostic value. TG/HDL ratio is closely associated with insulin resistance.2, 14 Apart from this, TG/HDL ratio has been shown to be a powerful predictor of total mortality, incident CHD, and cardiovascular death independent of important prognostic variables including age, race, smoking, hypertension, diabetes, and severity of coronary artery disease.8, 11, 12, 13 This prognostic impact of TG/HDL has also been valid in patients with diabetes.15, 16, 17 Despite these data, information on the role of TG/HDL in hypertensive patients is scarce. A study by Onat and colleagues18 demonstrated that atherogenic index of plasma as determined by “log10 triglyceride/high‐density lipoprotein cholesterol” predicted diabetes and high blood pressure after adjustments for covariates. In a recent investigation, Salazar and colleagues19 investigated the prognostic impact of TG/HDL ratio with regard to cardiovascular disease in hypertensive patients. The study included 947 patients divided into normotensive (n=574) and hypertensive (n=373) groups.19 In this study, the authors demonstrated two novel issues. First, they showed that prevalence of a “high” TG/HDL‐C ratio was greater in those with hypertension (38% vs 24%, P=.001) as compared with the normotensive group. Second, CVD risk factors at baseline were significantly worse in the high TG/HDL‐C group as compared with those in the low TG/HDL‐C group irrespective of BP status. Third, crude incidence of combined CVD events increased across all four risk groups: 1.9 in the normotensive–low TG/HDL‐C ratio group, 6.0 in the normotensive–high TG/HDL‐C ratio group, 15.6 in the hypertensive–low TG/HDL‐C ratio group, and 19.9 in the hypertensive–high TG/HDL‐C ratio group (P for trend <.001). The authors suggested that TG/HDL‐C can identify hypertensive patients who develop CVD to a significant degree.19
As complimentary findings, we extend this present study that clearly demonstrates the prognostic impact of TG/HDL in essential hypertension. Why TG/HDL is associated with adverse outcomes? Currently we don't know the answer, but speculations can be made.
The major explanation is insulin resistance. Indeed, various studies have shown that the TG/HDL ratio might be a useful surrogate estimate of insulin action.19, 20 This relationship has been validated in several chronic metabolic disorders such as diabetes mellitus and hypertension.16, 18, 21 Insulin resistance significantly contributes to accelerated atherosclerosis and development of CVD as a cardiovascular risk factor.22, 23 Thus, TG/HDL and adverse outcomes may be explained in the context of insulin resistance. Unfortunately, we did not measure insulin resistance in the current study.
A second explanation may be oxidative stress. In contrast to larger LDL particles, small and dense LDL particles are more prone to oxidative damage. These particles are avidly taken by arterial tissue and thus cause oxidative damage.24, 25, 26 The elevated TG/HDL‐C ratio reflects the presence of remnant lipoproteins and low dense lipoprotein levels and increased atherogenic potential.2, 4, 27, 28 Inflammation and body composition analysis may be other explanations. Karelis and colleagues29 studied the relevance of elevated TG/HDL‐C ratio in postmenopausal women. Apart from insulin sensitivity and insulin resistance they found that this ratio is closely correlated with C‐reactive protein levels and visceral fat. Both inflammation30 and high levels of visceral fat have been associated with metabolic disturbances including insulin resistance, dyslipidemia, and hypertension.31, 32 In addition, TGL/HDL ratio positively correlates with adiposity, and the magnitude of weight loss is proportional with the decrease of TGL/HDL ratio.33, 34 All these mechanisms may link the relationship between high TG/HDL‐C ratios with worse outcomes.
Study Limitations
This study may have several potential limitations. First, although the TG/HDL‐C ratio is a well‐established correlate of insulin sensitivity, we did not measure insulin sensitivity or insulin resistance in these patients. Second, we did not measure visceral fat or inflammatory status. However, all patients with chronic conditions were excluded from the study. Third, these results are from a single center and the applicability of our findings to other geographical areas is limited. Lastly, the follow‐up time was relatively short and more extended periods will be of value. In addition, TGL/HDL ratio positively correlates with adiposity, and the magnitude of weight loss is proportional with the decrease of TGL/HDL ratio.
Conclusions
We have demonstrated that high TG/HDL‐C ratio was associated with MACEs and total mortality in essential hypertensive patients. Further studies are needed to identify underlying mechanisms.
Acknowledgments and disclosures
The authors have no conflicts of interest to disclose. All authors approved the final version of the manuscript. No financial support was provided.
J Clin Hypertens (Greenwich). 2016;18:772–777. DOI: 10.1111/jch.12758. © 2015 Wiley Periodicals, Inc.
References
- 1. Sun ZJ, Zhang ZE. Historic perspectives and recent advances in major animal models of hypertension. Acta Pharmacol Sin. 2005;26:295–301. [DOI] [PubMed] [Google Scholar]
- 2. Sonmez A, Yilmaz MI, Saglam M, et al. The role of plasma triglyceride/high‐density lipoprotein cholesterol ratio to predict cardiovascular outcomes in chronic kidney disease. Lipids Health Dis. 2015;14:29. [DOI] [PMC free article] [PubMed] [Google Scholar]
- 3. Murguía‐Romero M, Jiménez‐Flores JR, Sigrist‐Flores SC, et al. Plasma triglyceride/HDL‐cholesterol ratio, insulin resistance, and cardiometabolic risk in young adults. J Lipid Res. 2013;54:2795–2799. [DOI] [PMC free article] [PubMed] [Google Scholar]
- 4. Dobiásová M, Frohlich J. The plasma parameter log (TG/HDL‐C) as an atherogenic index: correlation with lipoprotein particle size and esterification rate in apoB‐lipoprotein‐depleted plasma (FER(HDL)). Clin Biochem. 2001;34:583–588. [DOI] [PubMed] [Google Scholar]
- 5. Hanak V, Munoz J, Teague J, et al. Accuracy of the triglyceride to high‐density lipoprotein cholesterol ratio for prediction of the low‐density lipoprotein phenotype B. Am J Cardiol. 2004;94:219–222. [DOI] [PubMed] [Google Scholar]
- 6. McLaughlin T, Reaven G, Abbasi F, et al. Is there a simple way to identify insulin‐resistant individuals at increased risk of cardiovascular disease? Am J Cardiol. 2005;96:399–404. [DOI] [PubMed] [Google Scholar]
- 7. Jia L, Long S, Fu M, et al. Relationship between total cholesterol/high‐density lipoprotein cholesterol ratio, triglyceride/high‐density lipoprotein cholesterol ratio, and high‐density lipoprotein subclasses. Metabolism. 2006;55:1141–1148. [DOI] [PubMed] [Google Scholar]
- 8. Bittner V, Johnson BD, Zineh I, et al. The triglyceride/high‐density lipoprotein cholesterol ratio predictsall‐cause mortality in women with suspected myocardial ischemia: a report from the Women's Ischemia Syndrome Evaluation (WISE). Am Heart J. 2009;157:548–555. [DOI] [PMC free article] [PubMed] [Google Scholar]
- 9. Gaziano JM, Hennekens CH, O'Donnell CJ, et al. Fasting triglycerides, high‐density lipoprotein, and risk of myocardial infarction. Circulation. 1997;96:2520–2525. [DOI] [PubMed] [Google Scholar]
- 10. Frohlich J, Dobiásová M. Fractional esterification rate of cholesterol and ratio of triglycerides to HDL‐cholesterol are powerful predictors of positive findings on coronary angiography. Clin Chem. 2003;49:1873–1880. [DOI] [PubMed] [Google Scholar]
- 11. Drexel H, Aczel S, Marte T, et al. Is atherosclerosis in diabetes and impaired fasting glucose driven by elevated LDL cholesterol or by decreased HDL cholesterol? Diabetes Care. 2005;28:101–107. [DOI] [PubMed] [Google Scholar]
- 12. Shishehbor MH, Hoogwerf BJ, Lauer MS. Association of triglyceride‐to‐HDL cholesterol ratio with heart rate recovery. Diabetes Care. 2004;27:936–941. [DOI] [PubMed] [Google Scholar]
- 13. Jeppesen J, Hein HO, Suadicani P, Gyntelberg F. Low triglycerides‐high high‐density lipoprotein cholesterol and risk of ischemic heart disease. Arch Intern Med. 2001;161:361–366. [DOI] [PubMed] [Google Scholar]
- 14. González‐Chávez A, Simental‐Mendía LE, Elizondo‐Argueta S. Elevated triglycerides/HDL‐cholesterol ratio associated with insulin resistance. Cir Cir. 2011;79:126–131. [PubMed] [Google Scholar]
- 15. Eeg‐Olofsson K, Gudbjörnsdottir S, Eliasson B, et al; NDR . The triglycerides‐to‐HDL‐cholesterol ratio and cardiovascular disease risk in obese patients with type 2 diabetes: an observational study from the Swedish National Diabetes Register (NDR). Diabetes Res Clin Pract. 2014;106:136–144. [DOI] [PubMed] [Google Scholar]
- 16. Vega GL, Barlow CE, Grundy SM, et al. Triglyceride‐to‐high‐density‐lipoprotein‐cholesterol ratio is an index of heart disease mortality and of incidence of type 2 diabetes mellitus in men. J Investig Med. 2014;62:345–349. [DOI] [PubMed] [Google Scholar]
- 17. Hermans MP, Ahn SA, Rousseau MF. The atherogenic dyslipidemia ratio [log(TG)/HDL‐C] is associated with residual vascular risk, beta‐cell function loss and microangiopathy in type 2 diabetes females. Lipids Health Dis. 2012;11:132. [DOI] [PMC free article] [PubMed] [Google Scholar]
- 18. Onat A, Can G, Kaya H, Hergenç G. “Atherogenic index of plasma” (log10 triglyceride/high‐density lipoprotein‐cholesterol) predicts high blood pressure, diabetes, and vascular events. J Clin Lipidol. 2010;4:89–98. [DOI] [PubMed] [Google Scholar]
- 19. Salazar MR, Carbajal HA, Espeche WG, et al. Use of the plasma triglyceride/high‐density lipoprotein cholesterol ratio to identify cardiovascular disease in hypertensive subjects. J Am Soc Hypertens. 2014;8:724–731. [DOI] [PubMed] [Google Scholar]
- 20. Salazar MR, Carbajal HA, Espeche WG, et al. Comparison of the abilities of the plasma triglyceride/high‐density lipoprotein cholesterol ratio and the metabolic syndrome to identify insulin resistance. Diab Vasc Dis Res. 2013;10:346–352. [DOI] [PMC free article] [PubMed] [Google Scholar]
- 21. Gasevic D, Frohlich J, Mancini GJ, Lear SA. Clinical usefulness of lipid ratios to identify men and women with metabolic syndrome: a cross‐sectional study. Lipids Health Dis. 2014;13:159. [DOI] [PMC free article] [PubMed] [Google Scholar]
- 22. Razani B, Chakravarthy MV, Semenkovich CF. Insulin resistance and atherosclerosis. Endocrinol Metab Clin North Am. 2008;37:603–621. [DOI] [PMC free article] [PubMed] [Google Scholar]
- 23. Wassink AM, van der Graaf Y, Olijhoek JK, et al; SMART Study Group . Metabolic syndrome and the risk of new vascular events and all‐cause mortality in patients with coronary artery disease, cerebrovascular disease, peripheral arterial disease or abdominal aortic aneurysm. Eur Heart J. 2008;29:213–223. [DOI] [PubMed] [Google Scholar]
- 24. Varbo A, Benn M, Tybjærg‐Hansen A, et al. Remnant cholesterol as a causal risk factor for ischemic heart disease. J Am Coll Cardiol. 2013;61:427–436. [DOI] [PubMed] [Google Scholar]
- 25. Hoogeveen RC, Gaubatz JW, Sun W, et al. Small dense low‐density lipoprotein‐cholesterol concentrations predict risk for coronary heart disease: the Atherosclerosis Risk In Communities (ARIC) study. Arterioscler Thromb Vasc Biol. 2014;34:1069–1077. [DOI] [PMC free article] [PubMed] [Google Scholar]
- 26. Mikhailidis DP, Elisaf M, Rizzo M, et al. “European panel on low density lipoprotein (LDL) subclasses”: a statement on the pathophysiology, atherogenicity and clinical significance of LDL subclasses: executive summary. Curr Vasc Pharmacol. 2011;9:531–532. [DOI] [PubMed] [Google Scholar]
- 27. Rizzo M, Berneis K. Low‐density lipoprotein size and cardiovascular risk assessment. QJM. 2006;99:1–14. [DOI] [PubMed] [Google Scholar]
- 28. Maruyama C, Imamura K, Teramoto T. Assessment of LDL particle size by triglyceride/HDL‐cholesterol ratio in non‐diabetic, healthy subjects without prominent hyperlipidemia. J Atheroscler Thromb. 2003;10:186–191. [DOI] [PubMed] [Google Scholar]
- 29. Karelis AD, Pasternyk SM, Messier L, et al. Relationship between insulin sensitivity and the triglyceride‐HDL‐C ratio in overweight and obese postmenopausal women: a MONET study. Appl Physiol Nutr Metab. 2007;32:1089–1096. [DOI] [PubMed] [Google Scholar]
- 30. Feliciano Pereira P, das Graças de Almeida C, AlfenasRde C. Glycemic index role on visceral obesity, subclinical inflammation and associated chronic diseases. Nutr Hosp. 2014;30:237–243. [DOI] [PubMed] [Google Scholar]
- 31. Gastaldelli A, Miyazaki Y, Pettiti M, et al. Metabolic effects of visceral fat accumulation in type 2 diabetes. J Clin Endocrinol Metab. 2002;87:5098–5103. [DOI] [PubMed] [Google Scholar]
- 32. Wagenknecht LE, Langefeld CD, Scherzinger AL, et al. Insulin sensitivity, insulin secretion, and abdominal fat: the Insulin Resistance Atherosclerosis Study (IRAS) Family Study. Diabetes. 2003;52:2490–2496. [DOI] [PubMed] [Google Scholar]
- 33. Hatmi ZN, Mahdavi‐Mazdeh M, Hashemi‐Nazari SS, et al. Relationship between the pattern of coronary artery disease risk factors and lipid ratios with five groups of body mass index in 28566 healthy adults. Acta Med Iran. 2011;49:730–736. [PubMed] [Google Scholar]
- 34. Ruiz‐Tovar J, Oller I, Tomas A, et al. Midterm impact of sleeve gastrectomy, calibrated with a 50‐Fr bougie, on weight loss, glucose homeostasis, lipid profiles, and comorbidities in morbidly obese patients. Am Surg. 2012;78:969–974. [PubMed] [Google Scholar]