

Abstract
There are conflicting reports on cancer risk associated with angiotensin‐converting enzyme (ACE) inhibitors/angiotensin receptor blockers (ARBs). This retrospective cohort study was conducted to analyze the risk of cancer development in patients who received ACE inhibitors/ARBs as treatment for essential hypertension. Using the Taiwan National Health Insurance Research Database, 297,688 eligible study patients with essential hypertension were identified. According to their antihypertensive prescriptions, the study patients were stratified into an ACE inhibitor group, an ARB group, or a control group. After matching, participants were observed for the occurrence of cancer. In the ACE inhibitor group compared with the control group, the hazard ratio was 0.51 (95% confidence interval, 0.39–0.68). In the ARB group compared with the control group, the hazard ratio was 0.8 (95% confidence interval, 0.65–0.97). Regular use of ACE inhibitors/ARBs was not associated with an increased risk of cancer development and was actually found to decrease overall cancer risk in this study.
Angiotensin‐converting enzyme (ACE) inhibitors have been found to have protective effects against cancer development.1 Although two meta‐analyses failed to show clinical significance,2, 3 the majority of studies have found that the use of ACE inhibitors is associated with a decreased risk of cancer development.4, 5, 6, 7
Patients who use angiotensin II receptor blockers (ARBs) have been shown to be at higher risk of cancer development in some clinical studies.3, 8 However, those studies were meta‐analyses based on data from studies not originally designed to explore the risk of cancer. The nature of meta‐analyses or collaborative studies carries a considerable risk of bias regarding cancer occurrence.9 For example, one meta‐analysis found similar overall risk of cancer development comparing patients treated with ACE inhibitors/ARBs with those treated without ACE inhibitors/ARBs. However, when the meta‐analysis was restricted to cohort and nested case‐control studies, the effect of ACE inhibitors/ARBs on cancer development became protective.10 The clinical impact of ARBs on the risk of developing cancer became an issue under debate.11, 12
This study was designed to compare the incidence of cancer development between patients with essential hypertension who received ACE inhibitors or ARBs with those who received other antihypertensive medications.
Methods
Data Source
This retrospective cohort study was designed to investigate the relationship between antihypertensive medications and cancer risk. Study patients were selected from the Taiwan National Health Insurance Research Database (NHIRD), which is maintained by the Bureau of National Health Insurance (NHI). The NHI system is a universal, obligatory health insurance system in Taiwan operated by the Department of Health. At the end of 2009, a total of 23,026,000 people, representing more than 99.59% of the population in Taiwan, were enrolled in the NHI program. In this study, we used a randomly sampled longitudinal health insurance data subset issued by the NHI with a total coverage of 1,868,128 beneficiaries. There are no statistical differences in the distribution of age, sex, or premium‐based monthly salary of the beneficiaries between individuals in the subset and those in the original NHI registration dataset.
Study Participants
The population of interest comprised patients with newly diagnosed essential hypertension (International Statistical Classification of Diseases [ICD] 401) that was diagnosed during the period from 2000 to 2008. All ICD codes used in this study complied with ICD, Ninth Revision, Clinical Modification (ICD‐9‐CM). Patients 20 years or older who had at least 3 outpatient visits coded with essential hypertension in a certain year from 2000 to 2008 were included. Patients with a history of hypertension‐related diseases prior to inclusion, including hypertensive diseases (ICD 401–405), iatrogenic hypertension (ICD 997.91), pregnancy‐related hypertension (ICD 642), or hypertension‐related illness such as elevated blood pressure without a diagnosis of hypertension (ICD 796.2), hypertension retinopathy (ICD 362.11), blood vessel diseases (ICD 440–449), chronic obstructive pulmonary diseases (ICD 490–496), and chronic pulmonary heart diseases (ICD 416) were excluded. In addition, patients with Bureau of NHI‐defined catastrophic illnesses (including cancers) occurring in the year of inclusion or in the year prior to inclusion were excluded.
The steps of data processing are shown in Figure 1. A total of 297,688 individuals with newly diagnosed essential hypertension that had been diagnosed from 2000 to 2008 were identified. According to their antihypertensive prescription patterns, the individuals were assigned into one of the following three groups: the ACE inhibitor group, comprising patients who received ACE inhibitors (ATC C09A and C09B) for at least 80% of the days every year (which was 292 days) during observation and who never received ARBs (ATC C09C, C09DA, C09DB, C09DX01, and C09DX03); the ARB group, comprising patients who received ARBs for at least 80% of the 365 days annually since the year after inclusion until the end of the study and who had never received ACE inhibitors; and the control group, comprising patients who took other antihypertensive medications (ATC C02, C03, C07, and C08 excluding combinations containing ACE inhibitors/ARBs) for at least 80% of the days every year during observation. Threshold of compliance was set as medication available during ≥80% of the observation period according to Caro's classification.13 ACE inhibitors included benazepril, captopril, cilazapril, enalapril, fosinopril, imidapril, lisinopril, perindopril, quinapril, and ramipril. ARBs included candesartan, eprosartan, irbesartan, losartan, olmesartan, telmisartan, and valsartan. Renin inhibitors were not administrated during the study period.
Figure 1.
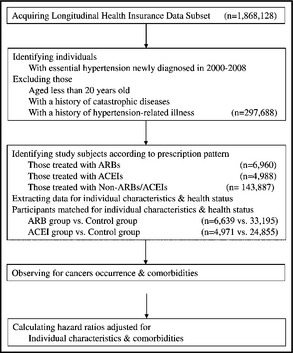
Steps of data processing using the National Health Insurance Research Database of Taiwan. ACEI indicates angiotensin‐converting enzyme inhibitor; ARB, angiotensin receptor blocker.
Study Process
The ACE inhibitor group comprised 4988 individuals, the ARB group comprised 6960 individuals, and the control group comprised 143,887 individuals. Using propensity score matching, the ACE inhibitor and ARB groups were then respectively matched at a ratio of 1:5 to form their control groups. Individual characteristics used for matching included demographic information (sex and age), socioeconomic status (premium‐based salary), and environmental factors (urbanization level of residence).14 By tracing from the year of inclusion back to 1997, cerebrovascular diseases (ICD 430–438), heart diseases including ischemic heart diseases and heart failure (ICD 398.91, 402.01, 402.11, 402.91, 404.01, 404.11, 404.91, 404.03, 404.13, 404.93, 410–414, and 428), chronic liver diseases (ICD 456.0–456.2, 571, and 572.2–572.8), diabetes mellitus (ICD 250), chronic renal diseases (ICD 403–404 and 585–586), chronic obstructive pulmonary diseases (ICD 490–496), and metabolic syndrome‐related diagnoses (ICD 272.0–272.4, 274, 278, and 277.7) were considered to represent initial health status and were also matched. The above diseases were admitted only if coded in at least 3 outpatient visits from 1997 to the year of inclusion.
After matching, the ACE inhibitor group comprised 4971 individuals and its corresponding control group comprised 24,855 participants. Likewise, the ARB group comprised 6639 individuals and its corresponding control group comprised 33,195 participants. Patients in each group were observed for cancer occurrence of any type, according to the official registry of Catastrophic Illness Dataset of the Bureau of NHI, since the year after inclusion until the end point. The end point was defined as the end of 2009, the year of cancer occurrence, or the last year in which the participants complied with the grouping criteria. The diseases representing initial health status coded in at least 3 outpatient visits during observation were taken into consideration as comorbidities in subsequent analyses.
Statistical Analysis
We used chi‐square test to measure differences in categorical data, including groupings of antihypertensive prescription pattern, sex, age, premium‐based salary, level of urbanization, and the presence or absence of diseases. Parametric data, including age and duration of observation, were examined using Student t test. The Cox proportional hazards model adjusted for sex, age, premium‐based salary, level of urbanization, and comorbidities was employed to calculate the hazard ratios (HRs) and 95% confidence intervals (CIs) for cancer occurrence. For all analyses, a P value <.05 was considered to represent statistical significance. All statistical analyses were conducted using SAS (version 9.2, SAS Institute, Cary, NC).
Results
Individual characteristics and initial health status before and after matching in the ACE inhibitor group, the ARB group, and their control groups are shown in Table 1 and Table 2, respectively. After matching, there was no significant difference in individual characteristics and initial health status between the groups.
Table 1.
Individual Characteristics and Initial Health Status in the ACE Inhibitor Group and Control Group Among Patients With Newly Diagnosed Essential Hypertension in Taiwan in 2000 to 2008
| Variables | Before Matching | P Value | After 1:5 Matching | P Value | ||
|---|---|---|---|---|---|---|
| ACE Inhibitor (4988) | Control (143,887) | ACE Inhibitor (4971) | Control (24,855) | |||
| No. (%) | No. (%) | No. (%) | No. (%) | |||
| Sex | ||||||
| Women | 1996 (40.0) | 69,173 (48.1) | <.001 | 1996 (40.2) | 10,103 (40.7) | .52 |
| Men | 2992 (60.0) | 74,714 (51.9) | 2975 (59.9) | 14,752 (59.4) | ||
| Age, mean (SD), y | ||||||
| 58.88 (13.19) | 55.21 (14.51) | <.001 | 58.85 (13.20) | 59.21 (13.37) | .084 | |
| ≤39 | 301 (6.0) | 19,286 (13.4) | <.001 | 301 (6.1) | 1417 (5.7) | .54 |
| 40–49 | 986 (19.8) | 33,320 (23.2) | 958 (19.8) | 4866 (19.6) | ||
| 50–59 | 1365 (27.4) | 37,981 (26.4) | 1364 (27.4) | 6683 (26.9) | ||
| 60–69 | 1145 (23.0) | 27,222 (18.9) | 1137 (22.9) | 5816 (23.4) | ||
| 70–79 | 890 (17.8) | 18,449 (12.8) | 883 (17.7) | 4425 (17.8) | ||
| ≥80 | 301 (6.0) | 7629 (5.3) | 301 (6.1) | 1648 (6.6) | ||
| Premium‐based salary (NT$) | ||||||
| Dependents | 1567 (31.4) | 37,171 (25.8) | <.001 | 1559 (31.4) | 7848 (31.6) | .91 |
| ≤17,280 | 1039 (20.8) | 28,678 (19.9) | 1033 (20.8) | 5295 (21.3) | ||
| 17,281–22,800 | 1655 (33.2) | 53,290 (37.0) | 1653 (33.3) | 8257 (33.2) | ||
| 22,801–28,800 | 166 (3.3) | 5508 (3.8) | 166 (3.3) | 795 (3.2) | ||
| 28,801–36,300 | 157 (3.2) | 5367 (3.7) | 156 (3.1) | 797 (3.1) | ||
| 36,301–45,800 | 187 (3.8) | 6784 (4.7) | 187 (3.8) | 843 (3.4) | ||
| 45,801–57,800 | 113 (2.3) | 3728 (2.6) | 113 (2.3) | 555 (2.2) | ||
| ≥57,801 | 104 (2.1) | 3361 (2.3) | 104 (2.1) | 495 (2.0) | ||
| Level of urbanization | ||||||
| 1 (most) | 1344 (26.9) | 39,653 (27.6) | <.001 | 1335 (26.9) | 6732 (27.1) | .90 |
| 2 or 3 | 2422 (48.6) | 65,125 (45.3) | 2414 (48.6) | 12,037 (48.4) | ||
| 4 or 5 | 796 (16.0) | 25,753 (17.9) | 796 (16.0) | 4027 (16.2) | ||
| 6 or 7 (least) | 426 (8.5) | 13,356 (9.3) | 426 (8.6) | 2059 (8.3) | ||
| Cerebrovascular diseases | ||||||
| No | 4550 (91.2) | 137,103 (95.3) | <.001 | 4540 (91.3) | 22,843 (91.9) | .177 |
| Yes | 438 (8.8) | 6784 (4.7) | 431 (8.7) | 2012 (8.1) | ||
| Heart diseases | ||||||
| No | 4181 (83.8) | 132,089 (91.8) | <.001 | 4181 (84.1) | 20,905 (84.1) | 1.00 |
| Yes | 807 (16.2) | 11,798 (8.2) | 790 (15.9) | 3950 (15.9) | ||
| Liver diseases | ||||||
| No | 4377 (87.8) | 128,151 (89.1) | .004 | 4360 (87.7) | 21,882 (88.0) | .51 |
| Yes | 611 (12.3) | 15,736 (10.9) | 611 (12.3) | 2973 (12.0) | ||
| Diabetes mellitus | ||||||
| No | 3467 (69.5) | 131,824 (91.6) | <.001 | 3467 (69.7) | 14,344 (69.8) | .96 |
| Yes | 1521 (30.5) | 12,063 (8.4) | 1504 (30.3) | 7511 (30.2) | ||
| Renal diseases | ||||||
| No | 4777 (95.8) | 140,610 (97.7) | <.001 | 4762 (95.8) | 23,893 (96.1) | .27 |
| Yes | 211 (4.2) | 3277 (2.3) | 2,09 (4.2) | 962 (3.9) | ||
| Metabolic syndrome | ||||||
| No | 3670 (73.6) | 120,314 (83.6) | <.001 | 3668 (73.8) | 18,435 (74.2) | .57 |
| Yes | 1318 (26.4) | 23,573 (16.4) | 1303 (26.2) | 6420 (25.8) | ||
Abbreviations: ACE, angiotensin‐converting enzyme; NT$, New Taiwan dollar; SD, standard deviation.
Table 2.
Individual Characteristics and Initial Health Status in the ARB Group and Control Group Among Patients With Newly Diagnosed Essential Hypertension in Taiwan in 2000 to 2008
| Variables | Before Matching | P Value | After 1:5 Matching | P Value | ||
|---|---|---|---|---|---|---|
| ARB (6960) | Control (143,887) | ARB (6629) | Control (33,195) | |||
| No. (%) | No. (%) | No. (%) | No. (%) | |||
| Sex | ||||||
| Women | 3179 (45.7) | 69,173 (48.1) | <.001 | 3052 (46.0) | 15,019 (45.2) | .28 |
| Men | 3781 (54.3) | 74,714 (51.9) | 3587 (54.0) | 18,176 (54.8) | ||
| Age, mean (SD), y | ||||||
| 59.68 (13.18 | 55.21 (14.51) | <.001 | 59.57 (13.17) | 59.56 (13.42) | .99 | |
| ≤39 | 398 (5.7) | 19,286 (13.4) | <.001 | 398 (6.0) | 1950 (5.9) | .99 |
| 40–49 | 1203 (17.3) | 33,320 (23.2) | 1195 (18.0) | 5932 (17.9) | ||
| 50–59 | 1864 (26.8) | 37,981 (26.4) | 1808 (27.2) | 9042 (27.2) | ||
| 60–69 | 1644 (23.6) | 27,222 (18.9) | 1556 (23.4) | 7736 (23.3) | ||
| 70–79 | 1373 (19.7) | 18,449 (12.8) | 1244 (18.7) | 6276 (18.9) | ||
| ≥80 | 478 (6.9) | 7629 (5.3) | 2259 (6.8) | 438 (6.6) | ||
| Premium‐based salary (NT$) | ||||||
| Dependents | 2283 (32.8) | 37,171 (25.8) | <.001 | 2134 (32.1) | 10,648 (32.1) | .84 |
| ≤17,280 | 1358 (19.5) | 28,678 (19.9) | 1278 (19.3) | 6491 (19.6) | ||
| 17,281–22,800 | 2118 (30.4) | 53,290 (37.0) | 2070 (31.2) | 10,177 (30.7) | ||
| 22,801–28,800 | 205 (3.0) | 5508 (3.8) | 202 (3.0) | 1016 (3.1) | ||
| 28,801–36,300 | 252 (3.6) | 5367 (3.7) | 245 (3.7) | 1164 (3.5) | ||
| 36,301–45,800 | 331 (4.8) | 6784 (4.7) | 322 (4.9) | 1637 (4.9) | ||
| 45,801–57,800 | 195 (2.8) | 3728 (2.6) | 180 (2.7) | 902 (2.7) | ||
| ≥57,801 | 218 (3.1) | 3361 (2.3) | 208 (3.1) | 1160 (3.5) | ||
| Level of urbanization | ||||||
| 1 (most) | 2338 (33.6) | 39,653 (27.6) | <.001 | 2196 (33.1) | 11,096 (33.4) | .85 |
| 2 or 3 | 3160 (45.4) | 65,125 (45.3) | 3018 (45.5) | 15,115 (45.5) | ||
| 4 or 5 | 976 (14.0) | 25,753 (17.9) | 948 (14.3) | 4680 (14.1) | ||
| 6 or 7 (least) | 486 (7.0) | 13,356 (9.3) | 477 (7.2) | 2304 (6.9) | ||
| Cerebrovascular diseases | ||||||
| No | 6209 (89.2) | 137,103 (95.3) | <.001 | 5996 (90.3) | 30,201 (91.0) | .086 |
| Yes | 751 (10.8) | 6784 (4.7) | 643 (9.7) | 2994 (9.0) | ||
| Heart diseases | ||||||
| No | 5565 (80.0) | 132,089 (91.8) | <.001 | 5494 (82.8) | 27,507 (82.9) | .83 |
| Yes | 195 (20.0) | 11,798 (8.2) | 1145 (17.3) | 5688 (17.1) | ||
| Liver diseases | ||||||
| No | 5950 (85.5) | 128,151 (89.1) | <.001 | 5697 (85.8) | 28,571 (86.1) | .58 |
| Yes | 1010 (14.5) | 15,736 (10.9) | 942 (14.2) | 4624 (13.9) | ||
| Diabetes mellitus | ||||||
| No | 4947 (71.1) | 131,824 (91.6) | <.001 | 4947 (74.5) | 24,737 (74.5) | .99 |
| Yes | 2013 (28.9) | 12,063 (8.4) | 1692 (25.5) | 8458 (25.5) | ||
| Renal diseases | ||||||
| No | 6534 (93.9) | 140,610 (97.7) | <.001 | 6312 (95.1) | 31,738 (95.6) | .054 |
| Yes | 426 (6.1) | 3277 (2.3) | 327 (4.9) | 1457 (4.4) | ||
| Metabolic syndrome | ||||||
| No | 4791 (68.8) | 120,314 (83.6) | <.001 | 4734 (71.3) | 23,884 (72.0) | .29 |
| Yes | 2169 (31.2) | 23,573 (16.4) | 1905 (28.7) | 9311 (28.1) | ||
Abbreviations: ARB, angiotensin receptor blocker; NT$, New Taiwan dollar; SD, standard deviation.
The duration of observation ranged from 1 to 9 years for all of the groups. The mean duration of observation was 2.36±1.81 years in the ACE inhibitor group and 2.38±1.77 years in the ARB group. During the observation period, 53 of 4971 (1.07%) patients in the ACE inhibitor group developed cancer compared with 911 of 24,855 (3.67%) in the control group (P<.001). In the ARB group, 112 of 6639 (1.69%) patients developed cancer compared with 1226 of 33,195 (3.69%) in the control group (P<.001).
The Cox proportional hazards model was employed to adjust for individual characteristics, comorbidities, and duration of observation. As shown in Table 3, the adjusted HR was 0.51 (95%, CI 0.39–0.68; P<.001) for the ACE inhibitor group and was 0.8 (95% CI, 0.65–0.97; P=.023) for the ARB group. The accumulative probabilities of cancer occurrence and the duration of ACE inhibitor and ARB exposure are illustrated in Figure 2 and Figure 3, respectively.
Table 3.
Cancer Risk Adjusted for Individual Characteristics and Comorbidities Among Patients With Newly Diagnosed Essential Hypertension in Taiwan in 2000 to 2008
| Variables | ARB vs Control | P Value | ACE Inhibitor vs Control | P Value | ||
|---|---|---|---|---|---|---|
| Adjusted HR | 95% CI | Adjusted HR | 95% CI | |||
| ACE inhibitor/control | – | – | 0.51 | 0.39–0.68 | <.001 | |
| ARB/control | 0.80 | 0.65–0.97 | .023 | ‐ | – | |
| Men/women | 1.52 | 1.50–1.70 | <.001 | 1.55 | 1.35–1.79 | <.001 |
| Age, y | ||||||
| ≤39 | 1 | 1 | ||||
| 40–49 | 2.12 | 1.30–3.45 | .002 | 2.78 | 1.40–5.54 | .004 |
| 50–59 | 3.52 | 2.20–5.62 | <.001 | 5.04 | 2.58–9.87 | <.001 |
| 60–69 | 6.40 | 4.00–10.22 | <.001 | 8.22 | 4.19–16.10 | <.001 |
| 70–79 | 8.15 | 5.09–13.05 | <.001 | 13.51 | 6.89–26.47 | <.001 |
| ≥80 | 7.99 | 4.88–13.07 | <.001 | 11.70 | 5.84–23.45 | <.001 |
| Premium‐based salary (NT$) | ||||||
| Dependents | 1 | 1 | ||||
| ≤17,280 | 0.99 | 0.86–1.15 | .96 | 0.83 | 0.69–0.98 | .029 |
| 17,281–22,800 | 1.04 | 0.90–1.21 | .57 | 0.94 | 0.79–1.11 | .44 |
| 22,801–28,800 | 0.91 | 0.61–1.37 | .66 | 0.72 | 0.42–1.21 | .21 |
| 28,801–36,300 | 0.82 | 0.54–1.25 | .36 | 0.77 | 0.46–1.32 | .35 |
| 36,301–45,800 | 0.86 | 0.61–1.21 | .39 | 0.72 | 0.42–1.23 | .23 |
| 45,801–57,800 | 0.45 | 0.25–0.82 | .010 | 0.53 | 0.26–1.09 | .084 |
| ≥57,801 | 0.59 | 0.37–0.93 | .023 | 0.64 | 0.33–1.26 | .20 |
| Level of urbanization | ||||||
| 1 (most) | 1 | 1 | ||||
| 2 or 3 | 1.02 | 0.90–1.15 | .81 | 1.06 | 0.91–1.24 | .43 |
| 4 or 5 | 0.91 | 0.76–1.09 | .90 | 0.93 | 0.75–1.15 | .50 |
| 6 or7 (least) | 0.92 | 0.73–1.16 | .47 | 0.89 | 0.68–1.16 | .39 |
| Comorbidities | ||||||
| Cerebrovascular diseases | 0.67 | 0.57–0.78 | <.001 | 0.65 | 0.54–0.78 | <.001 |
| Heart diseases | 0.92 | 0.81–1.04 | .190 | 0.90 | 0.77–1.05 | .170 |
| Liver diseases | 1.93 | 1.69–2.20 | <.001 | 1.96 | 1.68–2.30 | <.001 |
| Diabetes mellitus | 1.00 | 0.89–1.13 | .95 | 1.02 | 0.89–1.17 | .81 |
| Renal diseases | 1.34 | 1.03–1.75 | .030 | 1.34 | 0.98–1.82 | .062 |
| Lung diseases | 1.03 | 0.91–1.17 | .65 | 1.01 | 0.86–1.17 | .96 |
| Metabolic syndrome | 0.78 | 0.69–0.88 | <.001 | 0.84 | 0.73–0.96 | .012 |
Abbreviations: ACE, angiotensin‐converting enzyme; ARB, angiotensin receptor blocker; CI, confidence interval; HR, hazard ratio; NT$, New Taiwan dollar.
Figure 2.
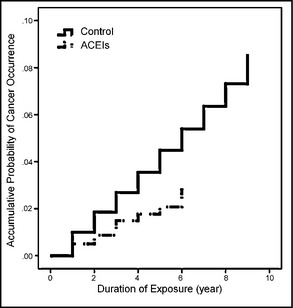
Accumulative probability of cancer occurrence and the duration of angiotensin‐converting enzyme inhibitor (ACEI) exposure among patients with newly diagnosed essential hypertension in Taiwan in 2000 to 2008. After Cox proportional hazards model analysis adjusted for other variables including sex, age, premium‐based salary, level of urbanization, cerebrovascular diseases, heart diseases, liver diseases, diabetes mellitus, renal diseases, and metabolic syndrome–related diagnoses, the adjusted hazard ratio of participants in the ACEI group compared with its control group was 0.51 (95% confidence interval, 0.39–0.68; P<.001).
Figure 3.
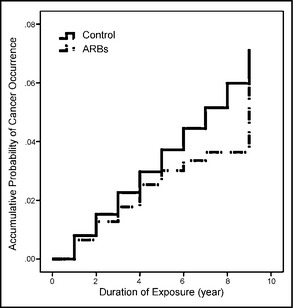
Accumulative probability of cancer occurrence and the duration of angiotensin receptor blocker (ARB) exposure among patients with newly diagnosed essential hypertension in Taiwan in 2000 to 2008. After Cox proportional hazards model analysis adjusted for other variables including sex, age, premium‐based salary, level of urbanization, cerebrovascular diseases, heart diseases, liver diseases, diabetes mellitus, renal diseases, and metabolic syndrome–related diagnoses, the adjusted hazard ratio of participants in the ARB group compared with its control group was 0.8 (95% confidence interval, 0.65–0.97; P=.023).
Discussion
Healthcare databases are considered close to the ideal material for pharmacoepidemiologic research.15 In comparison with ad hoc studies and meta‐analyses, healthcare database research often has fewer selection, recall, and reporting biases. In addition, information regarding prescription is relatively clear and contains implicit drug compliance information, which is often lacking in meta‐analysis and collaborative studies. High drug compliance has been shown to improve outcome; therefore, this study was designed to magnify the impact of ACE inhibitors/ARBs on cancer risk by requiring a high ACE inhibitor/ARB compliance threshold (over 80% of the days in every year during observation).13 In the comparison groups, the same criteria for compliance were also required to address the “healthy adherer effect.”16
In this study, the adjusted HR was 0.51 for the ACE inhibitor/control group. ACE inhibitors exert their protective effect possibly by decreasing the rate of angiotensin I degradation into angiotensin II, which, in turn, decreases the accumulation of angiotensin I.17 Furthermore, with ACE inhibitors, angiotensin I can be catabolized by endopeptidase into angiotensin (1‐7), which has been proven to be anti‐carcinogenic.18
Two types of angiotensin II receptor have been identified and were found to be counter‐regulatory to each other. Type 1 angiotensin II receptor has been shown in some studies to be pro‐carcinogenic while type 2 angiotensin II receptor was considered anti‐carcinogenic.4, 19, 20 ARBs block only type 1 angiotensin II receptor and were therefore considered to be anti‐carcinogenic. However, there were opposite opinions on the activity of the two types of angiotensin II receptors.21, 22, 23 In an in vitro assay, ARBs were found to enhance breast cancer progression by blocking type 1 angiotensin II receptor.24
In some clinical studies, ARBs have been shown to increase the incidence of respiratory system tumors.3, 8 However, in other studies, ARBs were found to be protective against cancer occurrence or to improve cancer prognosis.5, 6, 7, 10, 25 In addition, several studies, including meta‐analyses, have shown neutral results regarding the association between ARBs and risk of cancer development.11, 26, 27, 28, 29, 30 In this study, the adjusted HR was 0.8 for the ARB/control group. Although it is unlikely that a convincing conclusion on the current debate could be drawn through this single study, the result of this study would make a considerable contribution for literature in this field.
General risk factors for cancer development include smoking, obesity, an unhealthy diet, and physical inactivity.31 In addition, age, sex, income, alcohol use, unsafe sex, occupational exposure, environmental factors, and health conditions are also related to the risk of developing cancer.32, 33, 34, 35, 36 Some of the risk factors are difficult to qualify or even quantify. One of the limitations of this study is that not all possible risk factors of cancer could be controlled.
It is possible that some of the patients from the control group had indications for treatment with ACE inhibitors/ARBs but were not given one. However, the reason certain patients might not have received ACE inhibitors or ARBs is beyond the scope of this observational study.
Besides the use of ACE inhibitors/ARBs, we found that sex, age, and premium‐based salary also affect cancer incidence. Although some comorbidities such as cerebrovascular diseases, liver diseases, renal diseases, and metabolic syndrome showed significant impact on cancer occurrence, the numbers could be biased because this study was not specifically designed to examine the relation between these comorbidities and cancer risk.
This study was based on secondary data analyses. Patient compliance with medication could only be estimated from prescription records. Additionally, because of the high compliance required for inclusion, any effect of ACE inhibitors/ARBs on cancer development might only appear with regular and long‐term use. Because of the high threshold of compliance and other exclusion criteria, only a limited number of patients were included in the final analysis. As a result, cancer developed in only 53 patients in the ACE inhibitor group and in 112 patients in the ARB group. Nevertheless, the case number was large enough to demonstrate a statistical significance.
The study examined the risk of all cancers. The most common cancers in Taiwan involve the liver/intrahepatic biliary tract, lung/bronchus, breast, colon, prostate (male), cervix uteri (female), rectum, and stomach.37 However, the effects of ACE inhibitors/ARBs on different cancers lack uniformity.38 The impact of ACE inhibitors/ARBs could vary among different cancers. Furthermore, different ACE inhibitors or different ARBs may have a different impact on cancer risk.26 Therefore, further investigations into the effect of specific ACE inhibitors/ARBs on the occurrence of specific cancers may be of value.
Conclusions
We found that the relative risk of cancer development was lower among patients who received ACE inhibitors/ARBs than among patients who received other types of antihypertensive medications.
Acknowledgments and disclosure
Although based on data from the National Health Insurance Research Database provided by the Bureau of National Health Insurance, Department of Health, and managed by the National Health Research Institutes, the interpretation and conclusions contained herein do not represent those of the Bureau of National Health Insurance, Department of Health, or National Health Research Institutes. The authors declare that there are no conflicts of interest. This study was supported by the Taiwan Department of Health Clinical Trial and Research Center of Excellence (DOH101‐TD‐B‐111‐004) in the application for academic use of the NHIRD.
J Clin Hypertens (Greenwich). 2014;16:27–33. ©2013 Wiley Periodicals, Inc.
References
- 1. Carl‐McGrath S, Ebert MP, Lendeckel U, Rocken C. Expression of the local angiotensin II system in gastric cancer may facilitate lymphatic invasion and nodal spread. Cancer Biol Ther. 2007;6:1218–1226. [DOI] [PubMed] [Google Scholar]
- 2. Sipahi I, Chou J, Mishra P, et al. Meta‐analysis of randomized controlled trials on effect of angiotensin‐converting enzyme inhibitors on cancer risk. Am J Cardiol. 2011;108:294–301. [DOI] [PubMed] [Google Scholar]
- 3. Opelz G, Dohler B. Treatment of kidney transplant recipients with ACEi/ARB and risk of respiratory tract cancer: a collaborative transplant study report. Am J Transplant. 2011;11:2483–2489. [DOI] [PubMed] [Google Scholar]
- 4. Rahbari‐Oskoui F. Angiotensin II receptor blockers and risk of cancer: cause for concern? Am J Kidney Dis. 2011;57:7–10. [DOI] [PubMed] [Google Scholar]
- 5. McMenamin UC, Murray LJ, Cantwell MM, Hughes CM. Angiotensin‐converting enzyme inhibitors and angiotensin receptor blockers in cancer progression and survival: a systematic review. Cancer Causes Cont. 2012;23:221–230. [DOI] [PubMed] [Google Scholar]
- 6. Nakai Y, Isayama H, Ijichi H, et al. Inhibition of renin‐angiotensin system affects prognosis of advanced pancreatic cancer receiving gemcitabine. Br J Cancer. 2010;103:1644–1648. [DOI] [PMC free article] [PubMed] [Google Scholar]
- 7. Tanaka N, Miyajima A, Kikuchi E, et al. Prognonstic impact of renin‐angiotensin system blockade in localised upper‐tract urothelial carcinoma. Br J Cancer. 2012;106:290–296. [DOI] [PMC free article] [PubMed] [Google Scholar]
- 8. Sipahi I, Debanne SM, Rowland DY, et al. Angiotensin‐receptor blockade and risk of cancer: meta‐analysis of randomised controlled trials. Lancet Oncol. 2010;11:627–636. [DOI] [PMC free article] [PubMed] [Google Scholar]
- 9. Siragy HM. A current evaluation of the safety of angiotensin receptor blockers and direct renin inhibitors. Vasc Health Risk Manag. 2011;7:297–313. [DOI] [PMC free article] [PubMed] [Google Scholar]
- 10. Yoon C, Yang HS, Jeon I, et al. Use of angiotensin‐converting‐enzyme inhibitors or angiotensin‐receptor blockers and cancer risk: a meta‐analysis of observational studies. Can Med Assoc J. 2011;183:E1073–E1084. [DOI] [PMC free article] [PubMed] [Google Scholar]
- 11. ARB Trialists Collaboration . Effects of telmisartan, irbesartan, valsartan, candesartan, and losartan on cancers in 15 trials enrolling 138,769 individuals. J Hypertens. 2011;29:623–635. [DOI] [PubMed] [Google Scholar]
- 12. Bangalore S, Kumar S, Kjeldsen SE, et al. Antihypertensive drugs and risk of cancer: network meta‐analyses and trial sequential analyses of 324,168 participants from randomised trials. Lancet Oncol. 2011;12:65–82. [DOI] [PubMed] [Google Scholar]
- 13. Caro JJ, Ishak KJ, Huybrechts KF, et al. The impact of compliance with osteoporosis therapy on fracture rates in actual practice. Osteoporos Int. 2004;15:1003–1008. [DOI] [PubMed] [Google Scholar]
- 14. Liu CY, Hung YT, Chuang YL, et al. Incorporating development stratification of Taiwan townships into sampling design of large scale health interview survey. J Healthcare Manag. 2006;4:1–22. [Google Scholar]
- 15. Hall GC, Sauer B, Bourke A, et al. Guidelines for good database selection and use in pharmacoepidemiology research. Pharmacoepidemiol Drug Saf. 2012;21:1–10. [DOI] [PubMed] [Google Scholar]
- 16. Simpson SH, Eurich DT, Majumdar SR, et al. A meta‐analysis of the association between adherence to drug therapy and mortality. BMJ. 2006;333:15–18. [DOI] [PMC free article] [PubMed] [Google Scholar]
- 17. Celerier J, Cruz A, Lamande N, et al. Angiotensinogen and its cleaved derivatives inhibit angiogenesis. Hypertension. 2002;39:224–228. [DOI] [PubMed] [Google Scholar]
- 18. Soto‐Pantoja DR, Menon J, Gallagher PE, Tallant EA. Angiotensin‐(1‐7) inhibits tumor angiogenesis in human lung cancer xenografts with a reduction in vascular endothelial growth factor. Mol Cancer Ther. 2009;8:1676–1683. [DOI] [PMC free article] [PubMed] [Google Scholar]
- 19. Fujiyama S, Matsubara H, Nozawa Y, et al. Angiotensin AT (1) and AT (2) receptors differentially regulate angiopoietin‐2 and vascular endothelial growth factor expression and angiogenesis by modulating heparin binding‐epidermal growth factor (EGF)‐mediated EGF receptor transactivation. Circ Res. 2001;88:22–29. [DOI] [PubMed] [Google Scholar]
- 20. Deshayes F, Nahmias C. Angiotensin receptors: a new role in cancer? Trends Endocrinol Metab. 2005;16:293–299. [DOI] [PubMed] [Google Scholar]
- 21. Kanehira T, Tani T, Takagi T, et al. Angiotensin II type 2 receptor gene deficiency attenuates susceptibility to tobacco‐specific nitrosamine‐induced lung tumorigenesis: involvement of transforming growth factor‐β‐dependent cell growth attenuation. Cancer Res. 2005;65:7660–7665. [DOI] [PubMed] [Google Scholar]
- 22. Takagi T, Nakano Y, Takekoshi S, et al. Hemizygous mice for the angiotensin II type 2 receptor gene have attenuated susceptibility to azoxymethane‐induced colon tumorigenesis. Carcinogenesis. 2002;23:1235–1241. [DOI] [PubMed] [Google Scholar]
- 23. Walther T, Menrad A, Orzechowski HD, et al. Differential regulation of in vivo angiogenesis by angiotensin II receptors. FASEB J. 2003;17:2061–2067. [DOI] [PubMed] [Google Scholar]
- 24. Puddefoot JR, Udeozo UKI, Barker S, Vinson GP. The role of angiotensin II in the regulation of breast cancer cell adhesion and invasion. Endocr Relat Cancer. 2006;13:895–903. [DOI] [PubMed] [Google Scholar]
- 25. Huang CC, Chan WL, Chen YC, et al. Angiotensin II receptor blockers and risk of cancer in patients with systemic hypertension. Am J Cardiol. 2011;107:1028–1033. [DOI] [PubMed] [Google Scholar]
- 26. Chang CH, Lin JW, Wu LC, Lai MS. Angiotensin receptor blockade and risk of cancer in type 2 diabetes mellitus: a nationwide case‐control study. J Clin Oncol. 2011;29:3001–3007. [DOI] [PubMed] [Google Scholar]
- 27. Chin HJ, Oh SW, Goo HS, et al. Effect of RAAS inhibition on the incidence of cancer and cancer mortality in patients with glomerulonephritis. J Korean Med Sci. 2011;26:59–66. [DOI] [PMC free article] [PubMed] [Google Scholar]
- 28. Morote J, Planas J. Antihypertensive drugs and the risk of prostate cancer. Eur Urol. 2011;60:1309–1310. [DOI] [PubMed] [Google Scholar]
- 29. Pasternak B, Svanstrom H, Callreus T, et al. Use of angiotensin receptor blockers and the risk of cancer. Circulation. 2011;123:1729–1736. [DOI] [PubMed] [Google Scholar]
- 30. Sugiura R, Ogawa H, Oka T, et al. HIJ‐CREAT Investigators . Candesartan‐based therapy and risk of cancer in patients with systemic hypertension (Heart Institute of Japan Candesartan Randomized Trial for Evaluation in Coronary Artery Disease [HIJ‐CREATE] Substudy). Am J Cardiol. 2012;109:576–580. [DOI] [PubMed] [Google Scholar]
- 31. Danaei G, Vander Hoorn S, Lopez AD, et al. Causes of cancer in the world: comparative risk assessment of nine behavioural and environmental risk factors. Lancet. 2005;366:1784–1793. [DOI] [PubMed] [Google Scholar]
- 32. Weiderpass E. Lifestyle and cancer risk. J Prev Med Public Health. 2010;43:459–471. [DOI] [PubMed] [Google Scholar]
- 33. Li FX, Robson PJ, Chen Y, et al. Prevalence, trend, and sociodemographic association of five modifiable lifestyle risk factors for cancer in Alberta and Canada. Cancer Causes Cont. 2009;20:395–407. [DOI] [PubMed] [Google Scholar]
- 34. Baan R, Grosse Y, Straif K, et al. A review of human carcinogens–part F: chemical agents and related occupations. Lancet Oncol. 2009;10:1143. [DOI] [PubMed] [Google Scholar]
- 35. Cogliano VJ, Baan R, Straif K, et al. Preventable exposures associated with human cancers. J Natl Cancer Inst. 2011;103:1827–1839. [DOI] [PMC free article] [PubMed] [Google Scholar]
- 36. Noto H, Tsujimoto T, Sasazuki T, Noda M. Significantly increased risk of cancer in patients with diabetes mellitus: a systemic review and meta‐analysis. Endocr Pract. 2011;17:616–628. [DOI] [PubMed] [Google Scholar]
- 37. Chiang CJ, Chen YC, Chen CJ, et al. Cancer trends in Taiwan. Jpn J Clin Oncol. 2010;40:897–904. [DOI] [PubMed] [Google Scholar]
- 38. Bhaskaran K, Douglas I, Evans S, et al. Angiotensin receptor blockers and risk of cancer: cohort study among people receiving antihypertensive drugs in UK General Practice Research Database. BMJ. 2012;344:e2697. [DOI] [PMC free article] [PubMed] [Google Scholar]