

Abstract
The renal resistive index (RRI) measured by Doppler sonography is a marker of microvascular status that can be generalized to the whole of the arterial tree. Its association with large‐vessel dysfunction, such as arterial stiffness or the atherosclerotic burden, can help to establish physiopathological associations between macrocirculation and microcirculation. The authors conducted a cross‐sectional study of hypertensive patients (n=202) and a healthy control group (n=16). Stiffness parameters, atherosclerotic burden, and determination of the RRI in both kidneys were performed. The average RRI was 0.69±0.08 and was significantly greater in patients with diabetes and chronic kidney disease. Renal resistive index positively correlated with age, creatinine, and albuminuria. Positive correlations were found with arterial stiffness parameters (pulse wave velocity, ambulatory arterial stiffness index, and 24‐hour pulse pressure), as well as atherosclerotic burden and endothelial dysfunction measured as asymmetric dimethylarginine in serum. In the multivariate analysis, independent factors for increased RRI were age, renal function, 24‐hour diastolic blood pressure, and arterial stiffness. The authors concluded that there is an independent association between renal hemodynamics and arterial stiffness. This, together with the atherosclerotic burden and endothelial dysfunction, suggests that there is a physiopathologic relationship between macrovascular and microvascular impairment.
Arterial stiffness is currently considered an important biomarker in the evaluation of cardiovascular risk and the detection of incipient vascular disease. Numerous studies have shown that this parameter is an independent predictor of cardiovascular morbidity and death in patients with hypertension, diabeties, and renal insufficiency.1, 2, 3, 4 Its measurement, together with the evaluation of carotid intima–media thickness and the ankle‐brachial index, improves risk stratification as it defines the macrovascular lesion with greater precision.5
It is known that small‐vessel lesions have a similar impact on morbidity and death, especially due to damage to the cerebral and renal beds, which are particularly susceptible to systemic pulsatile flow increases. In this respect, albuminuria, while not always conditioning a microvasculature lesion, is considered a marker of microvascular pathology and is an independent factor of morbidity and death.6
A more specific evaluation of microvascular damage may be undertaken by the indirect analysis of intrarenal circulation through the study of arterial flow. The resistive index, determined by Doppler sonography, may provide useful information for the evaluation of impedance and renal vascular resistance and, consequently, of arteriolar damage.7 In fact, a correlation between the renal resistive index (RRI) and target organ lesions, such as hypertrophy of the left ventricle and microalbuminuria, has been demonstrated in hypertensive patients.8, 9 In patients with chronic kidney disease (CKD), the RRI can be useful to evaluate the extent of the renal impairment and can complement the measurement of the glomerular filtration rate (GFR) and proteinuria, as predictors of the medium‐ to long‐term renal prognosis.10, 11
The analysis of macrovascular and microvascular circulation is essential for the early and efficient detection of vessel impairment, and is of great interest for the primary and secondary prevention of cardiovascular diseases as well as for establishing the best medical treatment.
In the present study we analyze the relationship between RRI and markers of macrovascular damage, such as arterial stiffness and atherosclerotic burden, as well as the role of endothelial dysfunction in the two types of lesions.
Material and Methods
Patients
Patients with essential hypertension older than 18 years and who attended the nephrology surgery of our hospital from January 2010 to January 2012 were studied. Additionally, a healthy control group was collected with similar demographic characteristics. Patients with a diagnosis of renal artery stenosis, obstructive uropathy, acute renal insufficiency, end‐stage CKD (stage 5), and coarctation or aneurysm of the aorta were excluded. Blood and urine samples were taken from all patients. We performed anthropometric measurements and recorded data on demographics, pharmacologic history, drug use, and smoking. The study protocol was approved by the ethics committee of the Dr. Josep Trueta University Hospital of Girona, Spain.
Intrarenal Resistive Index
Sonography was conducted by two well‐trained and specialized members of the nephrology department of our hospital. We used pulsed Doppler sonography with a 3‐ to 4‐MHz convex array probe (MyLab25, Esaote, Florence, Italy). The intrarenal arteries were visualized in duplex color mode (Figure 1). The resistive index was calculated through the analysis of spectral Doppler (maximum systolic velocity – end diastolic velocity/maximum systolic velocity) obtained from 3 Doppler curves at each different location in the kidney (interlobar and arcuate arteries). RRI values were calculated as the average of all of the determinations in the two kidneys.12
Figure 1.
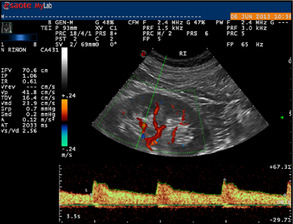
Color duplex sonography of the left kidney intrarenal artery. In this case, the reference interval (0.61) was calculated by obtaining the mean of 3 cycles.
Measurement of Arterial Stiffness
Five different methods were used for the study of vascular stiffness: the carotid‐femoral pulse wave velocity (c‐f PWV), ambulatory arterial stiffness index (AASI), symmetric AASI, and the 24‐hour pulse pressure (PP) derived from ambulatory blood pressure (BP) monitoring (ABPM), and the augmentation index (AI), derived from the analysis of the pulse‐wave morphology.
In order to measure the c‐f PWV, we used the Complior system (Artech Medical, Pantin, France), based on pressure mechanotransduction. This technique has been fully validated, is reproducible, and has proven prognostic value. We measured the time between the start of the two waves (transit time) by placing one probe over the carotid artery and another over the femoral artery. The velocity of transit was calculated from this distance.13
We calculated the AASI as the unit minus the regression slope of the diastolic BP (DBP) over the systolic BP (SBP)14 and the symmetrical AASI (Sym‐AASI), using the formula 1 (1‐AASI)/r, where r is the correlation coefficient between the registers of SBP and DBP, which is least conditioned by the circadian rhythm of BP.15 A Spacelabs 90217 ABP (Spacelabs Healthcare, Snoqualmie, WA) was used for these calculations. Measurements were obtained every 15 minutes during the day and every 30 minutes during the night, making adjustments for each patient.
In the analysis of pulse wave morphology, we used a SphygmoCor device (RS‐232, AtCor Medical, Sydney, Australia), which uses a validated transfer function to obtain a central pulse wave with the instrumental measurement of peripheral (radial) pulse wave. We also measured the AI, which represents the percentage increase of the systolic peak attributable to the reflected wave.16
Measurement of Atherosclerotic Burden
The ankle‐brachial index (ABI) and carotid ultrasonography were used in the evaluation of atherosclerotic burden.
The ABI, using a bidirectional Doppler fitted with an 8‐MHz probe (BIDOP, Hadeco, Japan) was calculated from the SBP at the 4 limbs and performed by a trained nurse. First, the brachial SBP was determined in both arms, taking the highest value as the reference. The SBP was then found in the dorsal pedis and the posterior tibial artery, taking the highest measurement in each leg. The final calculation was made by dividing each leg's SBP by the brachial SBP: the ABI value was defined as the lowest of the two.
Carotid echography was performed by highly trained personnel using a 7‐ to 10‐MHz linear array probe (MyLab25, Esaote, Florence, Italy) evaluating the intima‐media thickness and the presence of plaques in the common carotid artery, the bulb, and the internal carotid artery on both sides.
The values obtained from the two tests were used to determine the atherosclerosis score17 (Figure 2).
Figure 2.
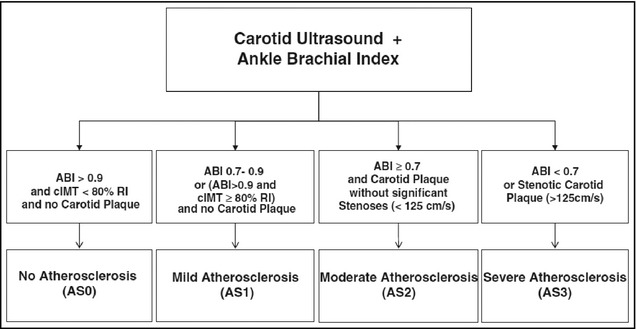
Atherosclerosis score (AS) definition. ABI indicates ankle‐brachial index; cIMT, carotid intima–media thickness; RI, reference interval.17
Measurement of Endothelial Dysfunction
Endothelial dysfunction was analyzed with the determination of asymmetric dimethylarginine (ADMA) in serum by enzyme‐linked immunosorbent assay.
Statistical Analysis
Data were evaluated with the SPSS statistical package V.17 (IBM, Armonk, NY). Continuous variables were described as means and standard deviation in the case of normal distribution and as medians and interquartile range when the criteria of normality were not fulfilled. Differences between groups were analyzed with the Student t test (two groups) or analysis of variance for variables with normal distribution and Mann‐Whitney U or Kruskal‐Wallis test for the other variables. Lineal correlations were performed using the Pearson or Spearman tests depending on the normality of the sample. Multiple regression analysis (stepwise method) was used to evaluate independent determinants of RRI. The level of significance was defined as P<.05. Finally, receiver‐operating characteristic (ROC) curve analysis was performed to establish the RRI values, which had the greatest sensitivity and specificity for the diagnosis of arterial stiffness.
Results
A total of 218 patients were analyzed (36.7% women); 27.5% were diabetics and 22.5% were smokers or recent ex‐smokers. As controls, the full study was performed in 16 healthy individuals. The average RRI was 0.69±0.08, with a mean age of 58±14.5 years. Mean 24‐hour SBP and DBP were 127.5±16.1 mm Hg and 74.9±10.4 mm Hg, respectively, with 47.1% of patients being nondippers. The median albumin:creatinine ratio (UACR) was 18 mg/g (interquartile range 5.8–187.4) and the average estimated GFR by CKD‐EPI was 68.2±32.2 mL/min/1.73 m2. A total of 43.1% of patients had CKD (GFR<60 mL/min). Healthy controls presented with an average RRI of 0.62±0.04, and mean 24‐hour BP was 115.0±11.0 / 70.5±8.6 mm Hg. In this case, 41% were women with a mean of age of 46.7±12.9 years.
RRI was significantly higher (P<.001) in diabetic patients (0.67 vs 0.75) and with CKD (0.66 vs 0.74). It positively correlated (P<.001) with age, creatinine, and UACR. With regards to 24‐hour ABPM, no correlation was found with SBP levels, although there was a significant negative correlation with 24‐hour DBP (P<.001).
The relationship between RRI, diabetes and renal insufficiency is illustrated in Figure 3. High resistance is observed when both diseases are present.
Figure 3.
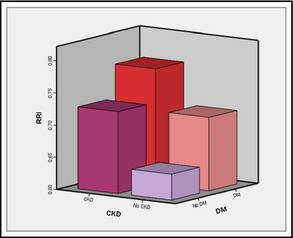
Differences between the average values of renal resistance of studied patients depending on the presence of renal insufficiency and/or diabetes mellitus. RRI indicates resistive renal index; CKD, chronic kidney disease; DM, diabetes mellitus.
Table 1 presents data relating to arterial stiffness, atherosclerotic burden, endothelial dysfunction, and intrarenal resistance.
Table 1.
Basal Values of the Main Parameters Studied of Patients and Controls
| Evaluation | Parameter | All Patients (N=218) | Controls (n=16) | Patients (n=202) | P Value |
|---|---|---|---|---|---|
| Mean±SD | |||||
| Arterial stiffness | c‐f PWV, m/s | 9.55±2.46 | 7.50±1.37 | 9.72±2.45 | <.001 |
| AASI | 0.45±0.17 | 0.39±0.15 | 0.45±0.17 | .168 | |
| SymAASI | 0.28±0.16 | 0.22±0.13 | 0.28±0.16 | .118 | |
| Augmentation index, % | 23.4±11.8 | 16.67±16.41 | 24.11±11.22 | .094 | |
| 24‐h pulse pressure, mm Hg | 52.9±12.37 | 43.88±10.43 | 53.64±12.10 | .002 | |
| Atherosclerotic burden | IMT, mm | 0.798±0.166 | 0.739±0.127 | 0.829±0.141 | .020 |
| ABI | 1.1±0.17 | 1.17±0.10 | 1.09±0.18 | .011 | |
| Endothelial dysfunction | ADMA, μmol/L | 0.54±0.17 | 0.49±0.11 | 0.55±0.18 | .09 |
| Renal hemodynamics | RRI | 0.69±0.08 | 0.62±0.04 | 0.70±0.08 | <.001 |
Abbreviations: AASI, ambulatory arterial stiffness index; ABI, ankle‐brachial index; ADMA, asymmetric dimethylarginine; c‐f PWV, carotid‐femoral pulse wave velocity; IMT, intima‐media thickness; RRI, renal resistive index; SD, standard deviation; symAASI, symmetric ambulatory arterial stiffness index.
RRI and Arterial Stiffness
Significant correlations were found in the univariate analyses between intrarenal resistances and both regional (PWV and AI) and systemic (AASI and 24‐hour PP) parameters of arterial stiffness (Table 2).
Table 2.
Univariate Analysis of Dataset‐Studied Patients Showing the Correlations Between RRI and the Different Methods of Determining Arterial Stiffness
| Variable: RRI | Correlation Coefficient | Significance (P Value) |
|---|---|---|
| c‐f PWV | 0.5 | <.01 |
| AI | 0.18 | <.01 |
| AASI | 0.47 | <.01 |
| SymAASI | 0.44 | <.01 |
| 24‐h PP | 0.44 | <.01 |
Abbreviations: AASI, ambulatory arterial stiffness index; AI, augmentation index; c‐f PWV, carotid‐femoral pulse wave velocity; PP, pulse pressure; RRI, renal resistive index; symAASI, symmetric ambulatory arterial stiffness index.
In order to identify the RRI threshold value to distinguish between more or less stiffness, patients with c‐f PWV >10 m/s (the value proposed as the prognostic factor in European BP guides5) were classified as positive for stiffness, and an analysis was performed using an ROC curve. The area under the curve was 0.78 (P<.001, 95% confidence interval, 0.71–0.84) and 0.69 had the most discriminatory value. For this value, sensitivity, specificity, positive predictive value, and negative predictive value were 80%, 65%, 56.6%, and 84.8%, respectively.
RRI and Atherosclerotic Burden
We found a negative correlation between the RRI and the ABI (P=.01). Regarding the parameters derived from carotid echography, intrarenal resistances significantly correlated with intima‐media thickness at the common carotid artery (P<.05) and with atheromatosis score (Figure 4).
Figure 4.
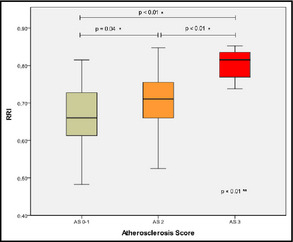
Differences in resistive renal index (RRI) between atheromatosis groups. *Scheffe. **Analysis of variance.
RRI and Endothelial Dysfunction
Intrarenal resistance showed a positive and significant correlation with endothelial dysfunction in ADMA levels in serum. We also found a correlation with renal function and atherosclerotic burden (P<.05).
Multivariate Analysis
In the lineal regression analysis (stepwise method), adjusted by age, body mass index, glycated hemoglobin (HbA1c), GFR, arterial stiffness, 24‐hour DBP, atheromatosis score, and UACR, variables that were predictive of the RRI value were age, GFR by CKD‐EPI, HbA1c, 24‐hour DBP, and arterial stiffness. This last variable was evaluated in 3 models depending on the method of measurement employed (c‐f PWV, AASI, and AI) and c‐f PWV and AASI were found to be independent predictors of RRI (Table 3).
Table 3.
Independent Determinants of Renal Artery Resistive Index by Stepwise Multivariate Linear Regression of Dataset‐Studied Patients
| Variable | Model 1: c‐f PWV | Model 2: AASI | Model 3: AI | |||
|---|---|---|---|---|---|---|
| β | P Value | β | P Value | β | P Value | |
| Age | 0.185 | .044 | 0.173 | .041 | 0.239 | .008 |
| HbA1c | 0.155 | .020 | 0.124 | .055 | 0.168 | .012 |
| Stiffness (see Model) | 0.185 | .024 | 0.239 | .000 | 0.077 | .243 |
| Atheromatosis | 0.027 | .704 | 0.043 | .538 | 0.055 | .447 |
| 24‐h DBP | −0.348 | .000 | −0.329 | .000 | −0.342 | .000 |
| BMI | −0.023 | .707 | −0.009 | .887 | −0.012 | .853 |
| GFR (CKD EPI) | −0.258 | .001 | −0.293 | .000 | −0.285 | .000 |
| UACR | 0.058 | .365 | 0.089 | .145 | 0.094 | .142 |
| ADMA | 0.031 | .613 | −0.014 | .814 | –0.003 | .967 |
Abbreviations: AASI, ambulatory arterial stiffness index; ADMA, asymmetric dimethylarginine; AI, augmentation index; BMI, body mass index; c‐f PWV, carotid‐femoral pulse wave velocity; GFR, glomerular filtrate rate; DBP, diastolic blood pressure; UACR, albumin:creatinine ratio. Bold values indicate significance.
Discussion
Several studies have reported an association between RRI and different pathologies, which are both specifically renal and others involving cardiovascular risk. Firstly, renal dysfunction, understood as an anatomical and functional alteration of the microcirculation of the kidney, implies an increase in RRI values. This process is the result of a reduction in the number and area of the postglomerular capillaries. Kidney scarring leads to a reduction in the area of the intrarenal vessels, which, in turn, may cause an increase in intrarenal vascular resistance.18 In terms of primary impaired renal function, intrarenal resistance has correlated with renal function,11, 19 and its prognosis,18, 20, 21 with UACR both in patients with diabetes22 and hypertension23 and even with histological lesions.24 It has also been associated with obstructive renal pathology25, 26 and with the evolution of the renal function after transplantation.12, 27
In the field of cardiovascular risk, increased RRI, as a measure of increased microvascular tone correlates with the extent of kidney impairment caused by high BP, defined as hypertensive nephrosclerosis. Significant associations have been described in different studies between RRI and a variety of cardiovascular risk factors such as left ventricular hypertrophy and carotid atheromatosis.23, 28, 29 Significant correlations have also been found between renal resistance and aortic stiffness measured both as pulse wave velocity and central pulse pressure.30
These associations show a close relationship between the large arteries and the small renal vessels in such a way that the increase in intrarenal resistance would seem not only to be associated with an intrinsic pathology of the kidney but could also be a physiological adaptation of the increase in flow and/or pulsativity derived from a stiffer aorta and high BP. If this is the case, an increase in RRI would be a dynamic marker of a systemic vascular problem. In other words, the correlations between the level of macrovascular and microvascular impairment suggest a dynamic integration of the aortic and renal functions. In the same way that cardiac function is linked to the level of aortic stiffness or cardiac and renal function mutually condition each other in cardiorenal syndrome, renal hemodynamics reflect the vascular nature of the organ and its close relationship with systemic circulation.
The present study shows that in both patients with renal pathologies and those who only present with high BP, there is a clear association between renal hemodynamics and arterial stiffness independently of the method employed to find the latter. This, together with the association with atherosclerotic burden, makes clear the physiopathological relationship between macrovascular and microvascular impairment. This association is independent from the level of kidney function, demonstrating that while kidney impairment itself is a factor that has an influence on intrarenal resistance, the condition of the circulatory system of the patient is even more important.
This study allows us to hypothesize that RRI values <0.69 are predictive with high sensibility of nonpathological arterial stiffness and, in this respect, this can be considered an appropriate threshold value to differentiate normal and high resistance. Other studies have proposed threshold values from 0.7 to 0.8, but always with respect to renal function rather than as a parameter associated with cardiovascular risk.11, 21
The correlation of RRI with increased microalbuminuria and especially with endothelial dysfunction measured by ADMA suggests that increases in intrarenal resistance are influenced by a vascular lesion parallel to the increase in arterial stiffness. The link between endothelial dysfunction, altered renal microvascular function and arterial stiffness may be an indication of renal dysfunction and cardiovascular disease.31
Finally, the multivariate analysis suggests that arterial stiffness behaves as a predictor of intrarenal vascular resistance both in models with c‐f PWV and AASI. The nonsignificant result found in the case of AI may be explained by the greater number of conditioning factors of this value, not only of vascular stiffness but also of all the factors, such as the state of the peripheral resistances and endothelial dysfunction, which determine and explain the pulse wave reflex.
Furthermore, the lack of significance in the lineal regression with ADMA may also be due to the close relationship of this parameter with renal function, and its possible accumulation in plasma, as well as the interaction with antihypertensive drugs, particularly calcium channel blockers.
This association between stiffness and intrarenal resistance has been previously described and correlations have been found with PWV,22 parameters derived from the study of central BP30 and the study of 24‐hour BP and AASI.32 Our study, which has a greater number of patients than most previous studies, contributes to improve the evidence in demonstrating that the analysis of the renal microvascular condition can be a predictor of arterial stiffness.
Conclusions
The analysis of intrarenal resistance may be useful in the evaluation of the general vascular condition of the patient, supplying information about both microvascular and macrovascular impairment given that it is an indirect parameter of arterial stiffness and, probably, atherosclerotic damage. Furthermore, the association between RRI and endothelial dysfunction could indicate that the damage to the renal small vessels takes place early on, in many cases allowing therapeutic interventions before the vascular lesion becomes irreversible. Although our study is of a reasonably‐sized, heterogeneous sample, the study has the limitation of being cross‐sectional and, as such, we have no knowledge of the evolution of the different parameters studied. Longitudinal studies and studies with therapeutic interventions will be necessary to confirm the usefulness of the determination of RRI as an independent cardiovascular risk factor.
Acknowledgments and disclosures
Nursing assistance provided by Jennifer Moreno and Mirta Solà was greatly appreciated. Laboratory support was provided by IdIBGi and Dr J. M. Fernández‐Real. Atherosclerotic burden was performed with support of UDETMA of the Hospital Arnau de Vilanova of Lleida within the PREVEO project. No potential conflicts of interest relevant to this article were reported.
J Clin Hypertens (Greenwich). 2014;16:186–191. ©2014 Wiley Periodicals, Inc.24548343
References
- 1. Safar ME, London GM, Plante GE. Arterial stiffness and kidney function. Hypertension. 2004;43:163–168. [DOI] [PubMed] [Google Scholar]
- 2. Laurent S, Boutouyrie P. Arterial stiffness: a new surrogate end point for cardiovascular disease? J Nephrol. 2007;1(suppl 12):S45–S50. [PubMed] [Google Scholar]
- 3. DeLoach SS, Townsend RR. Vascular stiffness: its measurement and significance for epidemiologic and outcome studies. Clin J Am Soc Nephrol. 2008;3:184–192. [DOI] [PubMed] [Google Scholar]
- 4. Gosse P, Roche F, Dauphinot V, et al. Components of arterial stiffness in a population of 65‐year‐old subjects: PROOF study. J Hypertens. 2008;26:1138–1146. [DOI] [PubMed] [Google Scholar]
- 5. Mancia G, Fagard R, Narkiewicz K, et al. 2013 ESH/ESC Guidelines for the management of arterial hypertension: the Task Force for the management of arterial hypertension of the European Society of Hypertension (ESH) and of the European Society of Cardiology (ESC). Eur Heart J. 2013;34:2159–2219. [DOI] [PubMed] [Google Scholar]
- 6. Kistorp C, Raymond I, Pedersen F, et al. N‐terminal pro‐brain natriuretic peptide, C‐reactive protein, and urinary albumin levels as predictors of mortality and cardiovascular events in older adults. JAMA. 2005;293:1609–1616. [DOI] [PubMed] [Google Scholar]
- 7. Veglio F, Provera E, Pinna G, et al. Renal resistive index after captopril test by echo‐Doppler in essential hypertension. Am J Hypertens. 1992;5:431–436. [DOI] [PubMed] [Google Scholar]
- 8. Tedesco MA, Natale F, Mocerino R, et al. Renal resistive index and cardiovascular organ damage in a large population of hypertensive patients. J Hum Hypertens. 2007;21:291–296. [DOI] [PubMed] [Google Scholar]
- 9. Raff U, Schmidt BMW, Schwab J, et al. Renal resistive index in addition to low‐grade albuminuria complements screening for target organ damage in therapy‐resistant hypertension. J Hypertens. 2010;28:608–614. [DOI] [PubMed] [Google Scholar]
- 10. Kawai T, Kamide K, Onishi M, et al. Usefulness of the resistive index in renal Doppler ultrasonography as an indicator of vascular damage in patients with risks of atherosclerosis. Nephrol Dial Transplant. 2011;26:3256–3262. [DOI] [PubMed] [Google Scholar]
- 11. Parolini C, Noce A, Staffolani E, et al. Renal resistive index and long‐term outcome in chronic nephropathies. Radiology. 2009;252:888–896. [DOI] [PubMed] [Google Scholar]
- 12. Tublin ME, Bude RO, Platt JF. Review. The resistive index in renal Doppler sonography: where do we stand?. AJR Am J Roentgenol. 2003;180:885–892. [DOI] [PubMed] [Google Scholar]
- 13. Vermeersch SJ, Dynamics B, Society L. Determinants of pulse wave velocity in healthy people and in the presence of cardiovascular risk factors: “establishing normal and reference values.” Eur Heart J. 2010;31:2338–2350. [DOI] [PMC free article] [PubMed] [Google Scholar]
- 14. Dolan E, Li Y, Thijs L, et al. Ambulatory arterial stiffness index: rationale and methodology. Blood Press Monit. 2006;11:103–105. [DOI] [PubMed] [Google Scholar]
- 15. Ben‐Dov IZ, Gavish B, Kark JD, et al. A modified ambulatory arterial stiffness index is independently associated with all‐cause mortality. J Hum Hypertens. 2008;22:761–766. [DOI] [PubMed] [Google Scholar]
- 16. Pauca AL, O'Rourke MF, Kon ND. Prospective evaluation of a method for estimating ascending aortic pressure from the radial artery pressure waveform. Hypertension. 2001;38:932–937. [DOI] [PubMed] [Google Scholar]
- 17. Coll B, Betriu A, Martínez‐Alonso M, et al. Cardiovascular risk factors underestimate atherosclerotic burden in chronic kidney disease: usefulness of non‐invasive tests in cardiovascular assessment. Nephrol Dial Transplant. 2010;25:3017–3025. [DOI] [PubMed] [Google Scholar]
- 18. Radermacher J, Ellis S, Haller H. Renal resistance index and progression of renal disease. Hypertension. 2002;2:699–703. [DOI] [PubMed] [Google Scholar]
- 19. Kim SH, Kim WH, Choi BI, Kim CW. Duplex Doppler US in patients with medical renal disease: resistive index vs serum creatinine level. Clin Radiol. 1992;45:85–87. [DOI] [PubMed] [Google Scholar]
- 20. Sugiura T, Wada A. Resistive index predicts renal prognosis in chronic kidney disease. Nephrol Dial Transplant. 2009;24:2780–2785. [DOI] [PubMed] [Google Scholar]
- 21. Radermacher J, Chavan A, Bleck J, et al. Use of Doppler ultrasonography to predict the outcome of therapy for renal‐artery stenosis. N Engl J Med. 2001;344:410–417. [DOI] [PubMed] [Google Scholar]
- 22. Hamano K, Nitta A, Ohtake T, Kobayashi S. Associations of renal vascular resistance with albuminuria and other macroangiopathy in type 2 diabetic patients. Diabetes Care. 2008;31:1853–1857. [DOI] [PMC free article] [PubMed] [Google Scholar]
- 23. Pontremoli R, Viazzi F, Martinoli C, et al. Increased renal resistive index in patients with essential hypertension: a marker of target organ damage. Nephrol Dial Transplant. 1999;14:360–365. [DOI] [PubMed] [Google Scholar]
- 24. Ikee R, Kobayashi S, Hemmi N, et al. Correlation between the resistive index by Doppler ultrasound and kidney function and histology. Am J Kidney Dis. 2005;46:603–609. [DOI] [PubMed] [Google Scholar]
- 25. Platt JF. Duplex Doppler evaluation of native kidney dysfunction: obstructive and nonobstructive disease. AJR Am J Roentgenol. 1992;158:1035–1042. [DOI] [PubMed] [Google Scholar]
- 26. Rawashdeh YF, Djurhuus JC, Mortensen J, et al. The intrarenal resistive index as a pathophysiological marker of obstructive uropathy. J Urol. 2001;165:1397–1404. [PubMed] [Google Scholar]
- 27. Choi CS, Lee S, Kim JS, et al. Usefulness of the resistive index for the evaluation of transplanted kidneys. Transplant Proc. 1998;30:3074–3075. [DOI] [PubMed] [Google Scholar]
- 28. Sezer S, Karakan S, Çolak T, Haberal M. Nocturnal nondipping hypertension is related to dyslipidemia and increased renal resistivity index in renal transplant patients. Transplant Proc. 2011;43:530–532. [DOI] [PubMed] [Google Scholar]
- 29. Shimizu Y, Itoh T, Hougaku H, et al. Clinical usefulness of duplex ultrasonography for the assessment of renal arteriosclerosis in essential hypertensive patients. Hypertens Res. 2001;24:13–17. [DOI] [PubMed] [Google Scholar]
- 30. Hashimoto J, Ito S. Central pulse pressure and aortic stiffness determine renal hemodynamics: pathophysiological implication for microalbuminuria in hypertension. Hypertension. 2011;58:839–846. [DOI] [PubMed] [Google Scholar]
- 31. Ueda S, Yamagishi S‐I, Okuda S. New pathways to renal damage: role of ADMA in retarding renal disease progression. J Nephrol. 2010;23:377–386. [PubMed] [Google Scholar]
- 32. Florczak E, Januszewicz M, Januszewicz A, et al. Relationship between renal resistive index and early target organ damage in patients with never‐treated essential hypertension. Blood Press. 2009;18:55–61. [DOI] [PubMed] [Google Scholar]