To the Editor:
A recent post hoc analysis of two large clinical trials has demonstrated that serum bilirubin level(s) are inversely correlated with the progression of diabetic nephropathy (DN).1 The findings suggest that measurement of bilirubin levels may identify patients at risk for progression of DN.
We performed an analysis of the cross‐sectional data from the National Health and Nutrition Examination Survey (NHANES) 2011–2012 to examine the association between serum total bilirubin level (in mg/dL) and serum creatinine (in mg/dL).
We categorized serum creatinine into low (0.5–0.99), intermediate (1.0–1.49), and high (>1.5) groups. We excluded patients with creatinine <0.5 mg/dL.
We performed one‐way analysis of variance (ANOVA) comparing multiple variables between the groups. For subgroup analysis, blood pressure (BP) was categorized as normotensive (systolic BP <140 mm Hg) and hypertensive (systolic BP ≥140 mm Hg). We compared total bilirubin level(s) between the low and intermediate creatinine groups and intermediate and high creatinine groups using t test or the Mann‐Whitney test where the sample lacked homogeneity. We performed nonparametric (Spearman) correlation between total bilirubin and serum creatinine. SPSS version 18 (IBM, Armonk, NY) was used for statistical analysis.
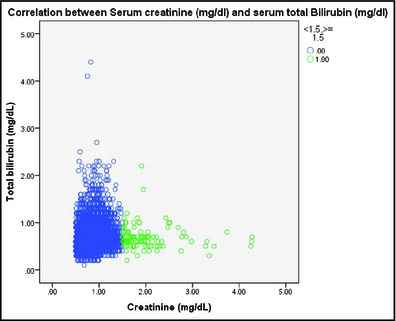
The results from ANOVA are shown in the Table 1. There were 4905 persons in the study population. Our study found a significant positive correlation between serum total bilirubin and creatinine (Spearman's correlation coefficient, 0.20; P<.01, with exclusion of persons with creatinine <0.5). The positive correlation was maintained in the hypertensive population (n=454, Spearman's correlation coefficient, 0.26; P<.01). No relationship between creatinine and bilirubin was shown in patients with renal insufficiency (n=105, P−.20). The results are illustrated in the Figure 1.
Table 1.
Characteristics of the Study Population
| Parameter | Low Creatinine Group (0.5–0.99) | Intermediate Group (1.0–1.49) | High Creatinine Group (>1.5) | P Value |
|---|---|---|---|---|
| Age, y | 31.5±24.6 | 30.5±24.4 | 29.3±23.0 | .31 |
| BMI, kg/m2 | 25.4±7.7 | 25.6±7.7 | 25.7±7.4 | .79 |
| Waist circumference, cm | 86.5±22.4 | 87.1±22.0 | 86.2±22.5 | .74 |
| Systolic blood pressure, mm Hg | 118.7±18.5 | 119.4±18.7 | 123.2±20.3 | .08 |
| Diastolic blood pressure, mm Hg | 66.8±15.1 | 66.2±15.8 | 69.4±13.6 | .17 |
| Total cholesterol, mg/dL | 185.0±42.1 | 184.9±43.5 | 173.7±42.2 | .02 |
| Triglycerides, mg/dL | 135.2±126.5 | 158.6±113.7 | 163.0±116.4 | <.01 |
| Glycated hemoglobin | 5.7±1.1 | 5.7±0.9 | 5.8±1.2 | .17 |
| Albumin, g/dL | 4.3±0.3 | 4.3± 0.3 | 4.1±0.4 | <.01 |
| AST, U/L | 25.2±18.0 | 26.2±10.8 | 24.1±12.0 | .19 |
| ALT, U/L | 23.6±28.7 | 24.7±13.8 | 20.1±11.8 | .15 |
| Total bilirubin, mg/dL | 0.69±0.3 | 0.77±0.3 | 0.69±0.3 | <.01 |
Abbreviations: ALT, alanine transaminase; AST, aspartate transaminase; BMI, body mass index. All values are expressed as mean±standard deviation.
Figure 1.

Correlation between serum creatinine (mg/dL) and serum total bilirubin (mg/dL) with/without renal insufficiency.
Mean total bilirubin was higher in the intermediate creatinine group (n=1043) compared with the high creatinine (n=114) and low creatinine (n=3751) groups (0.77±0.29 vs 0.69±0.28 vs 0.69±0.29, respectively; P<.01).
In persons with hypertension, there was a trend toward higher mean total bilirubin level in the intermediate creatinine group compared with the high creatinine group (P=.051). There was persistence of significance in the difference in the total bilirubin level(s) between the low and intermediate creatinine groups in the hypertensive population (n=439, 0.70±0.25 vs 0.76±0.26, P=.03). There was no difference in the urinary albumin or urinary creatinine levels in the one‐way ANOVA in the study population (P=.79 and P=.82, respectively).
Our study is limited in its ability to draw major conclusions as it is cross‐sectional and does not take into account ethnic and racial differences. In addition, creatinine may not be a true measure of glomerular filtration rate in some situations.
Moderate unconjugated hyperbilirubinemia (ranging from 1.2 mg/dL to 6.0 mg/dL) that is seen in patients with Gilbert syndrome confers protection from cardiovascular disease.2, 3
The possible explanation for the protective effect of bilirubin include its effects in improving endothelial function and its antioxidant role.4, 5 In an animal model (using Gunn rats, which have a genetic deficiency in UDP‐GT), blood vessels isolated from hyperbilirubinemic rats exhibited reduced levels of superoxide production and a blunted tonic response to angiotensin II infusion.6
In our study, persons with higher serum creatinine but no renal insufficiency had higher mean serum total bilirubin levels. It is not known whether this elevation is a protective mechanism or simply a marker of a widespread metabolic abnormality.
References
- 1. Riphagen IJ, Deetman PE, Bakker SJ, et al. Bilirubin and progression of nephropathy in type 2 diabetes: a post hoc analysis of renaal with independent replication in IDNT. Diabetes. 2014;63:2845–2853. [DOI] [PubMed] [Google Scholar]
- 2. Schwertner HA, Vitek L. Gilbert syndrome, UGT1A1*28 allele, and cardiovascular disease risk: possible protective effects and therapeutic applications of bilirubin. Atherosclerosis. 2008;198:1–11. [DOI] [PubMed] [Google Scholar]
- 3. Vitek L, Jirsa M, Brodanova M, et al. Gilbert syndrome and ischemic heart disease: a protective effect of elevated bilirubin levels. Atherosclerosis. 2002;160:449–456. [DOI] [PubMed] [Google Scholar]
- 4. Adin CA, Croker BP, Agarwal A. Protective effects of exogenous bilirubin on ischemia‐reperfusion injury in the isolated, perfused rat kidney. Am J Physiol Renal Physiol. 2005;288:778–784. [DOI] [PubMed] [Google Scholar]
- 5. Fujii M, Inoguchi T, Sasaki S, et al. Bilirubin and biliverdin protect rodents against diabetic nephropathy by downregulating NAD(P)H oxidase. Kidney Int. 2010;78:905–919. [DOI] [PubMed] [Google Scholar]
- 6. Pflueger A, Croatt AJ, Peterson TE, et al. The hyperbilirubinemic Gunn rat is resistant to the pressor effects of angiotensin II. Am J Physiol Renal Physiol. 2005;288:552–558. [DOI] [PubMed] [Google Scholar]


