

Abstract
This study investigated the correlation between elevated serum uric acid (SUA) and angiotensinogen in obesity patients with hypertension. A total of 162 obese and 162 nonobese men with hypertension were recruited in this study. Plasma angiotensinogen levels were measured by enzyme‐linked immunosorbent assay. Fasting insulin (FINS) was evaluated by radioimmunoassay. Compared with nonobese patients, obese patients exhibited higher levels of angiotensinogen, FINS, and homeostasis model assessment index‐insulin resistance (HOMA‐IR) (P<.001 for all). Moreover, these indexes significantly increased in obese patients in the highest tertile of SUA when compared with those in the lowest tertile of SUA (P<.001, P=.002, P=.007, respectively). In the obese group, SUA levels were significantly related to angiotensinogen, FINS, and HOMA‐IR, respectively. Furthermore, it was demonstrated that obesity × uric acid was an independent contributor to angiotensinogen (β=0.257, P<.001). In conclusion, elevated SUA is strongly related to angiotensinogen in an obesity‐dependent manner in hypertension.
Obesity, with increasing worldwide prevalence in the population, not only causes severe harm to individual health but also imposes a considerable burden on our healthcare system. Obesity is one of the most important risk factors for the development of hypertension. Data from the Framingham Heart Study have demonstrated that approximately 78% of the male hypertensive population and 65% of the female hypertensive population can be directly linked to obesity.1 The pathophysiology of obesity‐related hypertension is very complex, yet has been elucidated. Several mechanisms appear to be implicated in it, including renin‐angiotensin‐aldosterone system activation, increased sympathetic nervous system activity, dysregulated adipokines secretion, insulin resistance, endothelial dysfunction.2
Hyperuricemia commonly occurs in patients at high risk for cardiovascular diseases,3 especially overweight and obese hypertensive patients.4 Recently, epidemiological surveys have shown a strong association between uric acid (UA) and the occurrence and development of hypertension,5 and it was further confirmed by a prospective study conducted in Japanese.6 Moreover, it was reported that lowering UA with allopurinol resulted in blood pressure (BP) reduction in adolescents with newly diagnosed hypertension and patients with the metabolic syndrome.7, 8 Data have established that UA is also causally implicated in hypertension in animal models with hyperuricemia induced by oxonic acid or a high fructose diet.9, 10 Renin‐angiotensin system (RAS) activation is one of the most important mechanisms for the pathophysiological link between increased UA levels and hypertension.11 However, little is known about the relationship between serum UA (SUA) and plasma angiotensinogen in obese hypertensive patients.
Adipose tissue contains all components of the systemic RAS.12 Adipose‐derived angiotensinogen, which could be considered to play a causal role in obesity‐related hypertension, has been proven to be an important source of systemic angiotensinogen in the circulating pool in angiotensinogen‐deficient mice and Ap2‐angiotensinogen mice.13 Since both adipose‐derived angiotensinogen and SUA are involved in obesity‐related hypertension, we speculated that elevated SUA may be associated with angiotensinogen levels in obesity‐related hypertension. In this study, we tested our hypothesis in obese patients with untreated hypertension.
Methods
Study Design and Population
A total of 324 consecutive men with essential hypertension from the Southwest Hospital Health Check‐up Center, Third Military Medical University, were recruited in this study between November 2012 and July 2013. Obesity was defined based on the World Health Organization Western Pacific Region–agreed cutoff points. Hypertension was defined as systolic BP (SBP) ≥140 mm Hg and (or) diastolic BP (DBP) ≥90 mm Hg. A total of 162 obese hypertensive patients with a body mass index (BMI) from 25 kg/m2 to 40 kg/m2 were enrolled in the study and 162 sex‐ and age‐matched nonobese hypertensive patients with BMI <25 kg/m2 served as controls. These patients had not taken any antihypertensive, UA‐lowering, or lipid‐lowering medications in the past 6 months. Exclusion criteria included secondary hypertension, white‐coat hypertension, diabetes mellitus, congestive heart failure, stroke, infectious disease, malignant neoplasms, and autoimmune diseases. Patients with renal dysfunction (serum creatinine >106 μmol/L) and moderate to severe hepatic dysfunction (aspartate aminotransferase ≥100 IU/L and/ or alanine aminotransferase ≥100 IU/L) were also excluded. Questionnaires were used to identify some lifestyle details of each participant. Cigarette smokers were defined as those who had smoked at least one cigarette daily for 1 year. Alcohol consumption was defined as consuming alcohol at least once a day. Ethical approval for the study was obtained from the local ethics committee, and written informed consent forms were signed by each participant.
Anthropometry and Laboratory Measurements
SBP and DBP were determined using a mercury sphygmomanometer after at least 15 minutes of rest during two different visits. BP was measured 3 times on the right arm of the patient by a specially assigned nurse. Anthropometric variables including weight, height, and waist and hip circumference were measured according to a standardized protocol. BMI was calculated as weight (kg) divided by the square of height (m2). Waist‐to‐hip ratio was assessed by waist circumference (cm) divided by hip circumference (cm).
Venous blood samples were collected after an overnight fast. SUA, serum creatinine, total cholesterol (TC), triglycerides (TGs), low‐density lipoprotein (LDL) cholesterol, and high‐density lipoprotein (HDL) cholesterol concentrations were measured using standard enzymatic methods. Fasting blood glucose (FBG) was measured by a glucose oxidase procedure. Intra‐ and inter‐assay coefficients of variation (CV) for these assays were <5%. Fasting insulin (FINS) was assayed by radioimmunoassay. The intra‐assay CV for insulin was <10% and the inter‐assay CV was <15%. Insulin resistance was calculated using the homeostasis model assessment index‐insulin resistance (HOMA‐IR). Plasma angiotensinogen levels were quantified using a sandwich enzyme‐linked immunosorbent assay method (Hushang Biotechnology, Shanghai, China) with a lower limit of detection of 0.05 ng/mL. The intra‐ and inter‐assay CVs for angiotensinogen were below 6% and 11%, respectively.
Statistical Analysis
The Kolmogorov‐Smirnov test was used to assess data distribution. Continuous variables are presented as mean±standard deviation or median (interquartile range) in terms of the data distribution characteristics. Categorical variables are presented as numbers and percentages. Data between the obese group and the nonobese group were compared by the Student's independent samples t test or chi‐square test. Skewed variables were log‐transformed before analysis. Partial correlation analysis was performed to determine the association between SUA levels and other variables. Levels of angiotensinogen, FINS, and HOMR‐IR in hypertensive patients with or without obesity were compared according to SUA tertiles using one‐way ANOVA followed by Bonferroni's post hoc test. A multiple stepwise regression model was built to determine whether the association between SUA and angiotensinogen varied with obesity. A P value <.05 was considered statistically significant. All analyses were performed using SPSS statistical package (version 17.0; SPSS, IBM, Armonk, NY).
Results
Baseline characteristics of hypertensive men with or without obesity are illustrated in Table 1. There were no significant differences in age, smoking, DBP, creatinine, total cholesterol, and LDL cholesterol between the two groups. Compared with the nonobese group, patients in the obese group exhibited higher levels of alcohol consumption, weight, BMI, waist circumference, waist‐to‐hip ratio, SBP, TGs, and FBG, along with elevated SUA levels (all P<.05). Moreover, FINS, HOMA‐IR, and plasma angiotensinogen concentrations were significantly higher in the obese group (all P<.001). In contrast, HDL‐C levels were relatively lower in patients with obesity (P<.001).
Table 1.
Baseline Characteristics of Obese or Nonobese Patients With Hypertension a
| Variables | Obese (n=162) | Nonobese (n=162) | P Value |
|---|---|---|---|
| Age, y | 47.73±8.51 | 47.83±8.07 | .920 |
| Alcohol, No. (%) | 97 (59.88) | 78 (48.15) | .045 |
| Smoking, No. (%) | 71 (43.83) | 75 (46.29) | .738 |
| Weight, kg | 78.28±8.31 | 64.76±6.14 | <.001 |
| BMI, kg/m2 b | 27.34 (26.12–28.97) | 23.51 (21.67–24.23) | <.001 |
| Waist circumstance, cm | 95.50±6.05 | 85.50±5.19 | <.001 |
| Waist‐to‐hip ratio | 0.95±0.04 | 0.91±0.04 | <.001 |
| SBP, mm Hg | 153.15±13.35 | 149.45±12.38 | .010 |
| DBP, mm Hg | 98.83±10.20 | 97.36±10.90 | .209 |
| Uric acid, μmol/L | 411.32±63.26 | 348.86±54.92 | <.001 |
| Creatinine, μmol/L | 83.01±8.82 | 82.05±10.76 | .380 |
| Total cholesterol, mmol/L | 5.44±0.86 | 5.39±0.93 | .579 |
| Triglycerides, mmol/L | 2.49±1.11 | 1.94±1.07 | <.001 |
| LDL cholesterol, mmol/L | 2.73±0.56 | 2.69±0.58 | .549 |
| HDL cholesterol, mmol/L | 1.39±0.31 | 1.57±0.37 | <.001 |
| FBG, mmol/L | 5.68±0.58 | 5.48±0.53 | .002 |
| FINS, μIU/mL b | 13.27 (9.96–17.83) | 9.93 (7.64–12.14) | <.001 |
| HOMA‐IR b | 3.27 (2.51–4.56) | 2.34 (1.83–3.02) | <.001 |
| AGT, μg/mL | 3.78±1.03 | 3.20±1.02 | <.001 |
Abbreviations: AGT, angiotensinogen; BMI, body mass index; DBP, diastolic blood pressure; FBG, fasting blood glucose; FINS, fasting insulin; HDL, high‐density lipoprotein; HOMA‐IR, homeostasis model assessment index‐insulin resistance; LDL, low‐density lipoprotein; SBP, systolic blood pressure. aData are presented as means±standard deviation, number (percent), or median (interquartile range). bLog‐transformed before analysis.
Differences of angiotensinogen, FINS, and HOMA‐IR according to the SUA tertiles in the obese and nonobese groups are presented in Figure 1. It was demonstrated that in obese hypertensive patients, levels of angiotensinogen, FINS, and HOMA‐IR increased gradually with increasing SUA levels (one‐way ANOVA, P<.001, P=.009, P=.024, respectively). In addition, Bonferroni's post hoc analysis showed that patients in the highest tertile of SUA (436–642 μmol/L) had significantly higher levels of angiotensinogen, FINS, and HOMA‐IR than those in the lowest tertile (283–374 μmol/L) (P<.001, P=.002, P=.007, respectively). However, among nonobese hypertensive patients subdivided according to UA tertiles, there were no significant differences in terms of levels of angiotensinogen (P=.848), FINS (P=.367), and HOMA‐IR (P=.254).
Figure 1.
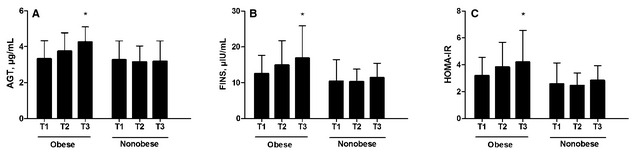
Levels of angiotensinogen (AGT) (A), fasting insulin (FINS) (B), and homeostasis model assessment index‐insulin resistance (HOMA‐IR) (C) according to obesity and serum uric acid tertiles. T1=first tertile; T2=second tertile; T3=third tertile. *P<.01 vs T1.
Correlation coefficients between SUA and other variables were determined by partial correlation analysis after correction for age, smoking, and alcohol consumption. As shown in Table 2, both in the obese and nonobese groups, SUA levels positively correlated with BMI, waist circumference, waist‐to‐hip ratio, and TGs and negatively correlated with HDL cholesterol. However, only in the obese group (Table 2, Figure 2), SUA levels were significantly related to angiotensinogen (r=0.437, P<.001), FINS (r=0.245, P=.002), and HOMA‐IR (r=0.237, P=.003). In contrast, SUA levels were found not to be associated with angiotensinogen, FINS, and HOMA‐IR in the nonobese group.
Table 2.
Partial Correlation Analysis Between Serum Uric Acid Levels and Other Variables in Patients With Hypertension a
| Variables | Obese (n=162) | Non‐Obese (n=162) | ||
|---|---|---|---|---|
| Correlation Coefficient | P Value | Correlation Coefficient | P Value | |
| BMI, kg/m2 | 0.216 | .006 | 0.240 | .002 |
| Waist circumference, cm | 0.224 | .005 | 0.223 | .003 |
| Waist‐to‐hip ratio | 0.213 | .007 | 0.278 | <.001 |
| SBP, mm Hg | −0.081 | .309 | −0.068 | .397 |
| DBP, mm Hg | 0.084 | .290 | 0.058 | .471 |
| Creatinine, μmol/L | 0.068 | .396 | 0.203 | .010 |
| Total cholesterol, mmol/L | −0.004 | .965 | 0.033 | .676 |
| Triglycerides, mmol/L | 0.184 | .020 | 0.231 | .004 |
| LDL cholesterol, mmol/L | 0.086 | .310 | 0.048 | .577 |
| HDL cholesterol, mmol/L | −0.215 | .011 | −0.210 | .014 |
| FBG, mmol/L | −0.004 | .963 | 0.056 | .483 |
| FINS, μIU/mL | 0.245 | .002 | 0.112 | .161 |
| HOMA‐IR | 0.237 | .003 | 0.122 | .128 |
| AGT, μg/mL | 0.437 | <.001 | 0.042 | .603 |
Abbreviations: AGT, angiotensinogen; BMI, body mass index; DBP, diastolic blood pressure; FBG, fasting blood glucose; FINS, fasting insulin; HDL, high‐density lipoprotein; HOMA‐IR, homeostasis model assessment index‐insulin resistance; LDL, low‐density lipoprotein; SBP, systolic blood pressure. aAge, smoking, and alcohol consumption adjusted.
Figure 2.
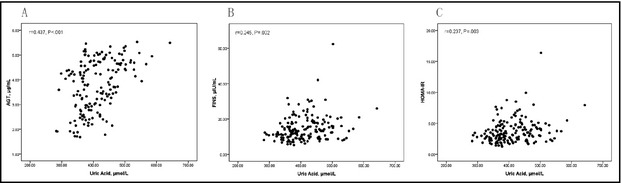
Association between serum uric acid levels and each of angiotensinogen (AGT), fasting insulin (FINS), and homeostasis model assessment index‐insulin resistance (HOMA‐IR) in obese hypertensive patients (A–C, n=162).
Stepwise multivariate regression analysis was performed to further investigate the association between SUA levels and angiotensinogen in hypertensive patients. Angiotensinogen was defined as the dependent variable in this model, in which independent variables included age, smoking, alcohol consumption, BMI, obesity (yes or no), UA, obesity×UA, SBP, DBP, FBG, FINS, HOMA‐IR, creatinine, total cholesterol, TGs, LDL cholesterol, and HDL cholesterol. Outcomes revealed that obesity×UA (β=0.257, P<.001) and BMI (β=0.133, P=.038) independently correlated with angiotensinogen levels (Table 3).
Table 3.
Stepwise Multiple Regression Analysis for the Effect of Independent Variables on AGT Concentrations in Hypertensive Patients a
| Unstandardized Coefficients | Standard Error | Standardized Coefficients | t | P Value | |
|---|---|---|---|---|---|
| Constant | 2.205 | 0.548 | 4.022 | <.001 | |
| Obesity×uric acid | 0.668 | 0.167 | 0.257 | 4.012 | <.001 |
| BMI, kg/m2 | 0.046 | 0.022 | 0.133 | 2.082 | .038 |
Abbreviations: AGT, angiotensinogen; BMI, body mass index. aWaist circumference and waist‐to‐hip ratio were not included in this model because of high colinearity with BMI.
Discussion
In this study, we found a strong correlation between elevated UA levels and plasma angiotensinogen in obese patients with untreated hypertension. Furthermore, the association between SUA and angiotensinogen varied with obesity status. We also found that UA was closely related to fasting insulin levels and insulin resistance in obesity‐related hypertension. Our findings provide new insight into the potential role of UA in obesity‐related hypertension.
Hyperuricemia is a common finding in obese hypertensive patients,14 especially in men.15 As expected, we observed that obese hypertensive patients had higher SUA levels when compared with nonobese hypertensive patients. It was also found that SUA levels were significantly positively associated with BMI, waist circumference, and waist‐to‐hip ratio. Obesity is commonly accompanied by hyperinsulinemia and insulin resistance, which cause decreased renal clearance of SUA.16 In addition, adipocytokines dysfunction such as hyperleptinemia plays a role in increased SUA owing to oxidative stress in endothelial cells17 and increased sodium tubular reabsorption.18 These mechanisms mentioned above may partially underlie the association between elevated SUA and obesity.
In the present study, plasma angiotensinogen concentrations were found to be significantly higher in obese hypertensive patients. This result is in line with the previous report that patients with obesity had increased angiotensinogen levels.19 A recent study revealed that weight reduction could result in decreased circulating angiotensinogen levels and adipose tissue angiotensinogen expression in menopausal women.20 In a model with high‐fat diet–induced obesity, it was shown that high circulating angiotensinogen concentrations may be caused by increased angiotensinogen gene expression in adipose tissue.21 Thus, it could be explained that increased fat mass is related to an increase in secretion production of adipose‐derived angiotensinogen, leading to increased circulating angiotensinogen concentrations in obese patients.
Multiple evidences indicate that a strong association exists between adipose‐derived angiotensinogen and BP. Mice with overexpression of angiotensinogen in adipose tissue exhibited elevated BP.13, 22 Angiotensinogen deficiency in adipocytes of transgenic mice not only resulted in decreased SBP23 but also protected mice against high‐fat diet–induced hypertension.24 In a visceral obesity model, which overexpresses 11‐hydroxysteroid dehydrogenase type 1 in adipose tissue, elevated BP was associated with angiotensinogen gene expression in adipose tissue and plasma angiotensinogen concentration.25 It is well recognized that adipose tissue RAS over‐expresses in obesity.26 Based on these investigations, adipose‐derived angiotensinogen, an important source of systemic RAS,13 seems to contribute to the pathogenesis of obesity‐related hypertension.
There is growing evidence that RAS activation may play a key role in the link between SUA and the development of hypertension, although the underlying mechanism remains unknown.11 Previous studies reported that elevated SUA levels are closely correlated with plasma renin activity in hypertensive patients.7 In in vivo studies of rats with mild hyperuricemia, it was shown that both plasma renin activity and BP increased.9, 27 UA‐induced hypertension could be ameliorated by RAS inhibitors in this model.27 In line with these investigations, experiments in vitro showed that UA could upregulate local tissue RAS activation, which, in turn, results in rat vascular smooth cells proliferation,28 human vascular endothelial cells dysfunction,29 and human mesangial cells proliferation.30
Of great interest in this study, it was demonstrated that angiotensinogen concentrations increased gradually with increasing SUA in the obese group only. Moreover, multivariate regression analysis indicated that the relationship between SUA and angiotensinogen changed with obesity. We reported here first that SUA was associated with angiotensinogen concentrations dependent on obesity in untreated hypertension. According to our data, elevated SUA, one of the common metabolic disorders associated with obesity, may correlate with the expression levels of adipose‐derived angiotensinogen. Furthermore, in our previous study we found that at high concentrations, UA upregulated RAS expression in 3T3‐L1 adipocytes (data awaiting publication). Normally, white adipose tissue accounts for 20% to 25% of total body weight. The markedly increased fat mass in obese patients may be one of the explanations for this difference between obesity and nonobesity‐related hypertension.
Obesity‐related hypertension is often accompanied by hyperinsulinemia, insulin resistance, and dyslipidemia. Accumulated data have demonstrated that elevated UA is involved in the pathophysiology of insulin resistance via downregulation of nitric oxide bioavailability in endothelial cells.31 Baldwin and colleagues32 reported that UA‐lowering therapy could attenuate insulin resistance in an animal model of metabolic syndrome. Consistent with previous studies,33, 34 we also observed that SUA was closely associated with fasting insulin levels and insulin resistance in obese hypertensive patients. Additionally, in good agreement with others,35 SUA acid was found to be positively related to TGs and inversely related to HDL‐C. These findings suggested that UA might have something to do with a variety of metabolism derangements in obesity‐related hypertension.
Study Limitations
One limitation of the present study is that this investigation is an observational study. Therefore, it is uncertain whether UA exerts causative effect on enhancing angiotensinogen production in obesity‐related hypertension. Another limitation is that the study population consisted exclusively of Chinese men, indicating that these results need to be verified in other ethnicities and women. Despite these limitations, our findings imply that SUA may be involved in the pathophysiology of obesity‐related hypertension. In view of the association between UA, plasma angiotensinogen, insulin resistance, and dyslipidemia, it seems that elevated SUA levels may be potential targets for the treatment of obesity‐related hypertension.
Conclusions
Our study demonstrates that SUA is strongly related to angiotensinogen in an obesity‐dependent manner in untreated hypertensive patients. Furthermore, SUA seems to contribute to enhanced plasma angiotensinogen, indicating its plausible involvement in the pathophysiology of obesity‐related hypertension. Prospective intervention trials are needed to test this hypothesis and to document whether obese patients with hypertension could benefit from UA‐lowering therapies.
Disclosures
The authors report no specific funding in relation to this research and no conflicts of competing interests to disclose.
J Clin Hypertens (Greenwich). 2014;16:569–574. © 2014 Wiley Periodicals, Inc.
References
- 1. Garrison RJ, Kannel WB, Stokes J 3rd, Castelli WP. Incidence and precursors of hypertension in young adults: the Framingham Offspring Study. Prev Med. 1987;16:235–251. [DOI] [PubMed] [Google Scholar]
- 2. Narkiewicz K. Diagnosis and management of hypertension in obesity. Obes Rev. 2006;7:155–162. [DOI] [PubMed] [Google Scholar]
- 3. Sui X, Church TS, Meriwether RA, et al. Uric acid and the development of metabolic syndrome in women and men. Metabolism. 2008;57:845–852. [DOI] [PMC free article] [PubMed] [Google Scholar]
- 4. Tsunoda S, Kamide K, Minami J, Kawano Y. Decreases in serum uric acid by amelioration of insulin resistance in overweight hypertensive patients: effect of a low‐energy diet and an insulin‐sensitizing agent. Am J Hypertens. 2002;15:697–701. [DOI] [PubMed] [Google Scholar]
- 5. Feig DI, Kang DH, Johnson RJ. Uric acid and cardiovascular risk. N Engl J Med. 2008;359:1811–1821. [DOI] [PMC free article] [PubMed] [Google Scholar]
- 6. Masuo K, Kawaguchi H, Mikami H, et al. Serum uric acid and plasma norepinephrine concentrations predict subsequent weight gain and blood pressure elevation. Hypertension. 2003;42:474–480. [DOI] [PubMed] [Google Scholar]
- 7. Feig DI, Soletsky B, Johnson RJ. Effect of allopurinol on blood pressure of adolescents with newly diagnosed essential hypertension: a randomized trial. JAMA. 2008;300:924–932. [DOI] [PMC free article] [PubMed] [Google Scholar]
- 8. Perez‐Pozo SE, Schold J, Nakagawa T, et al. Excessive fructose intake induces the features of metabolic syndrome in healthy adult men: role of uric acid in the hypertensive response. Int J Obes (Lond). 2010;34:454–461. [DOI] [PubMed] [Google Scholar]
- 9. Mazzali M, Hughes J, Kim YG, et al. Elevated uric acid increases blood pressure in the rat by a novel crystal‐independent mechanism. Hypertension. 2001;38:1101–1106. [DOI] [PubMed] [Google Scholar]
- 10. Nakagawa T, Hu H, Zharikov S, et al. A causal role for uric acid in fructose‐induced metabolic syndrome. Am J Physiol Renal Physiol. 2006;290:F625–F631. [DOI] [PubMed] [Google Scholar]
- 11. Feig DI. Uric acid and hypertension. Semin Nephrol. 2011;31:441–446. [DOI] [PubMed] [Google Scholar]
- 12. Karlsson C, Lindell K, Ottosson M, et al. Human adipose tissue expresses angiotensinogen and enzymes required for its conversion to angiotensin II. J Clin Endocrinol Metab. 1998;83:3925–3929. [DOI] [PubMed] [Google Scholar]
- 13. Massiéra F, Bloch‐Faure M, Ceiler D, et al. Adipose angiotensinogen is involved in adipose tissue growth and blood pressure regulation. FASEB J. 2001;15:2727–2729. [DOI] [PubMed] [Google Scholar]
- 14. Johnson RJ, Feig DI, Herrera‐Acosta J, Kang DH. Resurrection of uric acid as a causal risk factor in essential hypertension. Hypertension. 2005;45:18–20. [DOI] [PubMed] [Google Scholar]
- 15. Qiu L, Cheng XQ, Wu J, et al. Prevalence of hyperuricemia and its related risk factors in healthy adults from Northern and Northeastern Chinese provinces. BMC Public Health. 2013;13:664. [DOI] [PMC free article] [PubMed] [Google Scholar]
- 16. Quiñones Galvan A, Natali A, Baldi S, et al. Effect of insulin on uric acid excretion in humans. Am J Physiol. 1995;1:E1–E5. [DOI] [PubMed] [Google Scholar]
- 17. Rahmouni K, Haynes WG. Endothelial effects of leptin: implications in health and diseases. Curr Diab Rep. 2005;5:260–266. [DOI] [PubMed] [Google Scholar]
- 18. Jackson EK, Li P. Human leptin has natriuretic activity in the rat. Am J Physiol. 1997;1272:333–338. [DOI] [PubMed] [Google Scholar]
- 19. Umemura S, Nyui N, Tamura K, et al. Plasma angiotensinogen concentrations in obese patients. Am J Hypertens. 1997;10:629–633. [DOI] [PubMed] [Google Scholar]
- 20. Engeli S, Böhnke J, Gorzelniak K, et al. Weight loss and the renin‐angiotensin‐aldosterone system. Hypertension. 2005;45:356–362. [DOI] [PubMed] [Google Scholar]
- 21. Boustany CM, Bharadwaj K, Daugherty A, et al. Activation of the systemic and adipose renin‐angiotensin system in rats with diet‐induced obesity and hypertension. Am J Physiol Regul Integr Comp Physiol. 2004;287:R943–R949. [DOI] [PubMed] [Google Scholar]
- 22. Yvan‐Charvet L, Massiera F, Lamande N, et al. Deficiency of angiotensin type 2 receptor rescues obesity but not hypertension induced by overexpression of angiotensinogen in adipose tissue. Endocrinology. 2009;150:1421–1428. [DOI] [PubMed] [Google Scholar]
- 23. Yiannikouris F, Karounos M, Charnigo R, et al. Adipocyte‐specific deficiency of angiotensinogen decreases plasma angiotensinogen concentration and systolic blood pressure in mice. Am J Physiol Regul Integr Comp Physiol. 2012;302:R244–R251. [DOI] [PMC free article] [PubMed] [Google Scholar]
- 24. Yiannikouris F, Gupte M, Putnam K, et al. Adipocyte deficiency of angiotensinogen prevents obesity‐induced hypertension in male mice. Hypertension. 2012;60:1524–1530. [DOI] [PMC free article] [PubMed] [Google Scholar]
- 25. Masuzaki H, Yamamoto H, Kenyon CJ, et al. Transgenic amplification of glucocorticoid action in adipose tissue causes high blood pressure in mice. J Clin Invest. 2003;112:83–90. [DOI] [PMC free article] [PubMed] [Google Scholar]
- 26. Kalupahana NS, Moustaid‐Moussa N. The renin‐angiotensin system: a link between obesity, inflammation and insulin resistance. Obes Rev. 2012;13:136–149. [DOI] [PubMed] [Google Scholar]
- 27. Watanabe S, Kang DH, Feng L, et al. Uric acid, hominoid evolution, and the pathogenesis of salt‐sensitivity. Hypertension. 2002;40:355–360. [DOI] [PubMed] [Google Scholar]
- 28. Corry DB, Eslami P, Yamamoto K, et al. Uric acid stimulates vascular smooth muscle cell proliferation and oxidative stress via the vascular renin‐angiotensin system. J Hypertens. 2008;26:269–275. [DOI] [PubMed] [Google Scholar]
- 29. Yu MA, Sánchez‐Lozada LG, Johnson RJ, Kang DH. Oxidative stress with an activation of the renin‐angiotensin system in human vascular endothelial cells as a novel mechanism of uric acid‐induced endothelial dysfunction. J Hypertens. 2010;28:1234–1242. [PubMed] [Google Scholar]
- 30. Albertoni G, Maquigussa E, Pessoa E, et al. Soluble uric acid increases intracellular calcium through an angiotensin II‐dependent mechanism in immortalized human mesangial cells. Exp Biol Med (Maywood). 2010;235:825–832. [DOI] [PubMed] [Google Scholar]
- 31. Khosla UM, Zharikov S, Finch JL, et al. Hyperuricemia induces endothelial dysfunction. Kidney Int. 2005;67:1739–1742. [DOI] [PubMed] [Google Scholar]
- 32. Baldwin W, McRae S, Marek G, et al. Hyperuricemia as a mediator of the proinflammatory endocrine imbalance in the adipose tissue in a murine model of the metabolic syndrome. Diabetes. 2011;60:1258–1269. [DOI] [PMC free article] [PubMed] [Google Scholar]
- 33. Yoo TW, Sung KC, Shin HS, et al. Relationship between serum uric acid concentration and insulin resistance and metabolic syndrome. Circ J. 2005;69:928–933. [DOI] [PubMed] [Google Scholar]
- 34. Conen D, Wietlisbach V, Bovet P, et al. Prevalence of hyperuricemia and relation of serum uric acid with cardiovascular risk factors in a developing country. BMC Public Health. 2004;4:9. [DOI] [PMC free article] [PubMed] [Google Scholar]
- 35. Mitsuhashi H, Yatsuya H, Matsushita K, et al. Uric acid and left ventricular hypertrophy in Japanese men. Circ J. 2009;73:667–672. [DOI] [PubMed] [Google Scholar]