

Abstract
Pulse pressure amplification (PPA) reflects large artery function. Its contribution in chronic kidney disease (CKD) remains uncertain. The authors assessed PPA in CKD progression in patients with CKD stage 2 to 4 (n=128) and 89 controls (follow‐up: 42 months). PPA was reduced in CKD patients as compared with control patients and associated with decline in renal function. Sixteen renal endpoints, defined by 50% loss of renal function or start of renal replacement therapy, were detected. In Cox regression analysis, PPA, estimated glomerular filtration rate, and proteinuria predicted renal endpoints. Patients with CKD stage 4 and low PPA had the highest risk for developing renal endpoints (unadjusted 8.1; 2.4–27.7 and adjusted for age and proteinuria 5.6; 1.5–21.9, log‐rank P<.001). Taken together, PPA is reduced in CKD and is associated with declining renal function. In addition, low PPA predicts renal endpoints in severe CKD. Furthermore, this study emphasizes the role of systolic blood pressure as a major determinant of PPA.
Unlike mean and diastolic pressures, which are fairly constant within large arteries, systolic pressures significantly vary along the vascular bed.1 This change in pulsatile behavior is attributed to changes in arterial properties as well as end organ function.2 Beyond anatomical and age‐related causes,3 pathophysiological modifications of the arterial impedance are the major determinants of alterations in pulse wave shape, magnitude, and velocity.4, 5 Arterial stiffening and subsequent hypertensive end organ damage are strongly related to adverse cardiovascular outcome.4, 5 In particular, chronic kidney disease (CKD) represents a pathology affecting all of the above‐mentioned anatomical and functional organs. Although in end‐stage renal disease (ESRD) the consequence of arterial stiffening is well documented,6, 7 its relation to the development towards ESRD, clinically well characterized by the emerging levels of CKD, remains unclear.8, 9, 10
Furthermore, arterial stiffness as measured by pulse wave velocity (PWV) is a structural and therefore slow indicator4 of vessel condition, although the pathogenesis is likely paralleled by an early functional impairment that cascades a set of additional processes leading to ventricular and arterial remodeling. Therefore, the investigation of early markers of stiffness‐related functional impairments and arterial pulsatility, such as pulse pressure amplification (PPA) as a ratio between aortic and brachial pulse pressures,11 may provide additional insights into the development of CKD and cardiovascular disease. This work focuses in cross‐sectional analysis on the relationship between PPA with CKD and in prospective analysis on the predictive values of PPA with respect to renal endpoints and mortality.
Methods
Design and Patients
From November 2008 to December 2010, 135 patients with CKD stages 2 to 4 and 89 controls were prospectively included in this study on the basis of reduced estimated glomerular filtration rate (GFR; Modification of Diet in Renal Disease equation, GFR ≤60 mL/min per 1.73 m2). Enrolled patients were 18 years or older and had not been on dialysis or received a kidney transplant. Pregnant women were excluded. Diabetic nephropathy was identified in 39 patients, tubulointerstitial nephropathy in 26 patients, nephroangiosclerosis in 26 patients, polycystic kidney disease in 3 patients, primary glomerulonephritis in 36 patients, and undetermined nephropathy in 5 patients. The patients underwent a work‐up including medical interview, clinical examination, blood samples, and evaluation of central blood pressure (BP) and aortic PWV (aPWV). The protocol was approved by the local ethics committee, and all patients gave written informed consent.
Central Hemodynamics
All patients were studied in a quiet room with a controlled temperature of 22±1°C. BP was monitored every 3 minutes with an oscillometric method (Mobil‐O‐Graph 24‐hour Pulse Wave Analysis [PWA] Monitor, IEM, Stolberg, DE). The PWA monitor incorporates the ARCSolver (Austrian Institute of Technology, Vienna, Austria) algorithms. This is a novel method for the determination of central hemodynamics based on oscillometric BP measurement with a common cuff and provides measurements of arterial stiffness surrogates.12, 13, 14 Several groups validated the arterial stiffness parameters provided by the ARCSolver algorithm invasively and noninvasively with respect to accuracy, reproducibility, and feasibility.15, 16, 17, 18, 19, 20, 21, 22
Using a common upper arm BP measurement, the PWA recordings were carried out at a diastolic pressure level for approximately 10 seconds using a conventional brachial BP and a high‐fidelity pressure sensor. After digitalization, the signal processing was performed using a 3‐level algorithm. In the first step, the single pressure waves were verified for their plausibility by testing the position of minima and the corresponding wavelengths. During the second stage, all single pressure waves were compared with each other to identify artifacts.
Thereafter, an aortic pulse wave was generated by means of a generalized transfer function. Its extreme values were aortic systolic BP (aSBP) and diastolic BP (aDBP). Subsequently, aortic pulse pressure (aPP) was derived as the difference of aSBP minus aDBP, as defined by peripheral measurements. PPA was then calculated as brachial pulse pressure (bPP) divided by aortic pulse pressure (PPA = bPP/aPP). From a mechanistic viewpoint, PPA was largely influenced by the relationship of vascular impedance between central and peripheral vessels and its pathophysiological change, which affects both forward and backward traveling waves as well as their timing and superimposition.23
We collected blood and urine samples to determine the levels of serum plasma creatinine with an isotope dilution mass spectrometry standardized modified kinetic Jaffe colorimetric method, hemoglobin, triglyceride, high‐density lipoprotein and low‐density lipoprotein cholesterol, urinary albumin, and creatinine.
Prospective Analysis
In prospective follow‐up, 135 CKD patients were enrolled. Renal endpoint was defined as a decline of 50% from baseline and/or start of renal replacement therapy. Additionally, all‐cause mortality was determined. The median follow‐up was 42 months. Ten patients were lost during the follow‐up period. Sixteen patients reached the renal endpoints during follow‐up and 13 patients died.
Statistical Analysis
Analysis of variance with post‐hoc Bonferroni correction or the Kruskal‐Wallis test were applied to compare CKD groups with controls and to analyze sex differences. The arterial parameters of interest were entered in a stepwise regression analyses. Logistic regression analysis was performed using age, eGFR, aPWV, and PPA as variables. Patients were categorized according to CKD stage 2 to 4 and to the median of PPA.24 Cox regression analysis and Kaplan‐Meier survival analysis with log‐rank test was performed for renal endpoints and mortality for these categorized groups. The assumption of normality of continuous covariates was verified before analysis. Statistical analysis was performed with SPSS 19 software (SPSS Inc, IBM Corporation, Armonk, NY).
Results
The cross‐sectional characteristics of the populations at baseline are presented in Table 1. CKD patients were older and consisted of fewer women than control patients. In addition, CKD patients had higher brachial and central systolic BP (SBP) and PP. CKD patients more often had diabetes. Blood cholesterol was subsequently significantly lower in CKD patients. With respect to arterial function, augmentation index and aPWV were still significantly increased in CKD patients after adjustment for confounding factors such as age and mean arterial pressure, whereas PPA was reduced as compared with control patients.
Table 1.
Main Clinical Characteristics in Patients With CKD 2 to 4 and Control Patients
| Controls | CKD Total | CKD 2 | CKD 3 | CKD 4 | |
|---|---|---|---|---|---|
| No. | 89 | 128 | 36 | 55 | 37 |
| Age, y | 49.0±13.9 | 60.0±14.9 | 64.5±10.4 | 57.7±14.9 | 62.2±16.2 |
| Female,% | 49 | 41 | 55 | 41 | 35 |
| BMI, kg/m2 | 27.6±5.3 | 27.4±5.3 | 26.8±5.6 | 28.0±5.6 | 26.6±4.7 |
| Diabetes, % | 25 | 44 | 68 | 36 | 46 |
| HbA1c,% | 6.0±1.2 | 6.1±0.9 | 6.6±1.0 | 6.0±0.8 | 5.9±0.8 |
| eGFR, mL/min | 103.4±6.5 | 42.6±18.2 | 75.9±10.0 | 43.9±9.0 | 24.0±4.1 |
| Cholesterol, mg/dL | 210.1±47.9 | 202.8±57.7 | 201.7±48.1 | 204.1±68.1 | 201.3±43.0 |
| SBP, mm Hg | 126.9±15.6 | 136.0±18.7 | 137.8±16.4 | 135.5±17.5 | 135.9±22.1 |
| DBP, mm Hg | 83.4±10.6 | 78.1±11.5 | 75.6±7.5 | 79.4±10.3 | 76.7±14.6 |
| PP, mm Hg | 43.4±11.7 | 58.9±16.8 | 63.3±13.5 | 56.2±16.1 | 59.2±18.9 |
| aSBP, mm Hg | 115.7±13.9 | 126.0±19.2 | 126.6±13.5 | 125.4±16.8 | 126.7±25.6 |
| aDBP, mm Hg | 85.1±10.9 | 79.9±11.2 | 77.6±6.8 | 81.0±10.2 | 78.7±14.3 |
| aPP, mm Hg | 30.4±8.7 | 46.9±18.1 | 49.0±12.2 | 44.5±15.7 | 48.0±23.9 |
| Heart rate, beats per min | 75.5±12.6 | 66.7±11.0 | 69.2±9.3 | 66.4±11.2 | 65.7±11.4 |
| AIx,% | 15.7±14.2 | 24.9±11.6 | 27.9±7.6 | 24.8±11.4 | 23.0±13.7 |
| CF PWV, m/s | 7.6±1.9 | 10.0±2.7 | 9.9±2.0 | 9.8±2.9 | 10.5±2.7 |
| PPA, % | 1.44±19 | 1.25±0.21 | 1.30±0.14 | 1.25±0.17 | 1.22±0.21 |
| Hemoglobin, g/dL | 13.9±1.4 | 12.7±1.6 | 13.0±1.5 | 12.8±1.3 | 11.8±1.8 |
Abbreviations: aDBP, aortic diastolic blood pressure; AIx, augmentation index; aPP, aortic pulse pressure; aSBP, aortic systolic blood pressure; BMI, body mass index; CF PWV, carotid‐femoral pulse wave velocity; CKD, chronic kidney disease; DBP, diastolic blood pressure; eGFR, estimated glomerular filtration rate; HbA1c, glycated hemoglobin; PP, pulse pressure; PPA, pulse pressure amplification; SBP, systolic blood pressure.
Bold values indicate P<.05 vs control.
In patients with CKD stage 2 to 4 of the determined parameters, PPA and hemoglobin level were associated with a decline in renal function. In addition, PPA was associated with age (r=−0.31), sex (r=0.31), heart rate (r=0.35), central SBP (r=−0.48), brachial SBP (r=−0.21), and total cholesterol (r=−0.25). Aortic PWV (r=−0.17), eGFR (r=0.02), and glycated hemoglobin (r=−0.05) were not associated with PPA.
In stepwise linear regression analysis of PPA in CKD patients, we determined age, female sex, heart rate, and central SBP as determinants of PPA, whereas in controls, age was the determining factor (Table 2).
Table 2.
Stepwise Linear Regression Analysis of Pulse Pressure Amplification in Patients With Chronic Kidney Disease (a) and Control Patients (b)
| Parameters | In/Out | R 2 Increment% | Beta Coefficient | Lower CI | Upper CI | P Value |
|---|---|---|---|---|---|---|
| (a) | ||||||
| Central SBP | In | 16 | −0.324 | −0.495 | −0.171 | <.001 |
| Heart rate | In | 10 | 0.296 | 0.240 | 0.770 | <.001 |
| Female | In | 6 | −0.255 | −15.559 | −3.827 | .001 |
| Age | In | 5 | −0.238 | −0.493 | −0.099 | .004 |
| eGFR | Out | |||||
| aPWV | Out | |||||
| R 2=0.37 | ||||||
| (b) | ||||||
| Age | In | 7 | −0.271 | −0.641 | −0.071 | .015 |
| Central SBP | Out | |||||
| Heart rate | Out | |||||
| Female | Out | |||||
| eGFR | Out | |||||
| aPWV | Out | |||||
| R 2=0.07 | ||||||
Abbreviations: aPWV, aortic pulse wave velocity; CI, confidence interval; eGFR, estimated glomerular filtration rate; SBP, systolic blood pressure.
During the prospective follow‐up period, 16 combined renal endpoints were recorded. According to the univariate Cox regression analysis, we determined proteinuria, eGFR, and PPA as significant predictors of renal endpoints. Mortality did not interfere with the effect of PPA on renal endpoints. To assess whether eGFR and PPA interact, we performed Cox regression analysis for interaction for continuous and categorized measures of renal function (CKD stage) and PPA (median). We observed in both circumstances significant interaction between both factors (Table 3).
Table 3.
Univariate Cox Regression Analysis of Renal Endpoint (a) and Cox Regression for Interaction Between Renal Function and PPA (b)
| Parameter | Regression Coefficient | SE | P Value |
|---|---|---|---|
| (a) | |||
| Age | 0.012 | 0.013 | .36 |
| Sex | 0.263 | 0.415 | .52 |
| aPWV | 0.009 | 0.101 | .89 |
| eGFR | −0.037 | 0.011 | .001 |
| Proteinuria | 0.002 | 0.001 | <.001 |
| PPA | −3.390 | 1.682 | .04 |
| (b) | |||
| eGFR‐PPA | −0.044 | 0.015 | 0.003 |
| Categorized CKD‐PPA | 2.099 | 0.625 | 0.001 |
Abbreviations: aPWV, aortic pulse wave velocity; eGFR, estimated glomerular filtration rate; SE, standard error. Categorized chronic kidney disease (CKD) contains CKD stage 2 to 4 and categorized PPA is stratified according to the median of pulse pressure amplification (PPA).
Next, we analyzed the relative risk for developing renal endpoints unadjusted and adjusted for age and proteinuria (Table 4). Severe CKD (stage 4), but not mild to moderate CKD (stage 2 or 3), predicted unadjusted and adjusted renal endpoints. PPA categorized according to its median did not reach significance. However, the combination of CKD categorized as severe vs mild to moderate and PPA categorized according to the median identified the subgroup of patients with severe CKD and low PPA as a group for significantly increased risk to reach renal endpoints. Patients with severe CKD with PPA above the median had significantly lower risk to reach renal endpoints similar to patients with CKD stage 2 or 3. This remained significant after adjustment for age and proteinuria. Kaplan‐Meier curves confirmed this result with a log‐rank P<.001 (Figure).
Table 4.
Renal Endpoints According to CKD and PPA
| Prognostic Variable | Patients, No. | Renal Endpoints, No. (%) | OR (95% CI) | Adjusteda OR (95% CI) |
|---|---|---|---|---|
| CKD (χ2 7.4) | 128 | 16 | ||
| CKD 2 | 36 | 1 (3) | 1.0 | 1.0 |
| CKD 3 | 55 | 6 (11) | 2.8 (0.8–9.5) | 2.1 (0.6–7.5) |
| CKD 4 | 37 | 9 (25) | 5.6 (1.6–19.8) | 3.8 (1.1–14.2) |
| PPA (χ2 4.3) | 128 | 16 | ||
| PPA ≥25 | 63 | 5 (8) | 1.0 | 1.0 |
| PPA <25 | 65 | 11 (18) | 2.5 (0.9–7.0) | 2.0 (0.6–6.4) |
| CKD and PPA (χ2 28.7) | 128 | 16 | ||
| CKD 2 or 3 and PPA ≥25 | 49 | 4 (8) | 1.0 | 1.0 |
| CKD 2 or 3 and PPA <25 | 45 | 3 (7) | 0.7 (0.1–3.2) | 0.3 (0.1–3.0) |
| CKD 4 and PPA ≥25 | 17 | 1 (6) | 0.5 (0.1–5.3) | 0.6 (0.1–5.5) |
| CKD 4 and PPA <25 | 17 | 8 (47) | 8.1 (2.4–27.7) | 5.6 (1.5–21.9) |
Abbreviation: CI, confidence interval; CKD, chronic kidney disease; OR, odds ratio; PPA, pulse pressure amplification. Bold values indicate P<.05 vs control.
Adjusted for age and PCR.
Figure .
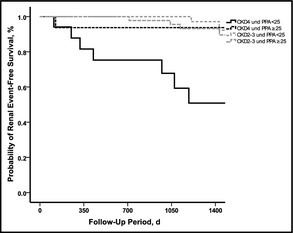
Kaplan‐Meier curve for renal endpoint‐free survival. Probability of renal endpoint‐free survival decreases significantly (log‐rank test P<.001) with advanced chronic kidney disease (CKD) stage 4 and pulse pressure amplification (PPA) <25. By contrast, CKD patients stage 4 with a PPA ≥25 or CKD patients stage 2 or 3 with PPA<25 or PPA ≥25 demonstrate a significantly higher renal endpoint‐free survival (χ2 28.7, log‐rank P<.001).
Discussion
PPA reflects an early marker of arterial stiffness related to functional impairments and arterial pulsatility.11, 25 We followed the idea that arterial stiffness influences the development of CKD and in this line PPA may determine CKD progression as a functional marker of arterial stiffness. Keeping this in mind, the major finding of this study, and to our knowledge the first time reported, is that reduced PPA in CKD, stratified for CKD stage 2 to 4, is significantly associated with renal function and predicts renal endpoints.
In cross‐sectional analysis, PPA was lower in patients with CKD as compared with controls. Stratification according to CKD stages demonstrated a decline in PPA with advancing CKD. The decrease of PPA with declining renal function was neither affected by age nor by mean arterial pressure, which are typical determinants of structural arterial stiffness and therefore point to an interaction between renal worsening and structural arterial stiffness. Although the CKD cohort had a median age of 60 years, the observed PPA level was comparable with recently published findings of levels of PPA in elderly populations aged 80 years and older.3, 21, 25
As a result of the elevated cardiovascular morbidity and mortality in CKD, several authors suggested a role of accelerated vascular aging in CKD.26, 27, 28 Therefore, in this cohort, CKD may be interpreted as a factor of vascular aging, and therefore PPA likely represents an early functional marker,29 which, in CKD stage 2 to 4, is linked to renal function via aortic pulse pressure. Following this, we further determined the factors involved in reduced PPA in CKD to identify processes potentially involved in vascular aging. Apart from the nonmodifiable factors age and sex, we identified central SBP as a potential origin of reduced PPA.
Prospective follow‐up identified PPA as a new predictive factor for progressive renal disease. We detected an interaction between renal and large artery function in these CKD patients. This interaction had its clinical relevance particularly in patients with severe CKD (stage 4). Here, we demonstrated that patients with severe CKD and low PPA had the highest risk for developing renal endpoints, whereas patients with severe CKD but PPA above the median had low risk for developing renal endpoints similar to patients with mild to moderate CKD (stage 2 or 3). Kaplan‐Meier analysis confirmed this finding, as approximately half of these patients reached a renal endpoint, whereas all other groups had comparable endpoints.
Study Limitations and Strengths
The limitation of this study is the small cohort size reflecting two centers and the small number of endpoints. Furthermore, the heterogeneity of renal disease is a limitation with this sample size. In addition, as a result of the heterogeneity of renal disease, numerous factors are involved in CKD progression, which are not covered in this study. Other factors such as the use of renin‐angiotensin inhibitors are difficult to assess as the majority of CKD patients receive these drugs. However, the strength of the study is the follow‐up period of 42 months.
Conclusions
PPA was shown to be strongly reduced in CKD patients, to be associated with renal function, and to predict renal endpoints in severe CKD in a prospective follow‐up. The determination of PPA may reflect an easy method to address the role of arterial stiffness in CKD progression as it incorporates the important information of SBP. Multicenter studies are needed to confirm this result and to address whether the increase in PPA may protect against CKD progression.
Funding
S. W. is the inventor of a patent that is partly used in the ARCSolver method. The other authors report no conflicts of interest.
J Clin Hypertens (Greenwich). 2014;16:401–405. DOI: 10.1111/jch.12316. ©2014. Wiley Periodicals, Inc.
References
- 1. Remington JW, Wood EH. Formation of peripheral pulse contour in man. J Appl Physiol. 1956;9:433–442. [DOI] [PubMed] [Google Scholar]
- 2. Peralta CA, Jacobs DR Jr, Katz R, et al. Association of pulse pressure, arterial elasticity, and endothelial function with kidney function decline among adults with estimated GFR >60 mL/min/1.73 m(2): the Multi‐Ethnic Study of Atherosclerosis (MESA). Am J Kidney Dis. 2012;59:41–49. [DOI] [PMC free article] [PubMed] [Google Scholar]
- 3. McEniery CM, Yasmin, Hall IR, et al. ACCT Investigators. Normal vascular aging: differential effects on wave reflection and aortic pulse wave velocity: the Anglo‐Cardiff Collaborative Trial (ACCT). J Am Coll Cardiol. 2005;46:1753–1760. [DOI] [PubMed] [Google Scholar]
- 4. Agabiti‐Rosei E, Mancia G, O'Rourke MF, et al. Central blood pressure measurements and antihypertensive therapy: a consensus document. Hypertension. 2007;50:154–160. [DOI] [PubMed] [Google Scholar]
- 5. Laurent S, Cockcroft J, Van Bortel L, et al. European Network for Non‐invasive Investigation of Large Arteries. Expert consensus document on arterial stiffness: methodological issues and clinical applications. Eur Heart J. 2006;27:2588–2605. [DOI] [PubMed] [Google Scholar]
- 6. Blacher J, Guerin AP, Pannier B, et al. Impact of aortic stiffness on survival in end‐stage renal disease. Circulation. 1999;99:2434–2439. [DOI] [PubMed] [Google Scholar]
- 7. Safar ME, Blacher J, Pannier B, et al. Central pulse pressure and mortality in end‐stage renal disease. Hypertension. 2002;39:735–738. [DOI] [PubMed] [Google Scholar]
- 8. Temmar M, Liabeuf S, Renard C, et al. Pulse wave velocity and vascular calcification at different stages of chronic kidney disease. J Hypertens. 2010;28:163–169. [DOI] [PubMed] [Google Scholar]
- 9. Upadhyay A, Hwang SJ, Mitchell GF, et al. Arterial stiffness in mild‐to‐moderate CKD. J Am Soc Nephrol. 2009;20:2044–2053. [DOI] [PMC free article] [PubMed] [Google Scholar]
- 10. Briet M, Collin C, Karras A, et al. Nephrotest Study Group. Arterial remodeling associates with CKD progression. J Am Soc Nephrol. 2011;22:967–974. [DOI] [PMC free article] [PubMed] [Google Scholar]
- 11. Avolio AP, Van Bortel LM, Boutouyrie P, et al. Role of pulse pressure amplification in arterial hypertension: experts' opinion and review of the data. Hypertension. 2009;54:375–383. [DOI] [PubMed] [Google Scholar]
- 12. Wassertheurer S, Mayer C, Breitenecker F. Modeling arterial and left ventricular coupling for non‐invasive measurements. Simulat Model Pract Theor. 2008;16:988–997. [Google Scholar]
- 13. Wassertheurer S, Kropf J, Weber T, et al. A new oscillometric method for pulse wave analysis: comparison with a common tonometric method. J Hum Hypertens. 2010;24:498–504. [DOI] [PMC free article] [PubMed] [Google Scholar]
- 14. Weber T, Wassertheurer S, Rammer M, et al. Wave reflections, assessed with a novel method for pulse wave separation, are associated with end‐organ damage and clinical outcomes. Hypertension. 2012;60:534–541. [DOI] [PubMed] [Google Scholar]
- 15. Weber T, Wassertheurer S, Rammer M, et al. Validation of a brachial cuff‐based method for estimating central systolic blood pressure. Hypertension. 2011;58:825–832. [DOI] [PubMed] [Google Scholar]
- 16. Weiss W, Gohlisch C, Harsch‐Gladisch C, et al. Oscillometric estimation of central blood pressure: validation of the Mobil‐O‐Graph in comparison with the SphygmoCor device. Blood Press Monit. 2012;17:128–131. [DOI] [PubMed] [Google Scholar]
- 17. Hametner B, Wassertheurer S, Kropf J, et al. Wave reflection quantification based on pressure waveforms alone‐Methods, comparison, and clinical covariates. Comput Methods Programs Biomed. 2013;109:250–259. [DOI] [PubMed] [Google Scholar]
- 18. Hametner B, Wassertheurer S, Kropf J, et al. Oscillometric estimation of aortic pulse wave velocity: comparison with intra‐aortic catheter measurements. Blood Press Monit. 2013;.18(3):173–176. [DOI] [PubMed] [Google Scholar]
- 19. Luzardo L, Lujambio I, Sottolano M, et al. 24‐h ambulatory recording of aortic pulse wave velocity. Hypertens Res. 2012;35:980–987. [DOI] [PubMed] [Google Scholar]
- 20. Protogerou AD, Argyris A, Nasothimiou E, et al. Feasibility and reproducibility of noninvasive 24‐h ambulatory aortic blood pressure monitoring with a Brachial Cuff‐based oscillometric device. Am J Hypertens. 2012;25:876–882. [DOI] [PubMed] [Google Scholar]
- 21. Nunan D, Wassertheurer S, Lasserson D, et al. Assessment of central haemomodynamics from a brachial cuff in a community setting. BMC Cardiovasc Disord. 2012;26:12. [DOI] [PMC free article] [PubMed] [Google Scholar]
- 22. Reppel M, Franzen K, Bode F, et al. Central hemodynamics and arterial stiffness during the finals of the world cup soccer championship 2010. Int J Cardiol. 2013;166(3):627–632. [DOI] [PubMed] [Google Scholar]
- 23. Papaioannou TGProtogerou AD, Stefanadis C.What to anticipate from pulse pressure amplification. J Am Coll Cardiol. 2010;55:1038–1040. [DOI] [PubMed] [Google Scholar]
- 24. Regnault V, Thomas F, Safar ME, et al. Sex difference in cardiovascular risk: role of pulse pressure amplification. J Am Coll Cardiol. 2012;59:1771–1777. [DOI] [PMC free article] [PubMed] [Google Scholar]
- 25. Benetos A, Gautier S, Labat C, et al. Mortality and cardiovascular events are best predicted by low central/peripheral pulse pressure amplification but not by high blood pressure levels in elderly nursing home subjects: the PARTAGE (Predictive Values of Blood Pressure and Arterial Stiffness in Institutionalized Very Aged Population) study. J Am Coll Cardiol. 2012;60:1503–1511. [DOI] [PubMed] [Google Scholar]
- 26. Jeanclos E, Schork NJ, Kyvik KO, et al. Telomere length inversely correlates with pulse pressure and is highly familial. Hypertension. 2000;36:195–200. [DOI] [PubMed] [Google Scholar]
- 27. Gusbeth‐Tatomir P, Covic A. Causes and consequences of increased arterial stiffness in chronic kidney disease patients. Kidney Blood Pres Res. 2007;30:97–107. [DOI] [PubMed] [Google Scholar]
- 28. Briet M, Pierre B, Laurent S, London GM. Arterial stiffness and pulse pressure in CKD and ESRD. Kidney Int. 2012;82:388–400. [DOI] [PubMed] [Google Scholar]
- 29. Tsirpanlis G. Cellular senescence, cardiovascular risk, and CKD: a review of established and hypothetical interconnections. Am J Kidney Dis. 2008;51:131–144. [DOI] [PubMed] [Google Scholar]