

Abstract
Seasonal variation in blood pressure (BP) has been observed in different populations. However, only few studies have focused on BP seasonality in diabetic patients. This study examined the seasonal patterns in BP in 62,589 patients with type 1 diabetes mellitus (T1DM) and in 99,546 patients with type 2 diabetes mellitus (T2DM) from the German/Austrian Diabetes Follow‐up Registry. Adjusted mean BP values revealed seasonal cycles of 12 months, with higher BP in colder months. Using harmonic regression models, the estimated systolic BP difference throughout the year was 2.28/2.48 mm Hg in T1DM/T2DM (both P<.001). Interestingly, seasonal variation in diastolic BP was larger in T1DM than in T2DM (1.24/0.64 mm Hg, P<.001). A sex difference was observed in T1DM only, while age differences occurred in both types of diabetes. Correlations between BP and potentially related factors such as outdoor temperature indicated that reasons underlying BP seasonality are likely to be complex and vary by subgroup.
Hypertension is a common comorbidity in both type 2 (T2DM) and type 1 (T1DM) diabetes mellitus. Patients with T2DM may have hypertension at diabetes onset, whereas patients with T1DM usually develop hypertension as a result of nephropathy, but also weight gain and arterial stiffness over the years. Depending on age, 20% to 60% of T2DM patients and up to 30% of T1DM patients are affected by hypertension.1 Since high blood pressure (BP) is one of the main risk factors for cardiovascular events and microvascular complications,1 current European guidelines (2013 European Society of Hypertension/European Society of Cardiology [ESH/ESC] guidelines for the management of arterial hypertension) recommend a systolic BP (SBP) <140 mm Hg and a diastolic blood pressure (DBP) <85 mm Hg for patients with diabetes.2
Various epidemiologic studies observed that BP levels vary by season.3 Higher BP during cold seasons has been described in both normotensive4, 5 and hypertensive4, 6, 7, 8 patients as well as in children and adolescents9, 10 and in adults.11, 12, 13 However, only few studies focused on seasonal changes of BP in diabetic patients.14, 15 Thus, it remains unclear whether this cyclic behavior observed in various populations also applies to diabetic patients.
The objective of the present analysis was to investigate whether and to what extent seasonal variation in BP exists in T1DM and T2DM patients. In addition, we examined whether seasonal patterns differ between age strata, sex, and type of diabetes. Knowledge of the extent of seasonality in BP in diabetic patients could optimize patient care and patient‐self management in order to achieve BP targets, since seasonality may affect the classification of patients as normotensive or hypertensive. Furthermore, seasonal patterns in BP should be taken into consideration when setting up clinical trials.
Patients and Methods
The DPV Registry
The Diabetes Follow‐up Registry (DPV) is a German/Austrian standardized computer‐based prospective observational multicenter survey for all types of diabetes. Data are collected longitudinally at 377 diabetes centers (352 in Germany and 25 in Austria, March 2013) during routine patient care and documented in an electronic health record. Anonymized data are transmitted semiannually to the University of Ulm for central validation. Data are reported back to the diabetes centers for correction of implausible and missing data.16 The database comprises demographic and anthropometric characteristics as well as diabetes‐related variables covering therapy, comorbidities, and disease outcomes.17 The ethics committee of the medical faculty of the University of Ulm and the institutional review boards at the participating diabetes centers approved data collection.
Study Cohort
For the present analysis, all SBP and DBP values measured between January 2003 and December 2012 were extracted from DPV. According to the ESH/ESC guidelines for the management of arterial hypertension, measurements were performed by trained personnel during routine care in pediatric or internal practices using validated auscultatory semiautomatic or oscillometric sphygmomanometers. BP was measured at the heart level in a sitting position after several minutes of rest with a bladder suitable for individual upper arm width. BP measurement error was reduced by three consecutive BP readings per occasion.2, 18 SBP (DBP) values outside of the range of 50–300 (30–250) mm Hg were considered implausible and therefore excluded. If a patient had more than one BP measurement in a single month, the median value was used for this month. Patients treated with antihypertensive medication (7.6% of T1DM patients, 42% of T2DM patients) were excluded in order to avoid bias.
Altogether, 732,179 BP values of 62,589 T1DM patients and 254,639 BP values of 99,546 T2DM patients were analyzed (Figure 1). For subgroup comparisons, BP values were stratified according to sex, age (<10, 10<20, 20<30, 30<40, 40<50, ≥50 years for T1DM; <40, 40<50, 50<60, 60<70, 70<80, ≥80 years for T2DM), duration of diabetes (<5, 5<10, 10<20, 20<30, ≥30 years), and presence of hypertension (never; at some but not all of the patient's visits, at each of the patient's visits). Hypertension was determined according to European guidelines (>140/85 mm Hg)2 for adults and according to the German KiGGS reference values for pediatric patients younger than 18 years (>95th percentile).19 German mean monthly outdoor temperature and sunshine duration in 2003–2012 were extracted from Germany's National Meteorological Service.20 These data were used as parametric measures of seasonality attributable to environmental variation. For 2009–2012, an index of consultations due to acute respiratory disorders, weekly released by the Robert Koch Institute,21 was aggregated per month and used as a proxy for the frequency of acute respiratory disorders.
Figure 1.
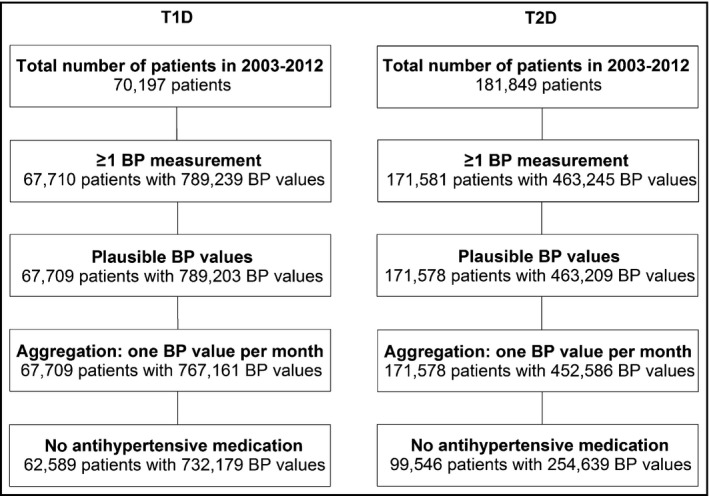
Selection of the study population. T1D indicates type 1 diabetes; T2D, type 2 diabetes; BP, blood pressure.
Statistical Methods
All statistical analyses were performed using SAS 9.4 (Statistical Analysis Software, SAS Institute Inc, Cary, NC). P values <.05 of two‐sided tests were considered statistically significant.
In order to consider the fact that some patients had several visits within the 10‐year period, linear mixed models were applied to compute monthly aggregated BP values. Least‐square means for each of the 120 months of the 10‐year period, adjusted for sex, age group, duration of diabetes group, and patient‐specific random effect, were calculated and plotted separately for T1DM and T2DM.
Time series can be decomposed in long‐term trend, seasonal variation, and irregular fluctuation. Since we were only interested in seasonal patterns, we removed the long‐term effect (year of observation) based on a linear mixed model with SBP or DBP as dependent variables and year in categories as fixed effect. A patient‐specific random effect with unstructured covariance matrix was included to account for repeated measurements in patients. The resulting residuals were extracted and used to model seasonal patterns.
Seasonal patterns were examined using harmonic regression models (SAS procedure NLMIXED). This approach allows estimating amplitude and phase shift of seasonal variation. Time dependence of the year‐adjusted SBP and DBP values was modelled by sine and cosine terms.22, 23 Nonlinear mixed regression models additionally included the potential confounding variables of age, sex, and duration of diabetes (in categories) and patient‐specific random effects with unstructured covariance matrix:
The resulting coefficients of the sine and cosine term (β S and β C) allowed to estimate the amplitude and the phase of the seasonal pattern.22 Corresponding 95% confidence limits (CLs; lower CL–upper CL) were computed by the Delta method.24 We used first‐order interaction terms between the trigonometric functions of month and sex, age, or duration of diabetes to compare amplitude and phase shift between subgroups. Outdoor temperature was modelled in a separate harmonic regression model to compare the estimated seasonal patterns of BP and temperature.
Spearman's rank correlation coefficient (r s) with 95% confidence interval was calculated to assess the association between monthly aggregated BP values, adjusted for year of observation, age, sex, and duration of diabetes, and potentially related influencing factors.
Results
Patient characteristics can be found in Table 1. A total of 52.7% of the T1DM patients and 51.8% of the T2DM patients were men. In T1DM, an average of 11.7 BP measurements (range 1–96 BP values) per patient were available, with most of the measurements obtained from patients aged 10<20 years (62.9%). A total of 25%, 8%, 5%, 21%, and 41% of all T1DM patients had 1, 2, 3, 4–10, and >10 BP measurements, respectively. The mean time between measurements was 4.3±3.6 months. In T2DM, an average of 2.6 BP measurements (range 1–53 BP values) per patient were available, with most of the values obtained from patients 60<70 years and 70<80 years of age (each 29.1%). A total of 70%, 13%, 4%, 2%, and 11% of all T2DM patients had 1, 2, 3, 4, and >4 BP measurements, respectively. Mean duration between two BP measurements was 7.9±4.7 months. A descriptive patient summary for each of the 10 years analyzed can be found in Table SI.
Table 1.
Patient Characteristics and Distribution of BP Values
| T1DM | T2DM | |||
|---|---|---|---|---|
| Patients, No. | 62,589 | 99,546 | ||
| Men, % | 52.7 | 51.8 | ||
| Age at onset, y | 10.2 (6.0–15.1) | 57.8 (48.0–67.5) | ||
| Normotensive, %a | 35.8 | 42.8 | ||
| Hypertensive, %a | 9.5 | 39.7 | ||
| BP values, No. | 732,179 | 254,639 | ||
| BP values stratified by sex, % | Male | 52.0 | Male | 51.6 |
| BP values stratified by age group, % | <10 y | 25.7 | ||
| 10≤20 y | 62.9 | |||
| 20≤30 y | 3.0 | |||
| 30≤40 y | 2.2 | <40 y | 4.3 | |
| 40≤50 y | 2.5 | 40≤50 y | 8.1 | |
| ≥50 y | 3.7 | 50≤60 y | 17.9 | |
| 60≤70 y | 29.1 | |||
| 70≤80 y | 29.1 | |||
| ≥80 y | 11.5 | |||
| BP values stratified by duration of diabetes group, % | <5 y | 56.4 | <5 y | 32.4 |
| 5≤10 y | 27.4 | 5≤10 y | 24.9 | |
| 10≤20 y | 12.4 | 10≤20 y | 28.9 | |
| 20≤30 y | 2.1 | 20≤30 y | 9.8 | |
| ≥30 y | 1.7 | ≥30 y | 4.0 | |
Abbreviations: BP, blood pressure; T1DM, type 1 diabetes mellitus; T2DM, type 2 diabetes mellitus. Data shown are numbers of patients, median with upper and lower quartiles, or percentages. aAt each of the patient's visits.
Mean monthly BP, adjusted for age, sex, and duration of diabetes, indicated sinusoidal patterns for both T1DM and T2DM patients, with peaks in winter months and nadirs in summer months (Figure 2). BP values were higher and fluctuated more in T2DM compared with T1DM patients. In T1DM, subgroup analyses revealed lower BP levels in younger patients and in patients with shorter duration of diabetes, whereas the patterns observed in T2DM seemed to be less clear (not shown).
Figure 2.
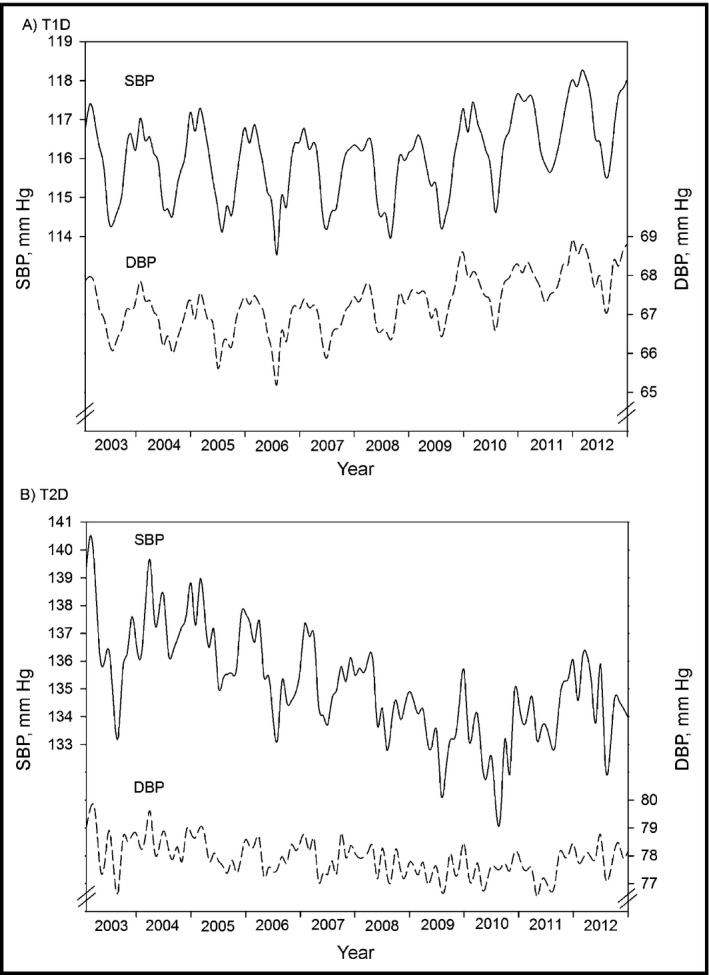
Systolic blood pressure (SBP) and SBP time series for patients with type 1 diabetes (T1D) and type 2 diabetes (T2D). Monthly aggregated SBP (solid line) and diastolic blood pressure (DBP) values (dashed line), adjusted for age, sex, and duration of diabetes in (A) T1D patients (A) and T2D patients (B). Years 2003–2012. Note the different axis scales.
We used sine and cosine functions with 12‐month periods to model BP in harmonic regression. Figure 3 depicts the yearly seasonal patterns for both types of diabetes, estimated by a harmonic regression model, with adjustments for sex, age, and duration of diabetes. All four BP patterns are inversely related to the seasonal behavior of the German outdoor temperature (Figure 3) and duration of sunshine (not shown).
Figure 3.
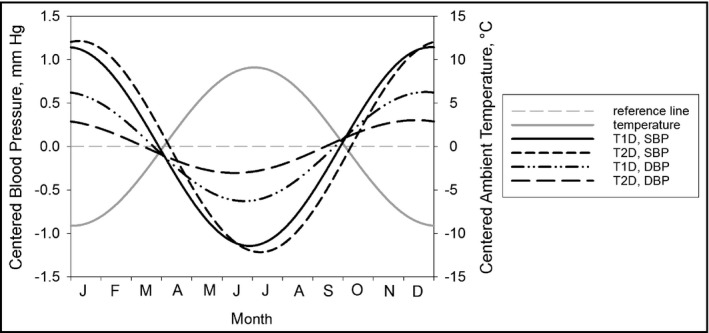
Seasonal pattern in systolic blood pressure (SBP) and diastolic blood pressure (DBP), estimated by harmonic regression models (adjusted for sex, age, and duration of diabetes). SBP in type 1 diabetes (T1D): solid black line; SBP in type 2 diabetes (T2D): short dashed line; DBP in T1D: dash dotted line; DBP in T2D: long dashed line; outdoor temperature: solid grey line. Reference line (grey dashed line) indicates no seasonal variation.
Comparison of T1DM and T2DM
The estimated SBP amplitude was 1.14 (1.11–1.18) mm Hg (P<.001) in T1DM patients and 1.24 (1.17–1.31) mm Hg (P<.001) in T2DM patients (Table 2), ie, an estimated difference of 2.28 mm Hg and 2.48 mm Hg, respectively, between summer and winter. The estimated overall difference in SBP amplitude between T1DM and T2DM was significant (−0.10 [−0.18 to −0.02] mm Hg, P=.0107). Stratification by sex revealed that the difference remained significant in men (difference −0.29 [−0.40 to 0.18] mm Hg, P<.001), but not in women (difference 0.08 [−0.03 to 0.19] mm Hg, P=.1621).
Table 2.
Estimated SBP and DBP Amplitudes
| T1DM | T2DM | Difference T1DM vs T2DM | |||||
|---|---|---|---|---|---|---|---|
| Amplitude | P Value | Amplitude | P Value | Amplitude | P Value | ||
| SBP | Overalla | 1.14 (1.11–1.18) | <.001 | 1.24 (1.17–1.31) | <.001 | −0.10 (−0.18 to −0.02) | .011 |
| Femaleb | 1.26 (1.20–1.31) | <.001 | 1.18 (1.08–1.28) | <.001 | 0.08 (−0.03 to 0.19) | .162 | |
| Maleb | 1.02 (0.97–1.07) | <.001 | 1.31 (1.21–1.41) | <.001 | −0.29 (−0.40 to −0.18) | <.001 | |
| DBP | Overalla | 0.62 (0.60–0.65) | <.001 | 0.32 (0.27–0.37) | <.001 | 0.30 (0.25 to 0.36) | <.001 |
| Femaleb | 0.68 (0.65–0.72) | <.001 | 0.32 (0.25–0.39] | <.001 | 0.37 (0.29 to 0.45) | <.001 | |
| Maleb | 0.57 (0.53–0.60) | <.001 | 0.33 (0.26–0.39) | <.001 | 0.24 (0.17 to 0.32) | <.001 | |
| PP | Overalla | 0.52 (0.49–0.56) | <.001 | 0.94 (0.88–1.00) | <.001 | −0.42 (−0.49 to −0.35) | <.001 |
| Femaleb | 0.58 (0.53–0.63) | <.001 | 0.87 (0.78–0.96) | <.001 | −0.29 (−0.40 to −0.19) | <.001 | |
| Maleb | 0.47 (0.42–0.52) | <.001 | 1.01 (0.92–1.10) | <.001 | −0.54 (−0.64 to −0.44) | <.001 | |
Abbreviations: DBP, diastolic blood pressure; PP, pulse pressure; SBP, systolic blood pressure; T1DM, type 1 diabetes mellitus; T2DM, type 2 diabetes mellitus. Amplitudes estimated by harmonic regression model based on blood pressure (BP) values adjusted for long‐term trends (year of measurement). Overall summer‐winter difference is twice the amplitude. aAdjusted for age, sex, and duration of diabetes. bAdjusted for age and duration of diabetes.
In contrast to SBP, seasonal variation in DBP was significantly stronger (P<.001) in T1DM patients than in T2DM patients (Table 2). The association was confirmed for both men and women. Due to this finding, we analyzed the variation of peripheral pulse pressure (PP) (Table 2). Overall, PP amplitude was significantly lower in T1DM than in T2DM (0.52 [0.49–0.56] v. 0.94 [0.88–1.00]; difference: −0.42 [−0.49 to −0.35], all P<.001), with this difference being more pronounced in men than in women.
In agreement with the time series plots, the lowest model‐based SBP estimates were observed in summer months (T1DM: June 28th [26th–29th]; T2DM: July 8th [4th–12th]) and the highest values in winter months. Minimum DBP values were observed in June (T1DM: June 22nd [20th–25th]; T2DM: June 13th [3rd–22nd]). According to this, seasonal behavior of SBP was more simultaneous with DBP in T1DM patients than in T2DM patients. Overall, the phase shift difference between T1DM and T2DM patients was significant for both SBP (P<.001) and DBP (P=.011).
Subgroup Comparisons in Patients With T1DM
Subgroup comparisons were conducted to reveal differences in amplitude and phase shift between sex, age groups, duration of diabetes groups, and presence of hypertension (Figure 4). Within T1DM patients, age‐ and duration‐adjusted BP amplitude was higher in women than in men (SBP: 1.27 vs 1.03, DBP: 0.69 vs 0.57, both P<.001). Accordingly, PP amplitude was also significantly higher in women (0.11 [0.05–0.18], P<.001). SBP amplitude was highest in patients 50 years and older. Children and adolescents (younger than 20 years) were more sensitive to seasonal DBP changes than patients in middle age. Amplitude of SBP was nearly similar at all durations of diabetes, but DBP amplitude decreased with increasing duration of diabetes. Patients categorized as hypertensive (BP ≥140/85 mm Hg for adults, >95th percentile of the German KiGGS reference values for pediatric patients younger than 18 years) at none/each of their visits had the lowest/highest BP amplitude. There were no seasonal BP phase shifts between sexes, age groups, or duration of diabetes groups (all P>.05).
Figure 4.
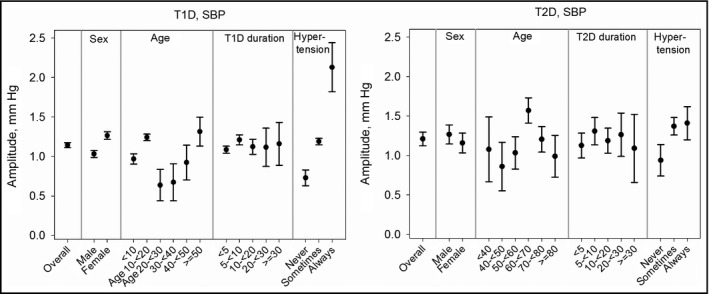
Seasonal pattern in systolic blood pressure (SBP) and diastolic blood pressure (DBP) by subgroup. SBP amplitudes with 95% confidence interval for type 1 diabetes (T1D) and type 2 diabetes (T2D), adjusted for sex and/or age and/or duration of diabetes. Overall summer‐winter changes are twice the amplitudes.
Subgroup Comparisons in Patients With T2DM
In contrast to T1DM patients, no significant sex differences in BP amplitudes were observed in T2DM patients (Figure 4, SBP: P=.223; DBP: P=.988; PP: P=.109). In order to examine premenopausal and postmenopausal women separately, we repeated the analysis stratified by younger than 50 and 50 years and older. Sex differences remained insignificant in both age groups. Patients aged 60<70 years had significantly stronger seasonal variation in both SBP and DBP than all other age groups (all P<.05) except patients younger than 40, whereas duration of diabetes had no effect on BP amplitude. Patients with hypertension at some/each of their visits had significantly higher SBP variation than patients without hypertension (both P<.001). There were no significant time shifts in seasonal BP phases between sexes, age, or duration groups (all P>.05).
As a result of the seasonal variation in BP, the proportion of patients classified as hypertensive varied throughout the year. In T1DM patients, hypertension was least prevalent in July (23.3%) and most prevalent in February (30.3%). In T2DM patients, the proportion of hypertension varied between 44.5% in July and 50.3% in March. We additionally examined the proportion of hypertension in summer (June to August) and winter (December to February) among patients who had BP values in both seasons. In both types of diabetes, hypertension was less prevalent in summer than in winter months (T1DM: 23.5% vs 31.1%, T2DM: 51.7% vs 55.8%).
Seasonal Variation in BP and Potentially Related Factors
From 2003 to 2012, German mean monthly outdoor temperature was highest in July (18.3°C) and lowest in January (0.5°C). Mean sunshine duration was longest in June (223 hours) and shortest in December (43 hours). Spearman's rank correlation (Table 3) indicated a strong inverse correlation between monthly aggregated adjusted BP and outdoor temperature or sunshine duration (all P<.001). Correlation coefficients were lowest for DBP in T2DM patients. The aggregated index of consultations because of acute respiratory diseases was highest in February and lowest in July, with some years having a second or third period with high values. Nevertheless, correlation coefficients indicated a strong positive association between respiratory diseases and BP (all P<.001).
Table 3.
Spearman Correlations Between BP and Potentially Influencing Factors
| T1DM | T2DM | |||
|---|---|---|---|---|
| SBP | DBP | SBP | DBP | |
| Outdoor temperature, °C | −0.875 (−0.911 to −0.825) | −0.864 (−0.903 to −0.810) | −0.802 (−0.858 to −0.727) | −0.476 (−0.603 to −0.324) |
| Sunshine duration, h | −0.792 (−0.851 to −0.715) | −0.800 (−0.857 to −0.725) | −0.658 (−0.749 to −0.543) | −0.499 (−0.623 to −0.352) |
| Index of consultationsa | 0.849 (0.745–0.913) | 0.792 (0.656–0.879) | 0.726 (0.556–0.837) | 0.411 (0.143–0.622) |
Abbreviations: DBP, diastolic blood pressure; SBP, systolic blood pressure; T1DM, type 1 diabetes mellitus; T2DM, type 2 diabetes mellitus. aDue to acute respiratory disorders. All P<.001. Correlations are based on monthly aggregated blood pressure (BP) values, adjusted for year of observation, age, sex, and duration of diabetes.
Since German mean temperature may not be fully representative for all participating diabetes centers, we ran harmonic regression models (adjusted for age, sex, and duration of diabetes) in order to compare BP amplitudes between South‐Eastern Germany (continental climate) and North‐Western Germany (lower variation in temperature throughout the year due to maritime influence). Neither SPB nor DBP amplitude differed significantly between the two regions for both types of diabetes (SBP difference within T1DM patients: 0.01 [−0.06 to 0.08] mm Hg, P=.80; SBP difference within T2DM patients: 0.15 [−0.03 to 0.33] mm Hg, P=.10).
Patients Taking Antihypertensive Medication
Those 5120 patients with T1DM and 72,032 patients with T2DM that were excluded in the previous analyses for taking antihypertensive medication (Figure 1) were analyzed using separate harmonic regression models, adjusted for age, sex, and duration of diabetes. In T1DM, patients with antihypertensive medication had an estimated overall SBP amplitude of 0.98 (0.64–1.32) mm Hg (P<.001). DBP amplitude was estimated to be 0.47 (0.27–0.68) mm Hg (P<.001). In T2DM patients taking antihypertensive medication, SBP amplitude was 0.84 (0.71–0.98) mm Hg and DBP amplitude was 0.27 (0.19–0.34) mm Hg (both P<.001),
Discussion
In this large observational study based on more than 160,000 patients, BP varied seasonally in both T1DM and T2DM patients, with higher values in winter months and lower values in summer months. Our findings are in line with results from Liang and colleagues,15 who analyzed seasonal variation in BP in a Taiwanese T2DM cohort with a mean age of 66.7 years. They found that both SBP and DBP were inversely correlated with the average monthly outdoor temperature, resulting in higher BP values in winter. In contrast, Wada and colleagues14 observed seasonal variation in SBP but not DBP in 430 Japanese patients with T2DM and early nephropathy (mean age 64.8 years). However, their negative finding could be due to the smaller sample size and the different methodical approach: They divided 1 year into four seasons instead of 12 months. In fact, we also observed weaker seasonality and more irregular fluctuation for DBP than for SBP in T2DM patients.
Interestingly, we observed no sex differences in T2DM, whereas seasonality was stronger in women than in men with T1DM. Sex differences in BP seasonality still seem controversial. Some recent studies based on various cohorts have observed no significant sex effect,6, 12 whereas others have reported either higher BP changes in men7 or in women,11, 25, 26 or sex effects depending on age.27 In pubertal girls, higher insulin resistance caused by increased estrogen levels might be a risk factor for arterial stiffness and therefore explain sex differences in BP seasonality in T1DM. However, in T2DM patients, stratification by premenopausal and postmenopausal women did not alter our results. Moreover, in contrast to other studies,3, 13, 25 advancing age was not clearly associated with higher summer‐winter differences of BP. Children and adolescents with T1DM as well as T2DM patients aged 60<70 years were more sensitive to BP changes than expected when assuming a monotonically increasing association. The latter finding is in line with an Israeli study in elderly patients with hypertension that observed stronger BP seasonality in patients 65 to 75 years compared with older patients.6 The former finding may be explained by the fact that most studies are limited to either children and adolescents or to adults, and therefore inhibit a comparison in a wider age range. Patients categorized as hypertensive had higher BP variation than normotensive patients.
Additional analyses indicated that both T1DM and T2DM patients taking antihypertensive medication have lower BP variation throughout the year than patients not taking antihypertensive medication. It could be supposed that patients taking antihypertensives have better control of their BP and slightly adjust their medication throughout the year and therefore have lower seasonal BP variation.
Potential Reasons for BP Seasonality
Estimated overall SBP/DBP changes from summer to winter were 2.28/1.24 mm Hg in T1DM patients and 2.48/0.64 mm Hg in T2DM patients, at differences in a mean outdoor temperature of approximately 18°C. These changes were lower than those reported in Japanese (approximately 25°C yearly temperature differences),28, 29, 30 Taiwanese (subtropical monsoon climate,15 Chinese (various temperate zones),13 and Iraqi (hot summer season)31 adult study cohorts, but comparable to results observed in studies with similar climatic conditions.4, 10, 26 A German study in both healthy and sick children and adolescents aged 3 to 21 years reported an SBP decrease of 0.12 mm Hg with each 1°C increase in outdoor temperature,10 which corresponds to our estimation. It was previously proposed that, paradoxically, seasonal BP differences are lower in countries with cold winters than in countries with mild winters,32 possibly attributable to better thermal efficiency standards leading to more constant indoor temperature.33 It is still under discussion to what extent indoor and outdoor temperature affects BP.32, 34
Nevertheless, BP seasonality is likely to be a complex phenomenon, with various factors influencing summer to winter changes. Several studies have suggested that seasonal BP changes could be modulated by changes in the serum/blood concentration of 25‐hydroxyvitamin D3, since the shorter duration of sunshine in winter months may cause a deficiency in vitamin D.35 In our study, we found strong inverse correlations between BP and hours of sunlight. However, patients likely spend plenty of time indoors. Therefore, sunshine duration should be considered as a parametric measure of environmental seasonality rather than a measure of the exposure of patients to sunlight alone. Our analyses suggested that the seasonal pattern of BP was not simultaneous with the prevalence of acute respiratory infections, indicating that BP seasonality is likely to be affected by further physiologic markers as well as by lifestyle and environmental factors. A large Austrian study revealed decreased body mass index, total cholesterol, and triglyceride levels in summer months compared with winter months in different age groups, both for men and women.27 Holiday season, increased physical activity, and decreased dietary fat intake could contribute to lower BP values in summer as well.36, 37 Choi and colleagues38 observed a seasonal variation for the association between ambient air pollution and BP. Our observation of amplitude and phase shift differences between type of diabetes, sex, or age groups suggest that the reasons for BP seasonality differ between those groups.
Clinical Relevance
The randomized controlled Action in Diabetes and Vascular Disease: Preterax and Diamicron Modified Release Controlled Evaluation (ADVANCE) trial39 investigating the effect of BP‐lowering therapy in T2DM patients (mean baseline age 66 years) found an average SBP/DBP lowering of 5.6/2.2 mm Hg over the duration of follow‐up (mean 4.3 years). The seasonal SBP/DBP differences we observed in patients with T2DM were about one half to one third of the BP intervention effect observed in the ADVANCE study. Moreover, the percentage of patients classified as hypertensive (BP >140/85 mm Hg) varied throughout the year. Therefore, BP seasonality should be considered when antihypertensive medication is adjusted, particularly in high‐risk patients and in countries that exhibit high summer to winter BP changes.40 Knowledge of BP seasonality in addition to accurate BP measurement and avoidance of terminal digit preference reduces misdiagnoses and prevents unnecessary costs as well as potential consequences of untreated hypertension.41 Patients should be trained in self‐monitoring of BP and in talking with their physician about adjusting the dose of their medication to achieve target BP values.42 Furthermore, BP differences throughout the year should be taken into account when conducting clinical trials.
Strengths and Limitations of the Study
Studies focusing on BP seasonality in diabetic patients are rare. Our study included both T1DM and T2DM patients and contrasted seasonal patterns of both types of diabetes. The large sample size permitted the analysis of monthly data instead of four seasons. In addition, age and sex subgroup comparisons could be performed. However, we acknowledge some limitations of our study. Although adherence to guidelines is mandatory for reimbursement in Germany, BP measurements are likely to have varied between patients. We have no information about the exact time of day BP was measured, and whether the measurement was taken by a nurse, a technician, or a physician. Furthermore, we considered only German mean temperature and duration of sunshine rather than patient‐level data. These may not fully represent all participating diabetes centers and patients. Nevertheless, climatic distinctions within Germany are rather small and therefore unlikely to significantly change results. While many pediatric T1DM patients were continuously documented over several years, patients with T2DM more often had shorter observation times and therefore lower numbers of BP measurements. Thus, the patient composition regarding sex, age, and duration of diabetes varied slightly over the 10‐year period studied. We addressed this issue by adjustments. In addition to amplitudes, we reported BP phases as calendar dates to further examine differences in seasonal patterns. However, especially in T1DM patients, BP time series exhibit dents in January or February, which could not be modelled or explained by ambient temperature, sunshine duration, or acute respiratory infections.
Conclusions
We found clear BP seasonality in both T1DM and T2DM patients. The range of seasonal changes varied among age groups in both types of diabetes, while sex differences were observed in T1DM only.
Disclosures
The authors declare that there are no conflicts of interest relevant to this article.
Supporting information
Table S1. Patient characteristics stratified by year
Acknowledgments
The authors thank all participating centers that contributed data for the present analysis, a detailed list of which can be found in the Supplementary Data. This work was supported by the Federal Ministry of Education and Research within the German Competence Network for Diabetes Mellitus (FKZ 01GI1106), which is integrated in the German Center for Diabetes Research (DZD) as of January 2015. The funders were not involved in data acquisition or analysis.
J Clin Hypertens (Greenwich). 2016;18:270–278. DOI: 10.1111/jch.12743. © 2015 Wiley Periodicals, Inc.
References
- 1. Arauz‐Pacheco C, Parrott MA, Raskin P. The treatment of hypertension in adult patients with diabetes. Diabetes Care. 2002;25:134–147. [DOI] [PubMed] [Google Scholar]
- 2. Mancia G, Fagard R, Narkiewicz K, et al. 2013 ESH/ESC guidelines for the management of arterial hypertension: the task force for the management of arterial hypertension of the European Society of Hypertension (ESH) and of the European Society of Cardiology (ESC). Eur Heart J. 2013;34:2159–2219. [DOI] [PubMed] [Google Scholar]
- 3. Brennan PJ, Greenberg G, Miall WE, Thompson SG. Seasonal variation in arterial blood pressure. Br Med J (Clin Res Ed). 1982;285:919–923. [DOI] [PMC free article] [PubMed] [Google Scholar]
- 4. Sega R, Cesana G, Bombelli M, et al. Seasonal variations in home and ambulatory blood pressure in the PAMELA population. J Hypertens. 1998;16:1585–1592. [DOI] [PubMed] [Google Scholar]
- 5. Polat M, Akil I, Yuksel H, et al. The effect of seasonal changes on blood pressure and urine specific gravity in children living in Mediterranean climate. Med Sci Monit. 2006;12:CR186–CR190. [PubMed] [Google Scholar]
- 6. Charach G, Rabinovich PD, Weintraub M. Seasonal changes in blood pressure and frequency of related complications in elderly Israeli patients with essential hypertension. Gerontology. 2004;50:315–321. [DOI] [PubMed] [Google Scholar]
- 7. Chen Q, Wang J, Tian J, et al. Association between ambient temperature and blood pressure and blood pressure regulators: 1831 hypertensive patients followed up for three years. PLoS ONE. 2013;8:e84522. [DOI] [PMC free article] [PubMed] [Google Scholar]
- 8. Modesti PA, Morabito M, Massetti L, et al. Seasonal blood pressure changes: an independent relationship with temperature and daylight hours. Hypertension. 2013;61:908–914. [DOI] [PubMed] [Google Scholar]
- 9. Jenner DA, English DR, Vandongen R, et al. Environmental temperature and blood pressure in 9‐year‐old Australian children. J Hypertens. 1987;5:683–686. [PubMed] [Google Scholar]
- 10. Miersch A, Vogel M, Gausche R, et al. Influence of seasonal variation on blood pressure measurements in children, adolescents and young adults. Pediatr Nephrol. 2013;28:2343–2349. [DOI] [PubMed] [Google Scholar]
- 11. Alpérovitch A, Lacombe JM, Hanon O, et al. Relationship between blood pressure and outdoor temperature in a large sample of elderly individuals: the three‐city study. Arch Intern Med. 2009;169:75–80. [DOI] [PubMed] [Google Scholar]
- 12. Kent ST, Howard G, Crosson WL, et al. The association of remotely‐sensed outdoor temperature with blood pressure levels in REGARDS: a cross‐sectional study of a large, national cohort of African‐American and white participants. Environ Health. 2011;10. [DOI] [PMC free article] [PubMed] [Google Scholar]
- 13. Lewington S, Li L, Sherliker P, et al. Seasonal variation in blood pressure and its relationship with outdoor temperature in 10 diverse regions of China: the China Kadoorie biobank. J Hypertens. 2012;30:1383–1391. [DOI] [PMC free article] [PubMed] [Google Scholar]
- 14. Wada Y, Hamamoto Y, Ikeda H, et al. Seasonal variations of urinary albumin creatinine ratio in Japanese subjects with type 2 diabetes and early nephropathy. Diabet Med. 2012;29:506–508. [DOI] [PubMed] [Google Scholar]
- 15. Liang WW. Seasonal changes in preprandial glucose, A1C, and blood pressure in diabetic patients. Diabetes Care. 2007;30:2501–2502. [DOI] [PubMed] [Google Scholar]
- 16. Gerstl EM, Rabl W, Rosenbauer J, et al. Metabolic control as reflected by HbA1c in children, adolescents and young adults with type‐1 diabetes mellitus: combined longitudinal analysis including 27,035 patients from 207 centers in Germany and Austria during the last decade. Eur J Pediatr. 2008;167:447–453. [DOI] [PubMed] [Google Scholar]
- 17. Grabert M, Schweiggert F, Holl RW. A framework for diabetes documentation and quality management in Germany: 10 years of experience with DPV. Comput Methods Programs Biomed. 2002;69:115–121. [DOI] [PubMed] [Google Scholar]
- 18. Dost A, Molz E, Krebs A, et al. Pulse pressure in children and adolescents with type 1 diabetes mellitus in Germany and Austria. Pediatric Diabetes. 2014;15:236–243. [DOI] [PubMed] [Google Scholar]
- 19. Neuhauser HK, Thamm M, Ellert U, et al. Blood pressure percentiles by age and height from nonoverweight children and adolescents in Germany. Pediatrics. 2011;127:e978–e988. [DOI] [PubMed] [Google Scholar]
- 20. Deutscher Wetterdienst (DWD) [German Weather Service] . http://www.dwd.de/bvbw/appmanager/bvbw/dwdwwwDesktop?_nfpb=true&_pageLabel=dwdwww_result_page&gsbSearchDocId=809418. Accessed May 26, 2015.
- 21. Robert Koch Institute , Study Group Influenza . Weekly report on influenza. https://influenza.rki.de/Wochenberichte.aspx. Accessed May 26, 2015.
- 22. Stolwijk AM, Straatman H, Zielhuis GA. Studying seasonality by using sine and cosine functions in regression analysis. J Epidemiol Community Health. 1999;53:235–238. [DOI] [PMC free article] [PubMed] [Google Scholar]
- 23. Mikulich SK, Zerbe GO, Jones RH, Crowley TJ. Comparing linear and nonlinear mixed model approaches to cosinor analysis. Stat Med. 2003;22:3195–3211. [DOI] [PubMed] [Google Scholar]
- 24. Oehlert GW. A note on the delta method. The American Statistician. 1992;46:27–29. [Google Scholar]
- 25. Madsen C, Nafstad P. Associations between environmental exposure and blood pressure among participants in the Oslo Health Study (HUBRO). Eur J Epidemiol. 2006;21:485–491. [DOI] [PubMed] [Google Scholar]
- 26. Fedecostante M, Barbatelli P, Guerra F, et al. Summer does not always mean lower: seasonality of 24 h, daytime, and night‐time blood pressure. J Hypertens. 2012;30:1392–1398. [DOI] [PubMed] [Google Scholar]
- 27. Ulmer H, Kelleher C, Diem G, et al. Estimation of seasonal variations in risk factor profiles and mortality from coronary heart disease. Wien Klin Wochenschr. 2004;116:662–668. [DOI] [PubMed] [Google Scholar]
- 28. Hozawa A, Kuriyama S, Shimazu T, et al. Seasonal variation in home blood pressure measurements and relation to outside temperature in Japan. Clin Exp Hypertens. 2011;33:153–158. [DOI] [PubMed] [Google Scholar]
- 29. Kimura T, Senda S, Masugata H, et al. Seasonal blood pressure variation and its relationship to environmental temperature in healthy elderly Japanese studied by home measurements. Clin Exp Hypertens. 2010;32:8–12. [DOI] [PubMed] [Google Scholar]
- 30. Iwabu A, Konishi K, Tokutake H, et al. Inverse correlation between seasonal changes in home blood pressure and atmospheric temperature in treated‐hypertensive patients. Clin Exp Hypertens. 2010;32:221–226. [DOI] [PubMed] [Google Scholar]
- 31. Al‐Tamer YY, Al‐Hayali JM, Al‐Ramadhan EA. Seasonality of hypertension. J Clin Hypertens (Greenwich). 2008;10:125–129. [DOI] [PMC free article] [PubMed] [Google Scholar]
- 32. Modesti PA, Parati G. Seasonal blood pressure changes: which ambient temperature should we consider? J Hypertens. 2014;32:1577–1579. [DOI] [PubMed] [Google Scholar]
- 33. Healy JD. Excess winter mortality in Europe: a cross country analysis identifying key risk factors. J Epidemiol Community Health. 2003;57:784–789. [DOI] [PMC free article] [PubMed] [Google Scholar]
- 34. Saeki K, Obayashi K, Iwamoto J, et al. Stronger association of indoor temperature than outdoor temperature with blood pressure in colder months. J Hypertens. 2014;32:1582–1589. [DOI] [PubMed] [Google Scholar]
- 35. Tamez H, Kalim S, Thadhani RI. Does vitamin D modulate blood pressure? Curr Opin Nephrol Hypertens. 2013;22:204–209. [DOI] [PMC free article] [PubMed] [Google Scholar]
- 36. Matthews CE, Freedson PS, Hebert JR, et al. Seasonal variation in household, occupational, and leisure time physical activity: longitudinal analyses from the seasonal variation of blood cholesterol study. Am J Epidemiol. 2001;153:172–183. [DOI] [PubMed] [Google Scholar]
- 37. Brook RD, Weder AB, Rajagopalan S. “Environmental hypertensionology.” The effects of environmental factors on blood pressure in clinical practice and research. J Clin Hypertens (Greenwich). 2011;13:836–842. [DOI] [PMC free article] [PubMed] [Google Scholar]
- 38. Choi JH, Xu QS, Park SY, et al. Seasonal variation of effect of air pollution on blood pressure. J Epidemiol Community Health. 2007;61:314–318. [DOI] [PMC free article] [PubMed] [Google Scholar]
- 39. Patel A, MacMahon S, Chalmers J, et al; ADVANCE Collaborative Group . Effects of a fixed combination of perindopril and indapamide on macrovascular and microvascular outcomes in patients with type 2 diabetes mellitus (the ADVANCE trial): a randomised controlled trial. Lancet. 2007;370:829–840. [DOI] [PubMed] [Google Scholar]
- 40. Handler J. Seasonal variability of blood pressure in California. J Clin Hypertens (Greenwich). 2011;13(11):856–860. [DOI] [PMC free article] [PubMed] [Google Scholar]
- 41. Handler J. The importance of accurate blood pressure measurement. Perm J. 2009;13(3):51–54. [DOI] [PMC free article] [PubMed] [Google Scholar]
- 42. McManus RJ, Mant J, Haque MS, et al. Effect of self‐monitoring and medication self‐titration on systolic blood pressure in hypertensive patients at high risk of cardiovascular disease: the TASMIN‐SR randomized clinical trial. JAMA. 2014;312:799–808. [DOI] [PubMed] [Google Scholar]
Associated Data
This section collects any data citations, data availability statements, or supplementary materials included in this article.
Supplementary Materials
Table S1. Patient characteristics stratified by year