

Abstract
This study aimed to determine the present status of prehypertension in rural China. It was conducted between January and August 2013, using a multistage clustering method to select a representative sample of individuals (≥35 years old), resulting in a study population of 11,576 adults. Prehypertension was defined as a systolic blood pressure (BP) in the range of 120 mm Hg to 139 mm Hg and/or a diastolic BP between 80 mm Hg and 89 mm Hg according to the Seventh Report of the Joint National Committee on the Prevention, Detection, Evaluation, and Treatment of High Blood Pressure (JNC 7). The results showed that the mean±standard deviation systolic and diastolic BP values for the entire population were 141.8±23.5 mm Hg and 82.1±11.8 mm Hg, respectively. Among the whole population, 35.1% of men and 32.5% of women were prehypertensive. Multiple logistic regression analysis showed that high body mass index, advanced age, alcohol consumption, diabetes, high triglyceride and low‐density lipoprotein cholesterol levels, and elevated diet score were risk factors for prehypertension. This study indicates that there is a high prevalence of prehypertension in rural China and confirms the importance of healthy lifestyles—including the control of obesity, diabetes, and dyslipidemia—to decrease the incidence of prehypertension.
Prospective cohort studies have established an independent positive association between blood pressure (BP) levels and risk of cardiovascular disease (CVD), stroke, and premature death.1 Based on these observations, the Seventh Report of the Joint National Committee on Prevention, Detection, Evaluation, and Treatment of High Blood Pressure (JNC 7) has proposed systolic BP (SBP) values of 120 mm Hg to 139 mm Hg or diastolic BP (DBP) values of 80 mm Hg to 89 mm Hg to be classified as “prehypertension.”2 Recent reports have confirmed the importance of defining prehypertension clinically to enable health professionals to prevent CVD.3 Furthermore, the sizable difference in CVD risk inherent in the SBP range of 120 mm Hg to 129 mm Hg and the DBP range of 80 mm Hg to 84 mm Hg has led some to suggest that this category should be subdivided into low and high prehypertension.4 More recently, the JNC 8 revisited the thresholds for treatment and antihypertensive intervention, resulting in a slight increase in the values of target BP,5 but not by any means altering the fundamental goal of hypertension prevention and treatment. A report from the Framingham cohort showed that a stepwise increase in hypertension incidence occurred across the 3 nonhypertensive BP categories: 5.3% of participants with optimum BP (<120/80 mm Hg), 17.6% with normal BP (130–139/85–89 mm Hg), and 37.3% with high‐normal BP progressed to hypertension (>140/90 mm Hg) over 4 years (age: <65 years). For patients aged 65 years and older in the same study, the corresponding 4‐year rates of progression were 16.0%, 25.5%, and 49.5%, respectively.6 So it is important to study the backup crowd of hypertension in order to reduce the high burden of hypertension in the future.
Approximately 30% to 50% of the worldwide population is prehypertensive.7, 8 Data from urban areas of northeastern China reported in 2012 showed that 40.5% of this adult population had prehypertension.9 However, few studies have examined the prevalence of prehypertension in rural adults. Sun and colleagues10 have reported that the prevalence of prehypertension was 47.0% in rural adults in northeastern China in 2005 (with values of 51.2% and 42.6% for men and women, respectively); since that time, no other studies have been reported on the state of prehypertension in this rural population. Therefore, we performed the present study in rural China in a large sample population from January to August 2013 with the goal of determining the most up‐to‐date status of BP and other risk factors of prehypertension in rural adults in China.
Methods
Study Population
Liaoning Province is located in northeastern China. From January 2012 to August 2013, a representative sample (patients aged ≥35 years) was selected to determine the prevalence of cardiovascular risk factors (including prehypertension, hypertension, obesity, and depression symptoms) in rural areas of Liaoning; the study was called the Northeast China Rural Cardiovascular Health Study (NCRCHS). The present report is a cross‐sectional observation of prehypertension in this population. The study adopted a multistage, stratified, and random cluster sampling design. In the first stage, 3 counties (Dawa, Zhangwu, and Liaoyang) were selected from the eastern, southern, and northern regions of Liaoning Province. In the second stage, one town was randomly selected from each county (total of 3 towns). In the third stage, 8 to 10 rural villages from each town were randomly selected. In total, 26 rural villages were included. All eligible permanent residents (aged ≥35 years) from each village were invited to participate in the study, comprising a potential pool of 14,016 people. Of these, 11,956 participants agreed and completed the present study, yielding a response rate of 85.3%. Participants who were pregnant, had a malignant tumor, or had mental disorders were excluded. The study was approved by the ethics committee of China Medical University (Shenyang, China). All procedures were performed in accordance with the ethical standards determined by this committee. Written consent was obtained from all participants after they had been informed of the objectives, benefits, medical items, and confidentiality agreement related to their personal information. If the participants were illiterate, we obtained written informed consent from their proxies.
Data Collection and Measurements
Patient history data were collected during a single clinic visit by cardiologists and trained nurses using a standard questionnaire in a face‐to‐face interview. Before the survey was performed, we invited all eligible investigators to attend the organized training. The training content included the purpose of the study, how to administer the questionnaire, the standard method of BP measurement, the importance of standardization, and the study procedures. A strict test was administered after this training, and only those who scored perfectly on the test could become investigators. These investigators also had access to further instructions and support once real data collection had begun.
Data on demographic characteristics, lifestyle risk factors, dietary habits, family income, family history of CVD, and medical history of hypertension were obtained by interview with a standardized questionnaire. There was a central steering committee with a subcommittee for quality control. Educational level was divided into primary school or below, middle school, and high school or above. Family income was classified as ≤5000, 5000–20,000, and >20,000 Chinese Yuan per year. Self‐reported sleep duration (including nocturnal and nap duration) was obtained, and the responses were categorized into 4 groups: ≤7 h/d, 7–8 h/d, 8–9 h/d, and >9 h/d.
According to American Heart Association protocol, BP was measured 3 times over 2‐minute intervals interspersed with at least 5 minutes of rest using a standardized automatic electronic sphygmomanometer (HEM‐907; Omron, Tokyo, Japan). The Omron device was calibrated using a standard mercury sphygmomanometer every month by two doctors according to British Hypertension Society protocol.11 The participants were advised to avoid caffeinated beverages and exercise for at least 30 minutes before the measurements. During the measurements, the participants were seated with the arm supported at the level of the heart. The mean of 3 BP measurements was calculated and used in all analyses.
Body mass index (BMI) was calculated as weight in kilograms divided by square of height in meters. Fasting blood samples were collected from all participants in the morning after at least 12 hours of fasting. Blood samples were obtained from the antecubital vein into vacutainer tubes containing EDTA. Serum was subsequently isolated from the whole blood, and all serum samples were frozen at −20°C for testing at a central certified laboratory. Fasting plasma glucose (FPG), total cholesterol (TC), low‐density lipoprotein cholesterol (LDL‐C), triglycerides (TGs), and other routine blood biochemical indices were analyzed enzymatically on an Olympus AU640 auto analyzer (Olympus, Kobe, Japan). All analytes were measured in an auto analyzer (Bayer RA‐XT, Tarrytown, NY) using kits by the same company.
The dietary pattern was assessed using recall of foods eaten in the previous year. The questionnaire included questions on the average consumption of several food items per week. The reported consumption was quantified approximately in terms of grams per week (vegetable consumption: rarely=3, <1000 g=2, 1000–2000 g=1, ≥2000 g=0; meat consumption including red meat, fish, and poultry: rarely=0, <250 g=1, 250–500 g=2, ≥500 g=3). The diet score was calculated for each participant as the vegetable consumption score plus the meat consumption score (range: 0–6). Higher values of the diet score indicate higher meat consumption, lower vegetable consumption, and thus greater adherence to a Westernized diet, whereas lower values indicate adherence to a Chinese diet. Similar methods for calculating the diet score were used in the ATTICA study.12
Definitions
Classification of normotensive, prehypertensive, and hypertensive in this study was based on BP values from JNC 7.2 Normal BP was defined as not being on antihypertensive medication and having an SBP <120 mm Hg and a DBP <80 mm Hg. Prehypertension was defined as not being on antihypertensive medication and having an SBP 120 mm Hg to 139 mm Hg or a DBP 80 mm Hg to 89 mm Hg. Hypertension was defined based on the JNC 7 cutoff point of 140 mm Hg and above for SBP and/or 90 mm Hg and above for DBP, regardless of whether the individual was taking antihypertensive medication.13
BMI values were categorized into 3 groups as normal (BMI <25 kg/m2), overweight (25 ≤BMI <30 kg/m2), and obese (BMI ≥30 kg/m2) according to World Health Organization (WHO) criteria.14 Abdominal obesity was defined as waist circumference (WC) ≥88 cm for women and WC ≥102 cm for men.15 Dyslipidemia was defined according to National Cholesterol Education Program‐Third Adult Treatment Panel (ATP III) criteria:16 high TC was ≥6.21 mM (240 mg/dL), high LDL‐C was ≥4.16 mM (160 mg/dL), and high TG was ≥2.26 mM (200 mg/dL). Diabetes mellitus was diagnosed according to WHO criteria:17 FPG ≥7 mM (126 mg/dL) and/or being on medical treatment for diabetes. Hyperuricemia was defined as a serum uric acid measurement of 6.0 mg/dL (360 mM) in women or 7.0 mg/dL (420 mM) in men.18
Statistical Analysis
Among the total of 11,956 individuals who completed all of the assessments, 380 were excluded because of missing data, resulting in 11,576 cases used in the data analysis. Continuous variables are reported as mean values with standard deviations; categorical variables are reported as numbers and percentages. Differences among weight categories were evaluated using Student t test or the chi‐square test as appropriate. Multivariate logistic regression analyses were used to identify the independent factors of prehypertension, with odds ratios (ORs) and corresponding 95% confidence intervals (CIs) calculated. The ORs and 95% CIs of prehypertension prevalence with participant characteristics was determined after adjustment for age, sex, ethnicity, education, physical activity, family income, current smoking status, current drinking status, family history of hypertension, BMI, WC, diet score, sleep duration, salt intake, TGs, TC, LDL‐C, FPG, and UA using multivariate logistic regression models. All statistical analyses were performed using SPSS version 19.0 software (SPSS Inc, IBM, Armonk, NY), and P values <.05 were considered to be statistically significant.
Results
BP Levels of Rural Adults in Northeastern China
The 11,576 participants included men (n=5359) and women (n=6217) aged 35 years or older (other characteristics are listed in Table SI). The mean SBP and DBP values of the whole population were 141.8±23.5 mm Hg (143.7±22.6 mm Hg in men and 140.2±24.0 mm Hg in women) and 82.1±11.8 (83.8±11.8 in men and 80.6±11.5 mm Hg in women), respectively. The SBP values were higher in men compared with women among all age groups (P<.05) except in those older than 65 years (P=.643); the DBP values were higher in men compared with women among all age groups (P<.001). The SBP values increased with age in both men and women (P<.001); the DBP values increased with age in both men and women younger than 65 years and decreased in those older than 65 years (P<.001; Table 1). Individuals with higher BMI had higher SBP (P<.05), and those with diabetes or dyslipidemia had higher SBP than those without (P<.05). Individuals with higher BMI also showed a trend towards higher DBP, although it was not significant; this was also the case for those with diabetes or dyslipidemia: these conditions showed a trend towards higher DBP, although the difference was not significant (Figures 1, 2, 3).
Table 1.
Blood Pressure Levels of the Rural Adult Population in Northeastern China
| Age, y | BP, mm Hg | Men (n=5359) | Women (n=6217) | P Value | Total |
|---|---|---|---|---|---|
| 35–44 | SBP | 134.3±17.2 | 127.7±17.3 | <.001 | 130.6±17.5 |
| DBP | 81.7±11.7 | 78.0±10.7 | <.001 | 79.6±11.3 | |
| 45–54 | SBP | 139.7±20.3 | 136.9±21.6 | <.001 | 138.2±21.0 |
| DBP | 84.3±11.8 | 80.9±11.2 | <.001 | 82.4±11.6 | |
| 55–64 | SBP | 148.8±23.7 | 147.1±24.4 | .04 | 147.9±24.1 |
| DBP | 85.7±11.8 | 82.5±11.7 | <.001 | 84.0±11.9 | |
| ≥65 | SBP | 154.3±24.3 | 154.9±25.9 | .643 | 154.6±25.1 |
| DBP | 82.2±11.4 | 80.2±12.2 | <.001 | 81.2±11.9 |
Abbreviations: DBP, diastolic blood pressure; SBP, systolic blood pressure. Values are presented as mean±standard deviation. P value was calculated by t test.
Figure 1.
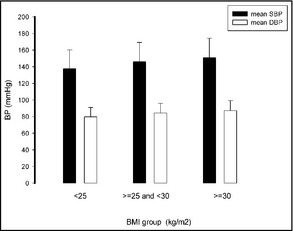
Individuals with a higher body mass index (BMI) had higher systolic blood pressure (SBP) (P<.05), whereas diastolic blood pressure (DBP) was unaffected by BMI. BP indicates blood pressure.
Figure 2.
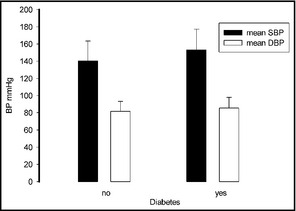
Patients with diabetes had higher systolic blood pressure (SBP) than those without, whereas diastolic blood pressure (DBP) was unaffected by this risk factor. BP indicates blood pressure.
Figure 3.
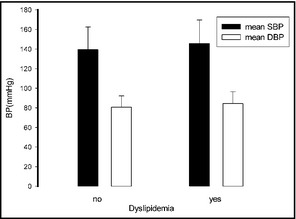
Patients with dyslipidemia had a higher systolic blood pressure (SBP) than those without, whereas diastolic blood pressure (DBP) was unaffected by this risk factor.
Distribution of BP Categories Among Rural Adults in Northeastern China
Estimates of the distribution of BP according to the classification system recommended by the JNC 7 are presented in Table 2. Among the whole population, only 11.1% of men and 18.9% of women were normotensive. In contrast, 35.1% of men and 32.5% of women were prehypertensive and the prevalence of grade 1, 2, and 3 hypertension was 20.7%, 8.7%, and 6.1%, respectively. Sex‐specific estimates indicated that 36.1% of men and 43.4% of women had prehypertension. The prevalence of low and high prehypertension was 20.7% and 6.1% in men and 18.5% and 8.1% in women, respectively. Age‐specific estimates showed that the prevalence of prehypertension decreases with age, whereas the prevalence of hypertension increases with age until 65 years.
Table 2.
Percentage Distribution of Blood Pressure Levels in the Rural Adult Population in Northeastern China
| Variables | No. | Normotensive No. (%) | Prehypertension No. (%) | Hypertension, No. (%) | ||
|---|---|---|---|---|---|---|
| Grade 1 | Grade 2 | Grade 3 | ||||
| Men, age, y | ||||||
| 35–44 | 1218 | 206 (16.9) | 594 (48.8) | 329 (27.0) | 58 (4.8) | 31 (2.5) |
| 45–54 | 1621 | 210 (13.0) | 649 (40.0) | 550 (33.9) | 128 (7.9) | 84 (5.2) |
| 55–64 | 1636 | 127 (7.8) | 456 (27.9) | 637 (38.9) | 221 (13.5) | 195 (11.9) |
| ≥65 | 884 | 44 (5.0) | 182 (20.6) | 344 (38.9) | 180 (20.4) | 134 (15.2) |
| Total | 5359 | 567 (11.1) | 1881 (35.1) | 1860 (34.7) | 587 (11.0) | 444 (8.3) |
| Women, age, y | ||||||
| 35–44 | 1533 | 529 (34.5) | 654 (42.7) | 275 (17.9) | 46 (3.0) | 29 (1.9) |
| 45–54 | 1977 | 402 (20.3) | 707 (35.8) | 604 (30.6) | 171 (8.6) | 93 (4.7) |
| 55–64 | 1848 | 186 (10.1) | 500 (27.1) | 678 (36.7) | 289 (20.8) | 195 (17.7) |
| ≥65 | 859 | 56 (6.5) | 157 (18.3) | 315 (36.7) | 179 (20.8) | 152 (17.7) |
| Total | 6217 | 1173 (18.9) | 2018 (32.5) | 1872 (30.1) | 685 (11.0) | 469 (7.5) |
Multiple Regression Analyses of Prehypertension and Associated Lifestyle Factors
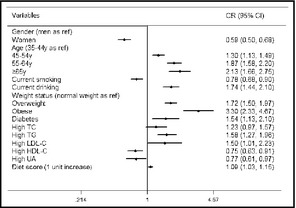
After multiple logistic regression analyses, obesity and age older than 65 years were the most powerful predictors of prehypertension, with ORs of 3.3 (95% CI, 2.331–4.67; P<.001) and 2.134 (95% CI, 1.657–2.748; P<.001), respectively, followed by age between 64 and 55 years (OR, 1.867; 95% CI, 1.582–2.203; P<.001). Individuals who self‐reported alcohol consumption had a 1.740‐fold greater risk of developing prehypertension (95% CI, 1.443–2.098), and diabetic individuals had a 1.539‐fold greater risk of developing prehypertension than nondiabetic members of the cohort (OR, 1.539; 95% CI, 1.131–2.095). Moreover, dyslipidemia (with the exception of high TC (OR, 1.234; 95% CI, 0.972–1.956; P<.084) increased the likelihood of prehypertension (high LDL‐C: OR, 1.501; 95% CI, 1.012–2.227; P=.043; high TG: OR, 1.579; 95% CI, 1.274–1.956; P<.001). The diet score was also shown to predict prehypertension (OR, 1.086; 95% CI, 1.029–1.146; P=.003). Furthermore, being female (OR, 0.585; 95% CI, 0.503–0.681; P<.001), having high HDL‐C (OR, 0.754; 95% CI, 0.627–0.906; P=.003), having high UA (OR, 0.769; 95% CI, 0.609–0.972, P=.028), or smoking (OR, 0.782; 95% CI, 0.677–0.904; P=.001) had no correlation with prehypertension (Table 3).
Table 3.
Multiple regression analyses of prehypertension and associated factors in forest plot
Discussion
To understand the most up‐to‐date prevalence of prehypertension in rural China, we gathered health information from adults 35 years and older in rural northeastern China.
We found that the BP level of the population in this study was significantly elevated to 141.8±23.5 mm Hg for SBP and 82.1±11.8 mm Hg for DBP. The SBP (143.7±22.6 mm Hg) in men was higher than that (140.2±24.0 mm Hg) in women. These SBP values were greater than those reported in 2007 by Dong and colleagues9 from rural areas of northeastern China, which were 135.0±20.0 mm Hg and 134.8±24.0 mm Hg in men and women, respectively.19 Furthermore, not only SBP but also DBP was much higher in the present study as compared with the rural part of the Prospective Urban Rural Epidemiology (PURE) study.20 Because of the well‐established relationship between elevated BP and increased risk of cardiovascular and cerebrovascular diseases,21 our results suggest that the burden of these diseases will increase in severity in the near future in this rural population.
Among the sampled population, <20% of the people had normal BP, while 33.7% (35.1% of men and 32.5% of women) were prehypertensive. In comparison with previous studies in northeastern China, our observation indicates a lower prevalence of prehypertension: a report from 2005 measured the levels of prehypertension to be 51.2% for men and 42.6 for women.10 Our data also indicate a lower level of prehypertension compared with the latest Control Hypertension and Other Risk Factors to Prevent Stroke With Nutrition Education in Urban Area of Northeast China (CHPSNE) study, which reported that 40.5% of urban Chinese had prehypertension.9 The results of the present study showed that SBP increased with age, while the prevalence of prehypertension decreased with age. We speculate that the SBP increased with age because of the increased incidence of hypertension. Based on previous literature reports, one explanation for why DBP exhibited different characteristics from SBP in our study may be that blood vessel elasticity changes with age.22
The present study reports a prevalence of prehypertension comparable to 2013 data from the United States (36%)23 but higher than data reported from India (18.8%) and Taiwan (30.2%).24, 25 It is well known that if prehypertension remains undetected, it has a high likelihood to lead to hypertension; even prehypertension in the low range elevates the risk of other forms of CVD.26, 27 Hence, there is an urgent need to determine the reasons for the occurrence of prehypertension and to implement effective control methods.
Analysis of the factors affecting BP levels indicated that individuals with a higher BMI had higher SBP (P<.05) and that patients with diabetes or dyslipidemia had higher SBP (P<.05; Figures 1, 2, 3). Furthermore, our multiple logistic regression analysis indicated that those with diabetes had a 1.539‐fold greater risk of developing prehypertension, those with obesity had a 3.3‐fold greater risk of developing prehypertension, and dyslipidemia was the most powerful predictor of prehypertension. These results confirm that prehypertension coexists with other risk factors of CVD, consistent with other studies in the field. For example, the second National Health and Nutrition Examination Survey (NHANES II) data from the United States reported that 90% of individuals with prehypertension had at least one other cardiovascular risk factor.28 In addition, the Women's Health Initiative study showed that the prevalence of diabetes mellitus and hypercholesterolemia increased concordantly with BP,29 and prospective studies have confirmed that reducing BMI and lipid levels can decrease prehypertension.30, 31, 32 Therefore, the control of obesity, diabetes, and dyslipidemia are important prehypertension prevention strategies.
Our results demonstrate that alcohol consumption and diet score were significantly associated with prehypertension by multiple logistic regression analysis. These results are consistent with other studies33, 34 and confirm the importance of healthy lifestyles. Unexpectedly, our results showed that smoking was not correlated with high BP (OR, 0.782; 95% CI, 0.677–0.904), in contrast with previous studies.35, 36 We reason that this discrepancy may be the result of smoking cessation intervention in this population, but additional studies are needed to test this hypothesis. High uric acid was also shown to be a protective factor (OR, 0.769; 95% CI, 0.609–0.972), in contrast with previous work.37, 38
Study Limitations
The present study has several limitations. First, the study was a cross‐sectional observation and may not provide sufficient evidence of causality. Furthermore, the data are not necessarily representative of rural populations in other locations within China. In addition, the determination of high BP in the present study was based on readings from a single day, which may result in an overestimate or underestimate of the prevalence of prehypertension.
Conclusions
Our findings indicate that within the rural Chinese popu‐lation, obesity, diabetes, and dyslipidemia (but not salt intake) were the main risk factors for prehypertension. We speculate that this observation may be caused by urbanization of rural areas, including improved economy, higher caloric intake, less extreme manual labor, and increased poor living habits in the absence of education on good health habits. Our current understanding of CVD pathogenesis, supported by the novel findings in the present study, indicate that if prehypertension is not effectively controlled, cardiovascular events precipitated by hypertension will be a major increased burden on this rural population.
Disclosures
The authors declare no conflict of interest.
Supporting information
Table SI. Baseline Characteristics of Prehypertensive and Normotensive Study Patients.
Acknowledgments
This study was supported by grants from the “Twelfth Five‐Year” project funds (National Science and Technology Support Program of China, grant #2012BAJ18B02). Professor Yingxian Sun was responsible for the project completion.
J Clin Hypertens (Greenwich). 2014;16:664–670. © 2014 Wiley Periodicals, Inc.
References
- 1. Lewington S, Clarke R, Qizilbash N, et al. Prospective studies collaboration . Age‐specific relevance of usual blood pressure to vascular mortality: a meta‐analysis of individual data for one million adults in 61 prospective studies. Lancet. 2002;360:1903–1913. [DOI] [PubMed] [Google Scholar]
- 2. Chobanian AV, Bakris GL, Black HR, et al. National Heart, Lung, and Blood Institute Joint National Committee on Prevention, Detection, Evaluation, and Treatment of High Blood Pressure ; National High Blood Pressure Education Program Coordinating Committee . The seventh report of the Joint National Committee on Prevention, Detection, Evaluation, and Treatment of High Blood Pressure: the JNC 7 report. JAMA. 2003;289:2560–2572. Erratum in: JAMA 2003; 290:197. [DOI] [PubMed] [Google Scholar]
- 3. Takashima N, Ohkubo T, Miura K, et al. NIPPON DATA80 Research Group . Long‐term risk of BP values above normal for cardiovascular mortality: a 24‐year observation of Japanese aged 30 to 92 years. J Hypertens. 2012;30:2299–2306. [DOI] [PubMed] [Google Scholar]
- 4. Shen L, Ma H, Xiang MX, Wang JA. Meta‐analysis of cohort studies of baseline prehypertension and risk of coronary heart disease. Am J Cardiol. 2013;112:266–271. [DOI] [PubMed] [Google Scholar]
- 5. James PA, Oparil S, Carter BL, et al. 2014 evidence‐based guideline for the management of high blood pressure in adults: report from the panel members appointed to the Eighth Joint National Committee (JNC8). JAMA. 2014;311:507–520. Erratum in: JAMA. 2014;311(17):1809. [DOI] [PubMed] [Google Scholar]
- 6. Vasan RS, Larson MG, Leip EP, et al. Assessment of frequency of progression to hypertension in non‐hypertensive participants in the Framingham Heart Study: a cohort study. Lancet. 2001;358:1682–1686. [DOI] [PubMed] [Google Scholar]
- 7. Elliott WJ, Black HR. Pre‐hypertension. Nat Clin Pract Cardiovasc Med. 2007;4:538–548. [DOI] [PubMed] [Google Scholar]
- 8. Guo X, Zheng L, Zhang X, et al. The prevalence and heterogeneity of prehypertension: a meta‐analysis and meta‐regression of published literature worldwide. Cardiovasc J Afr. 2012;23:44–50. [DOI] [PMC free article] [PubMed] [Google Scholar]
- 9. Meng XJ, Dong GH, Wang D, et al. Epidemiology of prehypertension and associated risk factors in urban adults from 33 communities in China–the CHPSNE study. Circ J. 2012;76:900–906. [DOI] [PubMed] [Google Scholar]
- 10. Sun Z, Zheng L, Wei Y, et al. Prevalence and risk factors of the rural adult people prehypertension status in Liaoning Province of China. Circ J. 2007;71:550–553. [DOI] [PubMed] [Google Scholar]
- 11. O'Brien E, Petrie J, Littler W, et al. The British Hypertension Society protocol for the evaluation of automated and semi‐automated blood pressure measuring devices with special reference to ambulatory systems. J Hypertens. 1990;8:607–619. [DOI] [PubMed] [Google Scholar]
- 12. Panagiotakos DB, Pitsavos C, Chrysohoou C, et al. Epidemiology of overweight and obesity in a Greek adult population: the ATTICA Study. Obes Res. 2004;12:1914–1920. [DOI] [PubMed] [Google Scholar]
- 13. Egan BM, Li J, Qanungo S, Wolfman TE. Blood pressure and cholesterol control in hypertensive hypercholesterolemic patients: national health and nutrition examination surveys 1988–2010. Circulation. 2013;128:29–41. [DOI] [PMC free article] [PubMed] [Google Scholar]
- 14. World Health Organization . Hypertension control: report of a WHO Expert Committee. World Health Organ Tech Rep Ser. 1996;862:1–83. [PubMed] [Google Scholar]
- 15. WHO/FAO . Expert Consultation on Diet, Nutrition and the Prevention of Chronic Diseases, Report of the Joint WHO/FAO Expert Consultation. Geneva: World Health Organization; 2003. [Google Scholar]
- 16. Expert Panel on Detection, Evaluation, and Treatment of High Blood Cholesterol in Adults . Executive Summary of the Third Report of the National Cholesterol Education Program (NCEP) Expert Panel on Detection, Evaluation, and Treatment of High Blood Cholesterol in Adults (Adult Treatment Panel III). JAMA. 2001;285:2486–2497. [DOI] [PubMed] [Google Scholar]
- 17. World Health Organization and International Diabetes Fedaration . Definition and Diagnosis of Diabetes Mellitus and Intermediate Hyperglycemia: Report of a WHO/IDF Consultation. Geneva, Switzerland: WHO; 2006:1–3. [Google Scholar]
- 18. Iseki K, Iseki C, Kinjo K. Changes in serum uric acid have a reciprocal effect on eGFR change: a 10‐year follow‐up study of community‐based screening in Okinawa, Japan. Hypertens Res. 2013;36:650–654. [DOI] [PubMed] [Google Scholar]
- 19. Dong G, Sun Z, Zheng L, et al. Prevalence, awareness, treatment, and control of hypertension in rural adults from Liaoning Province, northeast China. Hypertens Res. 2007;30:951–958. [DOI] [PubMed] [Google Scholar]
- 20. Chow CK, Teo KK, Rangarajan S, et al. PURE (Prospective Urban Rural Epidemiology) Study investigators . Prevalence, awareness, treatment, and control of hypertension in rural and urban communities in high‐, middle‐, and low‐income countries. JAMA. 2013;310:959–968. [DOI] [PubMed] [Google Scholar]
- 21. Borghi C, Dormi A, L'Italien G, et al. The relationship between systolic blood pressure and cardiovascular risk–results of the Brisighella Heart Study. J Clin Hypertens (Greenwich). 2003;5:47–52. [DOI] [PMC free article] [PubMed] [Google Scholar]
- 22. Pahkala K, Laitinen TT, Heinonen OJ, et al. Association of fitness with vascular intima‐media thickness and elasticity in adolescence. Pediatrics. 2013;132:e77–e84. [DOI] [PubMed] [Google Scholar]
- 23. Joffres M, Falaschetti E, Gillespie C, et al. Hypertension prevalence, awareness, treatment and control in national surveys from England, the USA and Canada, and correlation with stroke and ischaemic heart disease mortality: a cross‐sectional study. J Assoc Physicians India. 2012;60:26–29. [DOI] [PMC free article] [PubMed] [Google Scholar]
- 24. Kokiwar PR, Gupta SS, Durge PM. Prevalence of hypertension in a rural community of central India. BMJ Open. 2013;3:e003423. [PubMed] [Google Scholar]
- 25. Lin SJ, Lee KT, Lin KC, et al. Prevalence of prehypertension and associated risk factors in a rural Taiwanese adult population. Int J Cardiol. 2010;144:269–273. [DOI] [PubMed] [Google Scholar]
- 26. Glasser SP, Khodneva Y, Lackland DT, et al. Prehypertension and incident acute coronary heart disease in the Reasons for Geographic and Racial Differences in Stroke (REGARDS) Study. Am J Hypertens. 2014;27:245–251. [DOI] [PMC free article] [PubMed] [Google Scholar]
- 27. Arima H, Murakami Y, Lam TH, et al. Asia Pacific Cohort Studies Collaboration . Effects of prehypertension and hypertension subtype on cardiovascular disease in the Asia‐Pacific region. Hypertension. 2012;59:1118–1123. [DOI] [PubMed] [Google Scholar]
- 28. Qureshi AI, Suri MF, Kirmani JF, Divani AA. Prevalence and trends of prehypertension and hypertension in United States: National Health and Nutrition Examination Surveys 1976 to 2000. Med Sci Monit. 2005;11:CR403–CR409. [PubMed] [Google Scholar]
- 29. Johnson KC, Margolis KL, Espeland MA, et al. Women's Health Initiative Memory Study and Women's Health Initiative Investigators . A prospective study of the effect of hypertension and baseline blood pressure on cognitive decline and dementia in postmenopausal women: the Women's Health Initiative Memory Study. J Am Geriatr Soc. 2008;56:1449–1458. [DOI] [PubMed] [Google Scholar]
- 30. Gittelsohn J, Kim EM, He S, Pardilla M. A food store‐based environmental intervention is associated with reduced BMI and improved psychosocial factors and food‐related behaviors on the Navajo nation. J Nutr. 2013;143:1494–1500. [DOI] [PMC free article] [PubMed] [Google Scholar]
- 31. Kivimäki M, Shipley MJ, Ferrie JE, et al. Best‐practice interventions to reduce socioeconomic inequalities of coronary heart disease mortality in UK: a prospective occupational cohort study. Lancet. 2008;372:1648–1654. [DOI] [PubMed] [Google Scholar]
- 32. Prandin MG, Cicero AF, Dormi A, et al. Prospective evaluation of the effect of statins on blood pressure control in hypertensive patients in clinical practice. Nutr Metab Cardiovasc Dis. 2010;7:512–518. [DOI] [PubMed] [Google Scholar]
- 33. Fan AZ, Li Y, Elam‐Evans LD, Balluz L. Drinking pattern and blood pressure among non‐hypertensive current drinkers: findings from 1999–2004 National Health and Nutrition Examination Survey. Clin Epidemiol. 2013;5:21–27. [DOI] [PMC free article] [PubMed] [Google Scholar]
- 34. Shimomura T, Wakabayashi I. Associations of cardiovascular risk factors with prehypertension and hypertension in women. Blood Press. 2012;21:345–351. [DOI] [PubMed] [Google Scholar]
- 35. Gupta R, Deedwania PC, Achari V, et al. Normotension, prehypertension, and hypertension in urban middle‐class subjects in India: prevalence, awareness, treatment, and control. Am J Hypertens. 2013;26:83–94. [DOI] [PubMed] [Google Scholar]
- 36. Yadav S, Boddula R, Genitta G, et al. Prevalence and risk factors of pre‐hypertension & hypertension in an affluent North Indian population. Indian J Med Res. 2008;128:712–720. [PubMed] [Google Scholar]
- 37. Song K, Wang Y, Wang G, et al. Does decreasing serum uric acid level prevent hypertension? – a nested RCT in cohort study: rationale, methods, and baseline characteristics of study cohort BMC Public Health. 2013;13:1069. [DOI] [PMC free article] [PubMed] [Google Scholar]
- 38. Kawamoto R, Tabara Y, Kohara K, et al. Interaction between serum uric acid and triglycerides in relation to prehypertension in community‐dwelling Japanese adults. Clin Exp Hypertens. 2014;36:64–69. [DOI] [PubMed] [Google Scholar]
Associated Data
This section collects any data citations, data availability statements, or supplementary materials included in this article.
Supplementary Materials
Table SI. Baseline Characteristics of Prehypertensive and Normotensive Study Patients.