

Abstract
Increased abdominal obesity is associated with increased cardiovascular risk, especially in African American women. The adipocyte is documented to produce a number of inflammatory factors including the hormone aldosterone. There are very few data documenting aldosterone production from adipocytes of postmenopausal women as well as data demonstrating the effects of angiotensin receptor blockade (ARB) on its production in predominately African American women. The authors hypothesize that increased central adipocyte mass in obese postmenopausal women contributes to increased production of aldosterone that is suppressed with the ARB azilsartan medoxomil. The authors tested this hypothesis in a double‐blind, placebo‐controlled pilot study of 34 hypertensive postmenopausal women (mean age 57.5±7.5 years), 91% of whom were African American. Patients had a mean 24‐hour ambulatory systolic blood pressure of 127±13 mm Hg off any blocker of the renin‐angiotensin system but while taking other antihypertensive medications. The authors further validated aldosterone production in a nested cohort of women using fat cells from a fat pad biopsy. Azilsartan reduced 24‐hour urinary aldosterone by 47.3% from baseline (P=.03), with between‐groups differences in urine aldosterone of −5.3±52.3% placebo vs −47.3±32.9% azilsartan (P=.07) at 6 months. An adrenal cell line treated with adipocyte‐conditioned media from subcutaneous abdominal adipocytes of postmenopausal women (n=3) showed an increase in aldosterone production blocked by an ARB (1948±1297 pg/mL fat alone vs 894±438 pg/mL fat + ARB; P=.022). The authors conclude that aldosterone is produced from subcutaneous adipocytes of obese postmenopausal women. Moreover, use of an ARB significantly reduces aldosterone production within 6 months of use in these women as well as in cells exposed to their adipocytes.
Cardiovascular (CV) disease during the postmenopausal period is the leading cause of death in women worldwide.1, 2, 3 The loss of estrogen during menopause was thought to play a role in contributing to CV risk; however, results from the Women's Health Initiative and other trials yield conflicting results regarding outcomes.4, 5 Thus, the fundamental reasons for increased CV risk in postmenopausal women remain unclear.
A major risk factor contributing to CV disease risk is central abdominal obesity. A direct relationship between magnitude of central obesity and CV risk in the general population is clear.4, 6 Increases in abdominal obesity in women as they transition through menopause are evident in several studies.7, 8 This increase in CV risk is more pronounced in African American women.9, 10, 11 Since the adipocyte is now appreciated as a “metabolically active cell” producing adipokines that stimulate hormonal changes, the increase in CV event rates may lie with how the adipocyte functions in the postmenopausal period.12, 13
One recent advance in our understanding of how abdominal obesity and hypertension are linked is the observation that aldosterone levels are correlated with the magnitude of central adiposity.14, 15 Elevated levels of aldosterone are present in obese patients with resistant hypertension, and weight loss improves hypertension and lowers aldosterone levels.16, 17 However, these studies examined the relationship between obesity and aldosterone levels in obese patients following bypass surgery and predominantly in Caucasian women. No studies to date have examined the relationship of central adipose aldosterone in African American postmenopausal women.
Adipose tissue is a highly active metabolic organ that produces a myriad of adipokines and inflammatory substances.18 In vitro studies of human adrenocortical cells incubated with media conditioned with human subcutaneous adipocytes obtained from female breast tissue led to increases in mineralocorticoid secretion.19 Specifically, an increase in aldosterone and an increase in the expression of steroid acute regulatory peptide mRNA was seen, indicating that adipocytes secrete some factor to stimulate this effect.15 There are no studies, however, that examine the effect of renin‐angiotensin system (RAS) blockers on aldosterone production in postmenopausal women.
We conducted a double‐blind, placebo‐controlled study to test the hypothesis that increased central adipocyte mass in obese postmenopausal women contributes to increased adipocyte production of aldosterone. We further tested whether aldosterone production would be suppressed by use of the ARB, azilsartan medoxomil, an agent shown in head‐to‐head ABPM studies to be the most potent for reducing blood pressure among other ARBs.20, 21
Methods
Obese postmenopausal women between the ages of 45 and 75 years with stage 1 hypertension were recruited. Inclusion criteria were a body mass index >25 kg/m2 and absence of a menstrual period for 1 year or more. Stage 1 hypertension was defined as an office systolic blood pressure (BP) of 140 to 159 mm Hg or a diastolic BP of 90 to 99 mm Hg. Patients taking RAS blockers, such as angiotensin‐converting enzyme inhibitors, ARBs, mineralocorticoid receptor blockers such as spironolactone or eplerenone, or direct renin inhibitors had medications stopped for a month.
Patients were excluded if they had stage 2 hypertension, stage 1 hypertension requiring more than one antihypertensive agent, stage 3 or higher chronic kidney disease (ie, estimated glomerular filtration rate <60 mL/min/1.73 m2), diabetes mellitus, primary hyperaldosteronism, or other chronic illnesses such as heart failure or chronic liver disease.
Patient screening included baseline CV risk assessment including a fasting lipid panel. In addition, serum follicle‐stimulating hormone and luteinizing hormone levels, office orthostatic BP, heart rate measurements, and 24‐hour ABPM to confirm stage 1 hypertension were performed.
Patients underwent dual‐energy x‐ray absorptiometry (DEXA) to assess total body fat distribution. Ley and colleagues8 used DEXA scans to measure central vs peripheral fat mass. DEXA measurements are reproducible, safe, simple, rapid, and provide measures of fat mass in absolute terms.8
All participants were offered the possibility of having a subcutaneous abdominal fat pad biopsy to assess aldosterone production in cell culture. All patients were randomized to 80 mg azilsartan medoxomil daily or placebo and followed for 6 months. Study patients and investigators were blinded to which participants received azilsartan or placebo. Randomization was performed using telephone center numbers coordinated with pills to dispense. Office BP, plasma renin activity, and 24‐hour urine aldosterone levels along with total urine creatinine levels were measured after 1, 3, and 6 months in both groups. All patients had serum potassium levels checked at each visit, and adequate urine collection for aldosterone was assessed by measurement of 24‐hour total creatinine.
If participants became symptomatic or hypotensive during the 6‐month study protocol, the medication dose was reduced to 40 mg/d. If a patient's office BP was >150/95 mm Hg while taking the study protocol, 5 mg of amlodipine daily or 0.1 mg of oral clonidine twice daily was added to the patient's medication regimen.
Subcutaneous Abdominal Fat Pad Biopsies
An optional fat pad biopsy was performed at baseline in women who consented to the procedure. The goal was to get a nested cohort of three baseline patients to participate in the fat pad biopsy procedure. The abdominal area adjacent to the umbilicus was prepped with betadine solution and allowed to air dry. A lidocaine field block was then performed using 1% plain lidocaine. The area was allowed to become anesthetized after the field block, during which time it was covered with a sterile 4 × 4 gauze. An incision approximately 0.5 cm long was made parallel to the patients' waistline in the central portion of the field‐blocked area, through the dermis, and into the subcutaneous adipose tissue. Prefilled 60 cc syringes containing 10 cc normal saline were used to aspirate the adipose tissue with a 13‐gauge 3‐inch hypodermic needle. Gentle aspiration using a back/forth motion was used to aspirate the adipose tissue. Up to six syringes were used per abdominal site for aspiration through a single needle to obtain a total of approximately 5 g of fat tissue.
Adipocyte‐Conditioned Media
The biopsy sample was prepared and plated under sterile conditions in a tissue culture hood. Following removal of adipose tissue from the patients, it was immediately transferred to the laboratory, weighed, and placed individually into microcentrifuge tubes containing 700 μL phenol red–free Dulbecco's modified Eagle's medium (DMEM) high media.
The adipose tissue was coarsely minced, washed in serum‐free media, centrifuged for 2 minutes at 1000 rpm, then transferred to culture plates containing the DMEM high media at a volume of 5 mL/g fat. The tissues were cultured for 24 hours. The tissue explants were then removed. The media was filtered through a sterile 0.22 μm syringe filter into 1 mL aliquots and stored at −80°C. In parallel, the control media was treated as above, except that no adipose tissue was added.
Treatment of Adrenocortical Cell Line With Adipocyte‐Conditioned Media
The adrenocortical cell line NCI‐H295R was cultured as previously described by Krug and colleagues.19 The adipocyte‐conditioned media and control media were added to replicate wells of the NCI‐H295R cells. After 0 (baseline), 6, 12, 24, and 48 hours of treatment with the adipocyte‐conditioned media, an aliquot of the media was removed and frozen at −200°C. The level of aldosterone in the incubation media was measured by enzyme immunoassay.
Quantification of Aldosterone
Aldosterone concentrations of the adipocyte‐conditioned media and control media were determined using enzyme‐linked immunosorbent assay kits from Cayman Chemical (cat# 501090, 500655; Ann Arbor, MI). Standard curve data were log transformed and plotted as (B/B0) vs the log concentrations and then a linear regression fit was applied to the data points. Steroid concentration of the experimental data points was then determined from the equation obtained from the standard curve. Cayman's aldosterone enzyme‐linked immunosorbent assay kit is a competitive assay that can be used for quantification of aldosterone in urine, plasma, and other sample matrices. The enzyme immunoassay typically displays an IC50 (50% B/B0) of approximately 180 pg/mL and a detection limit (80% B/B0) of approximately 35 pg/mL.
Clinical Endpoints
The primary endpoint was the delta/delta at 6 months between groups in 24‐hour urinary aldosterone level among postmenopausal women treated with azilsartan vs placebo. Secondary endpoints included the difference in plasma renin: aldosterone and office and 24‐hour BP (systolic and diastolic) measurements at 6 months.
The trial was registered on clinicaltrials.gov with the identifier NCT01774591.
Statistical Analysis
Power calculations were based on previous studies showing urine aldosterone levels of obese postmenopausal hypertensive women to range between 22 and 30 pg/mL. The primary endpoint was the comparison of delta changes from baseline between groups or the delta‐delta at 6 months. We assumed a 20% greater delta change in the azilsartan group at the end of 6 months compared with placebo. Given a standard deviation of 10% for the assay, difference in means of 10, we calculated that 30 patients would provide 80% power to detect a 20% difference between groups.
For descriptive statistics, mean with standard deviation or median with interquartile range were used for continuous variables while frequency and percentages were summarized for categorical variables, as appropriate. Baseline differences between the placebo and azilsartan groups were analyzed by Mann‐Whitney test for continuous variables and by chi‐square or Fisher exact statistics for categorical variables. The Mann‐Whitney test was used to assess for differences in urine aldosterone, systolic BP, and diastolic BP between groups at each time point, respectively. The Wilcoxon signed‐rank test was used to evaluate within‐group differences in urine aldosterone, systolic BP, and diastolic BP between each time point and baseline. All statistical tests were performed using STATA/SE software version 13 (StataCorp LP, College Station, TX) and a two‐tailed P value <.05 was considered statistically significant.
Results
The study screened 68 eligible women (91% African American) and randomized 34 who met eligibility criteria (Figure 1. A total of 21 obese African American women with stage 1 hypertension completed the study. Baseline characteristics of the cohort studied are summarized in Table 1. There were no differences between groups except for triglycerides, which were higher in the placebo group. There was no difference in the android/gynoid fat distributions on DEXA scan within the postmenopausal group (54.8% [48.2–63.4] android and 49.9 [48.7–54.3] gynoid), and the difference between ratios were not significant (P=.27) (Table 1. Postmenopausal women had baseline BP controlled as assessed with 24‐hour ambulatory systolic BP not taking any blocker of the renin‐angiotensin system but taking other BP‐lowering meds (Table 1. They also had similar 24‐hour urine aldosterone values (6.7 [5.6–12] µg/d azilsartan vs 7.3 [4.6–10] µg/d placebo; P=.75). Women were randomized to either placebo (N=11) or azilsartan (N=10).
Figure 1.
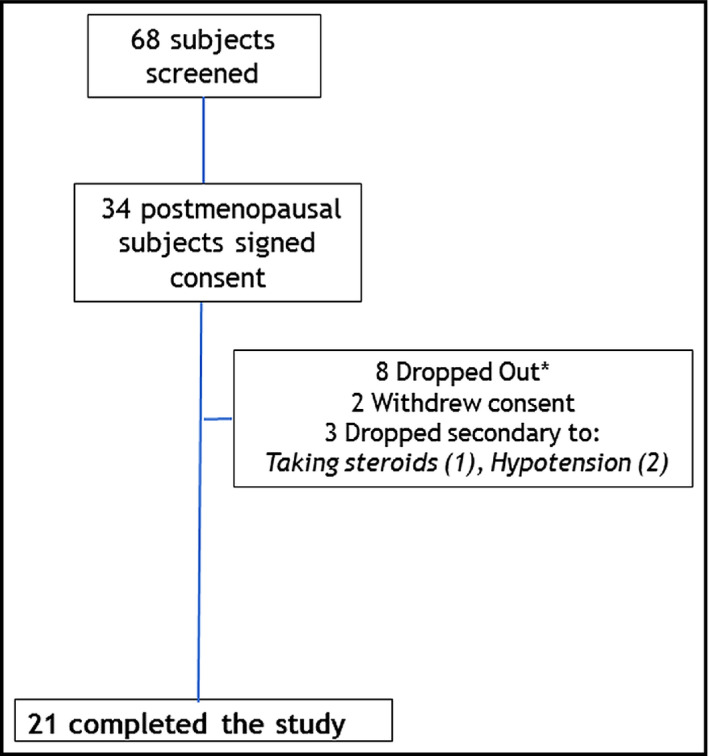
Consort chart of patient recruitment. *All dropouts occurred between baseline and first return visit and were not included in the analysis.
Table 1.
Baseline Demographic Characteristics of Postmenopausal Women
| Postmenopausal Women (N=21) | |
|---|---|
| Age, median (IQR), y | 57.0 (54–62) |
| African American race, No. (%) | 19 (90.5) |
| BMI, median (IQR), kg/m2 | 30.6 (28.8–33.1) |
| Waist‐to‐hip ratio, median (IQR) | 0.90 (0.86–0.94) |
| SBP, median (IQR), mm Hg | 135 (128–140) |
| DBP, median (IQR), mm Hg | 85 (83–95) |
| ABPM nocturnal SBP, median (IQR), mm Hg | 122 (112–136) |
| ABPM nocturnal DBP, median (IQR), mm Hg | 70 (65–74) |
| Heart rate, median (IQR), beats per min | 72 (61–80) |
| eGFR, median (IQR), mL/min/1.73 m2 | 76 (65–88) |
| Total cholesterol, median (IQR), mg/dL | 193 (148–231) |
| HDL cholesterol, median (IQR), mg/dL | 52 (44–65) |
| LDL cholesterol, median (IQR), mg/dL | 121 (100–146) |
| Triglycerides, median (IQR), mg/dL | 131 (94–178) |
| Urine aldosterone, median (IQR), µg/24 h | 7.1 (5.6–10.0) |
| Plasma renin, median (IQR), ng/mL/h | 1.1 (0.6–1.3) |
| FSH, median (IQR), mIU/mL | 56.2 (54.1–77.8) |
| LH, median (IQR), mIU/mL | 32.7 (17.2–36.8) |
| Glucose, median (IQR), mg/dL | 92 (83–104) |
| Fat distribution by DEXA (ratio android: gynoid) | 1.04 (0.98–1.15) |
Abbreviations: ABPM, 24‐hour ambulatory blood pressure monitoring; DBP, diastolic blood pressure; DEXA, dual‐energy x‐ray absorptiometry; eGFR, estimated glomerular filtration rate; FSH, follicle‐stimulating hormone; HDL, high‐density lipoprotein; IQR, interquartile range; LDL, low‐density lipoprotein; LH, luteinizing hormone; SBP, systolic blood pressure.
The primary endpoint comparing delta change between groups showed azilsartan reduced 24‐hour urinary aldosterone by 47.3% from baseline (P=.03), with the difference in urine aldosterone reduction between groups from baseline at 6 months being (−5.3±52.3% placebo vs −47.3±32.9% azilsartan; P=.07) (Figure 2.
Figure 2.
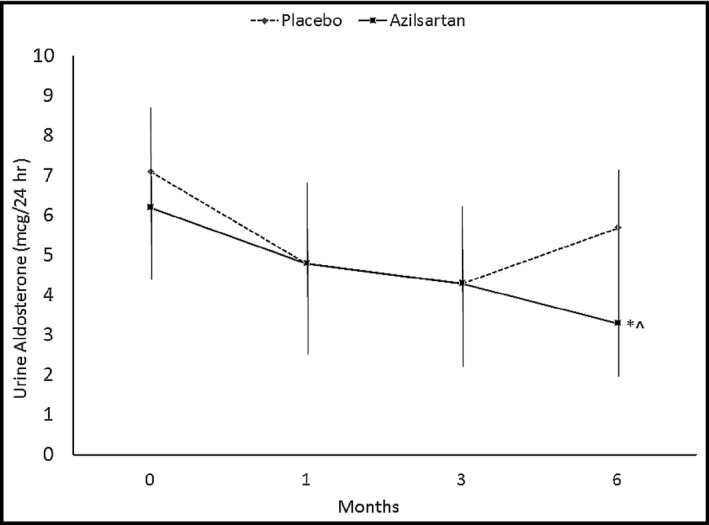
Twenty‐four–hour urinary aldosterone in postmenopausal azilsartan‐ vs placebo‐treated patients. *P=.03 azilsartan different from baseline. ^P=.07 6‐month azilsartan group compared with 6‐month placebo group.
There were clear differences in BP control throughout the trial. Office BP readings were significantly lower in the azilsartan group at 6 months (134±16/85±9.5 mm Hg at baseline vs 113±14/75±8.8 mm Hg at 6 months, P=.02,) compared with the placebo group (137±9.5/89±11 mm Hg at baseline vs 129±9.4/89±11 mm Hg at 6 months, P=.061). The differences between groups was also significant at 6 months (P=.045). Sixteen of the 21 women completed the trial and a per‐protocol analysis was performed. The findings and trends were similar to the intention‐to‐treat analysis (Table 2).
Table 2.
Baseline Characteristics of Postmenopausal Women Randomized to Azilsartan Medoxomil or Placebo
| Variables | Placebo (n=11) | Azilsartan Medoxomil (n=10) | P Value |
|---|---|---|---|
| Demographics | |||
| Age, median (IQR), y | 55 (53–57) | 61 (56–63) | .082 |
| African American race, No. (%) | 9 (81.8) | 10 (100.0) | .476 |
| BMI, median (interquartile), kg/m2 | 30.6 (29.0–31.7) | 31.8 (26.9–36.8) | >.999 |
| Waist‐to‐hip ratio, median (IQR) | 0.93 (0.90–1.01) | 0.89 (0.86–0.90) | .093 |
| Hemodynamics | |||
| SBP, median (IQR), mm Hg | 135 (124–138) | 138 (130–144) | .341 |
| DBP, median (IQR), mm Hg | 88 (84–95) | 85 (76–91) | .273 |
| ABPM | |||
| SBP median (IQR), mm Hg | 122 (110–136) | 126 (112–139) | .805 |
| DBP, median (IQR), mm Hg | 73 (63–78) | 68 (65–70) | .181 |
| Heart rate, median (IQR), beats per min | 77 (61–80) | 67 (63–77) | .683 |
| eGFR, median (IQR), mL/min/1.73 m2 | 79.9 (65–92) | 69.1 (65–88) | .323 |
| Metabolic hormones | |||
| Total cholesterol, median (IQR), mg/dL | 212 (173–242) | 175 (142–228) | .354 |
| HDL cholesterol, median (IQR), mg/dL | 46 (43–55) | 57 (48–68) | .082 |
| LDL cholesterol, median (IQR), mg/dL | 134 (100–146) | 108 (102–135) | .714 |
| Triglycerides, median (IQR), mg/dL | 167 (137–256) | 95 (93–131) | .024 |
| Urine aldosterone, median (IQR), µg/24 h | 6.7 (5.6–12) | 7.3 (4.6–10) | .751 |
| Plasma renin, median (IQR), ng/mL/h | 1.3 (0.6–1.4) | 0.6 (0.1–1.1) | .248 |
| FSH, median (IQR), mIU/mL | 56.2 (55.0–77.8) | 56.4 (43.7–80.3) | .526 |
| Glucose, median (IQR), mg/dL | 92 (78–106) | 89 (83–97) | .778 |
| Fat distribution by DEXA (ratio android/gynoid) | 1.02 (0.98–1.08) | 1.02 (0.94–1.07) | .758 |
Abbreviations: ABPM, 24‐hour ambulatory blood pressure monitoring; DBP, diastolic blood pressure; DEXA, dual‐energy x‐ray absorptiometry; eGFR, estimated glomerular filtration rate; FSH, follicle‐stimulating hormone; HDL, high‐density lipoprotein; IQR, interquartile range; LDL, low‐density lipoprotein; LH, luteinizing hormone; SBP, systolic blood pressure.
Adipocyte Cell Culture
The three patients who consented to fat pad biopsy had body mass indexes ranging from 31.9 to 33.6. The level of aldosterone produced by the adrenal cell line NCI‐H295R treated with the subcutaneous adipocyte–conditioned media from three postmenopausal women is shown in Figure 3. The data demonstrate an increase in aldosterone production at 48 hours of incubation that was blocked by the ARB valsartan (1948±1297 pg/mL fat alone vs 894±438 pg/mL fat + ARB, P=.022). Valsartan was used since azilsartan was not available for cell studies.
Figure 3.
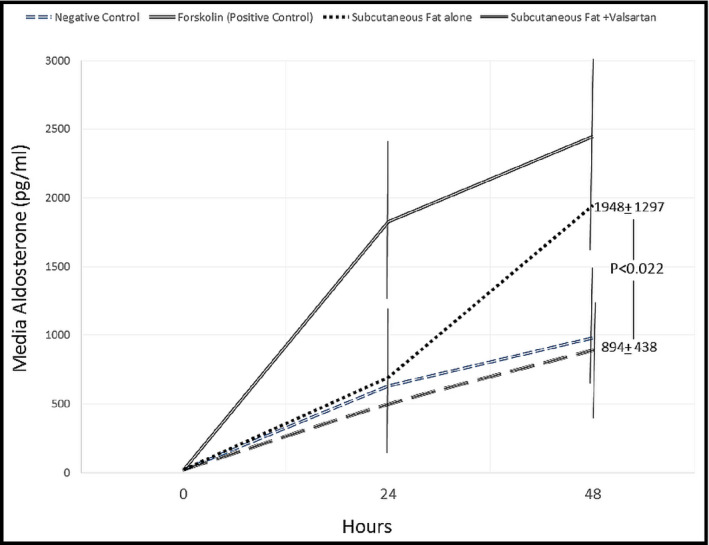
Changes in aldosterone levels in culture media of subcutaneous adipocytes of postmenopausal women.
Adverse Events
There were minimal adverse events seen in the randomized trial. In the azilsartan group, three patients required dose reduction to 40 mg/d because of hypotension, one patient noted worsened lower extremity edema, and one noted an increased BP. No serious adverse events were reported in the placebo group.
Discussion
The results demonstrate increased aldosterone production by the cells exposed to the subcutaneous adipocytes of three patients in the study, an increase that was attenuated with the use of an ARB. Moreover, a reduction in urinary aldosterone excretion among postmenopausal women randomized to azilsartan was also noted; however, it was not greater than placebo (P=.07). This reduction in urinary aldosterone with an ARB is consistent with prior studies showing a similar reduction.22 The current study failed to show a difference over placebo primarily as a result of small sample size and larger‐than‐predicted standard deviations in urinary aldosterone.
Taken together, these data support the hypothesis that subcutaneous fat cells from obese postmenopausal predominately African American women produce aldosterone. However, the amount produced is not reflected in urinary aldosterone measurement and is thus not clinically meaningful.
There are at least three contributing factors that may account for this lack of effect on urinary aldosterone in spite of increased fat cell production. First, one third of the patients randomized to azilsartan developed hypotension that required a dose reduction to 40 mg. Second, too few patients were randomized. Last, it is possible that the well‐known aldosterone escape was or had occurred prior to the 6‐month period previously described, resulting in levels returning toward baseline.
Study Limitations
Because this was a pilot study, certain factors limit definitive statements about the clinical meaningfulness between central adiposity and aldosterone production including the number of patients enrolled. The few number of patients clearly restricts the interpretation of our results. This resulted in relatively large CIs (and statistical trends, but not significance for some variables) that may not have occurred with a greater number of enrolled patients. Further, the potency of BP lowering provided by 80 mg of azilsartan is greater than comparable ARBs including valsartan and olmesartan.21 Given that one third of azilsartan‐treated patients had their dose reduced by 50% during the 6 months of treatment because of hypotension, the aldosterone‐lowering effect of azilsartan was probably limited.
Conclusions
This randomized double‐blind placebo‐controlled pilot study demonstrates production of aldosterone by an adrenal cell line treated with subcutaneous fat from obese African American women that was significantly blocked by an ARB. This increased aldosterone production was not seen clinically as assessed by urinary aldosterone excretion. Moreover, azilsartan reduced urinary aldosterone in postmenopausal women but failed to show a greater effect than placebo as a result of large variability and small sample size. These data extend the current findings by demonstrating a lack of clinically relevant increases in urinary aldosterone levels in spite of increased adipocyte production.
Disclosures
Laffin, Majewski, Liao: none; Bakris: principal investigator of this investigator‐initiated trial funded by Takeda and consultant for AbbVie, Janssen, Bayer, NxStage, Relypsa, Takeda, Merck, Boehringer‐Ingelheim, and Astra Zeneca.
J Clin Hypertens (Greenwich). 2016;18:1216–1221. DOI: 10.1111/jch.12857. © 2016 Wiley Periodicals, Inc.
References
- 1. Lloyd‐Jones DM, Larson MG, Beiser A, Levy D. Lifetime risk of developing coronary heart disease. Lancet. 1999;353:89–92. [DOI] [PubMed] [Google Scholar]
- 2. Mosca L, Banka CL, Benjamin EJ, et al. Evidence‐based guidelines for cardiovascular disease prevention in women: 2007 update. J Am Coll Cardiol. 2007;49:1230–1250. [DOI] [PubMed] [Google Scholar]
- 3. Dickie K, Micklesfield LK, Chantler S, et al. Meeting physical activity guidelines is associated with reduced risk for cardiovascular disease in black South African women; a 5.5‐year follow‐up study. BMC Public Health. 2014;14:498. [DOI] [PMC free article] [PubMed] [Google Scholar]
- 4. Howard BV, Rossouw JE. Estrogens and cardiovascular disease risk revisited: the Women's Health Initiative. Curr Opin Lipidol. 2013;24:493–499. [DOI] [PMC free article] [PubMed] [Google Scholar]
- 5. Rosano G, Vitale C, Spoletini I, Fini M. Cardiovascular health in the menopausal woman: impact of the timing of hormone replacement therapy. Climacteric. 2012;15:299–305. [DOI] [PubMed] [Google Scholar]
- 6. Perez‐Lopez FR, Chedraui P, Gilbert JJ, Perez‐Roncero G. Cardiovascular risk in menopausal women and prevalent related co‐morbid conditions: facing the post‐Women's Health Initiative era. Fertil Steril. 2009;92:1171–1186. [DOI] [PubMed] [Google Scholar]
- 7. Lapidus L, Bengtsson C, Larsson B, et al. Distribution of adipose tissue and risk of cardiovascular disease and death: a 12 year follow up of participants in the population study of women in Gothenburg, Sweden. Br Med J (Clin Res Ed). 1984;289:1257–1261. [DOI] [PMC free article] [PubMed] [Google Scholar]
- 8. Ley CJ, Lees B, Stevenson JC. Sex‐ and menopause‐associated changes in body‐fat distribution. Am J Clin Nutr. 1992;55:950–954. [DOI] [PubMed] [Google Scholar]
- 9. Rose DE, Farmer MM, Yano EM, Washington DL. Racial/ethnic differences in cardiovascular risk factors among women veterans. J Gen Intern Med. 2013;28(suppl 2):S524–S528. [DOI] [PMC free article] [PubMed] [Google Scholar]
- 10. Agyemang P, Powell‐Wiley TM. Obesity and black women: special considerations related to genesis and therapeutic approaches. Curr Cardiovasc Risk Rep. 2013;7:378–386. [DOI] [PMC free article] [PubMed] [Google Scholar]
- 11. Gasevic D, Ross ES, Lear SA. Ethnic differences in cardiovascular disease risk factors: a systematic review of North American evidence. Can J Cardiol. 2015;31:1169–1179. [DOI] [PubMed] [Google Scholar]
- 12. Feraco A, Armani A, Mammi C, et al. Role of mineralocorticoid receptor and renin‐angiotensin‐aldosterone system in adipocyte dysfunction and obesity. J Steroid Biochem Mol Biol. 2013;137:99–106. [DOI] [PubMed] [Google Scholar]
- 13. Flynn C, Bakris GL. Interaction between adiponectin and aldosterone. Cardiorenal Med. 2011;1:96–101. [DOI] [PMC free article] [PubMed] [Google Scholar]
- 14. Kidambi S, Kotchen JM, Grim CE, et al. Association of adrenal steroids with hypertension and the metabolic syndrome in blacks. Hypertension. 2007;49:704–711. [DOI] [PubMed] [Google Scholar]
- 15. Ruano M, Silvestre V, Castro R, et al. Morbid obesity, hypertensive disease and the renin‐angiotensin‐aldosterone axis. Obes Surg. 2005;15:670–676. [DOI] [PubMed] [Google Scholar]
- 16. Goodfriend TL, Egan BM, Kelley DE. Aldosterone in obesity. Endocr Res. 1998;24:789–796. [DOI] [PubMed] [Google Scholar]
- 17. Williams B, MacDonald TM, Morant S, et al. Spironolactone versus placebo, bisoprolol, and doxazosin to determine the optimal treatment for drug‐resistant hypertension (PATHWAY‐2): a randomised, double‐blind, crossover trial. Lancet. 2015;386:2059–2068. [DOI] [PMC free article] [PubMed] [Google Scholar]
- 18. Ehrhart‐Bornstein M, Lamounier‐Zepter V, Schraven A, et al. Human adipocytes secrete mineralocorticoid‐releasing factors. Proc Natl Acad Sci USA. 2003;100:14211–14216. [DOI] [PMC free article] [PubMed] [Google Scholar]
- 19. Krug AW, Vleugels K, Schinner S, et al. Human adipocytes induce an ERK1/2 MAP kinases‐mediated upregulation of steroidogenic acute regulatory protein (StAR) and an angiotensin II‐sensitization in human adrenocortical cells. Int J Obes (Lond). 2007;31:1605–1616. [DOI] [PubMed] [Google Scholar]
- 20. Bakris GL, Sica D, White WB, et al. Antihypertensive efficacy of hydrochlorothiazide vs chlorthalidone combined with azilsartan medoxomil. Am J Med. 2012;125:1229. [DOI] [PubMed] [Google Scholar]
- 21. White WB, Weber MA, Sica D, et al. Effects of the angiotensin receptor blocker azilsartan medoxomil versus olmesartan and valsartan on ambulatory and clinic blood pressure in patients with stages 1 and 2 hypertension. Hypertension. 2011;57:413–420. [DOI] [PubMed] [Google Scholar]
- 22. Bakris GL, Siomos M, Richardson D, et al. ACE inhibition or angiotensin receptor blockade: impact on potassium in renal failure. VAL‐K Study Group. Kidney Int. 2000;58:2084–2092. [DOI] [PubMed] [Google Scholar]