Abstract
Increased blood pressure and high dietary salt are leading risks for death and disability globally. Reducing the burden of both health risks are United Nations' targets for reducing noncommunicable disease. Nongovernmental organizations and individuals can assist by ensuring widespread dissemination of the best available facts and recommended interventions for both health risks. Simple but impactful fact sheets can be useful for informing the public, healthcare professionals, and policy makers. The World Hypertension League has developed fact sheets on dietary salt and hypertension but in many circumstances the greatest impact would be obtained from national‐level fact sheets. This manuscript provides instructions and a template for developing fact sheets based on the Global Burden of Disease study and national survey data.
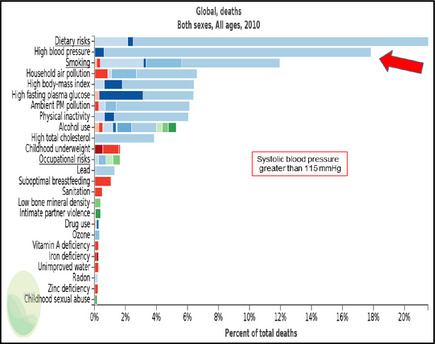
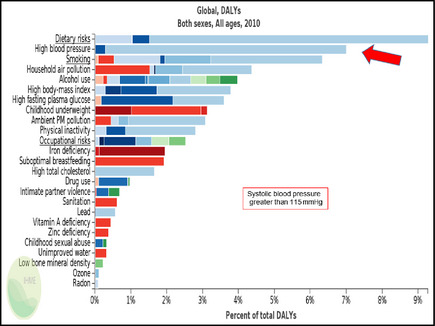
The Global Burden of Disease (GBD) study was conducted to summarize the best available evidence to estimate the impact of major health risks and diseases on death and disability globally and at a national level.1, 2 In 2010, it was estimated that increased blood pressure accounted for 17.8% of premature deaths (9.4 million deaths, 162 million years of life lost) and 7% of disability (173 million disability‐adjusted life years [DALYs]) globally (Figures 1 and 2). This very high burden of disease resulted in the World Health Organization (WHO) highlighting increased blood pressure in World Health Day 2013.3 Similarly, increased dietary sodium (salt) was estimated to be the seventh leading risk for death and disability, accounting for 5.6% of premature deaths (3.1 million deaths, 57 million years of life lost) and 2.4% of disability (62 million DALYs) globally. These global statistics have been used in World Hypertension League (WHL) and International Society of Hypertension (ISH) fact sheets for global advocacy and education.4, 5
Figure 1.

The leading risks for death from the Global Burden of Disease study 2010. Increased blood pressure (red arrow) is the second leading risk attributed to 17.8% of global deaths. With permission from the Institute for Health Metrics and Evaluation.
Figure 2.

The leading risks for disability globally from the Global Burden of Disease study 2010. Increased blood pressure (red arrow) is the second leading risk attributed to 7% of disability globally. With permission from the Institute for Health Metrics and Evaluation.
Fact sheets are useful resources to advocate for and promote programs to prevent and control hypertension and to reduce dietary salt. They can also help organizations, the public, and providers understand and use consistent information based on the best available evidence. To help promote national or local programs and the best evidence base, fact sheets using national data (vs global data) are likely to have a greater impact. This resource and guidance is intended to facilitate the development of fact sheets based on national‐level data. A template for producing national fact sheets is included as Appendix S1.
In addition to publication of the methods and results, the GBD study is hosted on a Web site that provides the results of detailed analyses at a global, regional, and national level (Institute for Health Metrics and Evaluation [IHME]: Global Burden of Disease Compare. Seattle, WA: IHME, University of Washington, 2013. http://vizhub.healthdata.org/gbd-compare). The Web site can also be utilized to obtain “best evidence” on a variety of major diseases and health risks.
For information on hypertension scroll to the bottom of the page (http://www.healthdata.org) and under the results column click “Data Visualizations.” Then scroll down the next page and select the “GDB Arrow Diagram.” Select “Risks” in the top row to access blood pressure data (“Risks” can be found in the top row of selection items in the grey box at the top of the screen). Also found in the grey box at the top of the screen are several drop‐down menus. The first drop‐down allows the user to select the geographical location of interest. Global‐, regional‐, or national‐level data can be selected. In the second row of the grey box, data can be selected by sex, type of health indicator (eg, death, disability, years of life lost), and differing age ranges. Holding the cursor over the health risk in the bar graph provides estimates with confidence intervals and the rank of the risk. The left column of the graph provides health risks in 1990 while the right column of the graph provides 2010 estimates.
Returning to the “Data Visualizations” option, scroll down to “GBD Compare” to get more detailed data and figures that can be downloaded. On the left side of the page, a series of drop‐down menus will appear. In the first drop‐down menu, select the option “Total (All Causes).” Next to the drop‐down titled “Top Chart,” select the drop‐down option “Stacked Bar Chart.” The remaining drop‐down menus give the user a number of options. The risk category can be selected to be an “Overview” for hypertension data (listed as “High Blood Pressure”) or “Dietary Risk” to view information on dietary sodium. Under “Metric,” the health indicator of interest (eg, death) can be selected. The geographical area of interest can be selected under “Place” and the population characteristics of the data can also be selected. The user has the option to view the data as percentages, numbers, or rates. The stacked bars provide data that is color‐coded. Hovering the cursor over the bar graph provides details on the data based on the options selected. The data can be transcribed to create original figures and tables or on the top of the right side of the page, there is an option to download the data and the figure. For developing figures with the bar graphs, the downloaded figure can be edited (cropped) using standard photographic software (see Figures 1 and 2 as examples, please acknowledge the source and obtain permission if using the material in public or written presentations).
The same data visualizations on the IHME Web site can be used to determine estimates of the deaths and disability from hypertensive outcomes such as stroke and ischemic heart disease. To assert these outcomes use the default “Causes” option as opposed to “Risks.”
Additional data are also available on the WHO Web site ( http://www.who.int/gho/ncd/risk_factors/blood_pressure_prevalence/en/). National‐level data on hypertension prevalence and indicators may also be obtained by literature searches or the regional WHO office or national government. In particular, the WHO's STEPwise Approach to Surveillance (STEPs) survey provides quality blood pressure data and many countries have conducted this survey (http://www.who.int/chp/steps/en/ Accessed August 1, 2014) but have yet to publically publish the data. National‐level data on uncontrolled hypertension are available at http://www.who.int/gho/countries/en/. To access them, select the country of interest under “Country profiles” and select “Health Statistics” summarized for major health topics. Under “Noncommunicable Diseases,” select “Country Profile.” The raised blood pressure data, if available for that nation, are under “Adult Risks.”
The authors of this publication recommend use of the data from the IHME and WHO Web sites to develop national‐level fact sheets and PowerPoint slides for advocacy and educational purposes. The national data can also be used to rationalize the need for governmental interventions to prevent and control hypertension and to reduce dietary salt. Meetings with politicians and funding bodies highlighting the burden of disease is important to reduce the burden of hypertension, and fact sheets can be used to remind policy decision makers of the importance of blood pressure as a driver of death disability and health costs. The fact sheets can also be used to educate the public and healthcare professionals with standardized consistent information.
It is noted that for some nations reliable data may not be available or no data at all. In these situations, the GBD study has utilized best estimates to conduct analyses and those using the Web site need to understand this limitation.2 The GBD study is updating its analysis and hence more recent and reliable estimates will become available and foresee regularly updating the nation‐specific fact sheet. The WHL can assist national organizations in developing their own fact sheets (e‐mail: ceo@whleague.org) and the WHL proposes, with permission, to share your completed fact sheets through the WHL Web site (www.whleague.org).
Statement of Financial Disclosure
Drs Campbell and Lackland report no specific funding in relation to this research and no conflicts of interest to declare. Dr Niebylski is a paid contractor for the WHL but has no other conflicts to report.
Supporting information
Appendix S1. High Blood Pressure in_____: Why Prevention and Control Are Urgent and Important.
Acknowledgment
The authors thank Kimbree Redburn for her contributions to this resource.
J Clin Hypertens (Greenwich). 2015;17:165–167. DOI: 10.1111/jch.12479. © 2015 Wiley Periodicals, Inc.
References
- 1. Murray CJ, Vos T, Lozano R, et al. Disability‐adjusted life years (DALYs) for 291 diseases and injuries in 21 regions, 1990–2010: a systematic analysis for the global burden of disease study 2010. Lancet. 2013;380:2197–2223. [DOI] [PubMed] [Google Scholar]
- 2. Murray CJ, Ezzati M, Flaxman AD, et al. GBD 2010: design, definitions, and metrics. Lancet. 2013;380:2063–2066. [DOI] [PubMed] [Google Scholar]
- 3. World Health Organization . A Global Brief on Hypertension: Silent Killer, Global Public Health Crisis. World Health Day 2013. Report, 1–39. Geneva, Switzerland: World Health Organization; 2013. [Google Scholar]
- 4. Campbell N, Niebylski M, Lackland D. High blood pressure: why prevention and control are urgent and important. A 2014 fact sheet from the World Hypertension League and the International Society of Hypertension. J Clin Hypertens (Greenwich). 2014;16:551–553. [DOI] [PMC free article] [PubMed] [Google Scholar]
- 5. Campbell NRC, Niebylski M, Lackland DT. Dietary salt fact sheet of the World Hypertension League, International Society of Hypertension, Pan American Health Organization Technical Advisory Group on Cardiovascular Disease Prevention through Dietary Salt Reduction, WHO Coordinating Centre on Population Centre Salt Reduction, and World Action on Salt and Health. J Clin Hypertens (Greenwich). 2014; DOI: 10.1111/jch.12402. [DOI] [PMC free article] [PubMed] [Google Scholar]
Associated Data
This section collects any data citations, data availability statements, or supplementary materials included in this article.
Supplementary Materials
Appendix S1. High Blood Pressure in_____: Why Prevention and Control Are Urgent and Important.


