

Abstract
The authors aimed to assess the reproducibility of normotension and white‐coat, masked, and sustained hypertension in 839 untreated patients who underwent two separate assessments (median, 3; interquartile range, 0–13 months) by both office and ambulatory blood pressure (BP) monitoring (ABPM). The proportion of patients falling into the same category in the two assessments was: 52% normotension and 55% white‐coat, 47% masked, and 82% sustained hypertension. The most frequent switch was to sustained hypertension (26% of white‐coat and 33% of masked hypertension). No clinical factors predicted the change in category, except for higher office diastolic BP in patients with masked hypertension who developed sustained hypertension, compared with those who remained with masked hypertension (84±4 mm Hg vs 80±5 mm Hg; P=.006). The reproducibility of hypertension phenotypes was highly dependent on the time between assessments. The authors conclude that white‐coat and masked hypertension phenotypes are only reproducible in the short‐term, while they frequently shift towards sustained hypertension in the long‐term.
Most hypertension guidelines recommend the use of ambulatory blood pressure (BP) monitoring (ABPM) for a better assessment of arterial hypertension.1, 2 In addition to sustained normotension and hypertension, the simultaneous use of conventional BP measurements and ABPM classifies individuals into two other different categories: white‐coat or isolated clinic hypertension (elevated BP in the office with normal ambulatory BP [ABP]) and masked hypertension (normal BP in the office with elevation of ABP).
Some controversy still exists regarding both the criteria for definition and the prognostic importance of white‐coat and masked hypertension.3 In terms of diagnosis, both daytime ABP and 24‐hour ABP have been used for the classification of hypertension phenotypes. This has affected the rate of prevalence of these two categories and has made the assessment of their prognostic importance less consistent across different studies. In this regard, white‐coat hypertension has been considered in most papers to have a better prognosis compared with sustained hypertension (ie, both office BP and ABP elevation),4 while some long‐term studies have suggested that it is not a totally benign condition, with a tendency toward increased stroke rates in these patients.5 Masked hypertension has been shown to have a worse prognosis, as it is often underdiagnosed and, consequently, undertreated.6
BP estimates obtained by ABPM are more reproducible than those measured in the office in the short‐term, ie, by considering repeated assessments separated by a few days or weeks.7, 8 However, changes in hypertension phenotypes in the long‐term may be caused not only by limited reproducibility but also, and more likely, by changes in clinical conditions.9, 10 While some data are available on the short‐term reproducibility of hypertension diagnosis obtained through different BP measurements, no appropriate data have been reported regarding stability of hypertension phenotypes in the mid‐ or long‐term (ie, with intervals of months or years). Providing information on such an issue would be of crucial clinical importance, in relation to making long‐term diagnostic and therapeutic decisions, with a prognostic impact on the clinical history of such patients, especially those who remain untreated.
The aim of the present study was to evaluate the short‐term and long‐term reproducibility of different hypertension phenotypes in a group of untreated patients from the Spanish ABPM Registry with two assessments (clinic BP measurements and 24‐hour ABPM) performed at different time intervals. We also tried to identify those factors (clinical characteristics and time between assessments) that were related to either the short‐term and the long‐term reproducibility of hypertension phenotypes defined by the combined use of clinic and ambulatory BP measurements.
Patients and Methods
Study Design
The characteristics of patients from the Spanish ABPM Registry have been previously reported.11, 12, 13, 14 The current analysis was carried out in a database of 4756 valid patients. These patients were identified by focusing on individuals (same record identifier) with at least two different assessments (valid clinic BP and 24‐hour ABPM), separated by at least 3 days. Among them, 1419 were untreated at the first assessment and 839 were also untreated at the second assessment. Results are restricted to the latter 839 patients and median (interquartile range) interval between assessments was 3 months (0–13).
Measurements
BP was measured in the office with a validated oscillometric device after a 5‐minute rest in a sitting position. BP values were estimated as the mean of two readings. Thereafter, 24‐hour ABPM was performed using the Spacelabs 90207 oscillometric device (Spacelabs Healthcare, Snoqualmie, WA) programmed to register BP at 20‐minute intervals for the 24‐hour period. The majority of recordings were performed on working days and the patients were instructed to attend their usual activities, avoid daytime sleep, return the following morning for device removal, and keep the arm extended and immobile at the time of each cuff inflation. Valid recordings had to fulfill a series of pre‐established criteria, including ≥80% of systolic BP (SBP) and diastolic BP (DBP) successful readings during the daytime and nighttime periods, 24‐hour duration of the recording, and at least one valid BP measurement per hour.
Definition of Different Hypertension Phenotypes
According to BP measured in the office and by ABPM, patients were divided into four different groups: those with normotension, when both office BP (<140/90 mm Hg) and 24‐hour ABP (<130/80 mm Hg) were normal; those with sustained hypertension, when both office BP (≥140 mm Hg and/or 90 mm Hg) and 24‐hour ABP (≥130 mm Hg and/or 80 mm Hg) were elevated; those with white‐coat hypertension, when office BP was elevated and 24‐hour ABP was normal; and those with masked hypertension, when office BP was normal and 24‐hour ABP was elevated. As recently proposed by Asayama and colleagues,15 a parallel analysis was performed using the proposed criteria for definition of white‐coat hypertension (normal values for all 24‐hour, daytime, and nighttime periods) and masked hypertension (abnormal values of either 24‐hour, daytime, or nighttime periods). Furthermore, the same analysis based on daytime BP was also carried out. Results are available in Tables S1 and S2.
Definition of Clinical Variables Considered in the Study
Clinical variables were age in years, sex, body mass index (BMI), smoking, (active use of any kind of tobacco in the past year), diabetes mellitus (plasma fasting glucose ≥7 mmol/L or use of antidiabetic drugs), dyslipidemia (total cholesterol >4.9 mmol/L or low‐density lipoprotein cholesterol >3 mmol/L or high‐density lipoprotein cholesterol <1.0 mmol/L (men) or <1.2 mmol/L (women) or fasting triglycerides >1.7 mmol/L or use of lipid‐lowering drugs), and previous cardiovascular disease, as documented in the clinical records (coronary event, cerebrovascular event, heart failure hospitalization, or coronary or peripheral revascularization).
Statistical Analysis
Continuous data are presented as means±standard deviation (or median [interquartile range] if not normally distributed) and frequencies and percentages for categorical variables. Differences in clinical variables between groups (patients in the same or in different categories in the two assessments) were analyzed with Student t test, nonparametric Mann‐Whitney test, or chi‐square test, when appropriate. Cohen's kappa statistics and Pearson correlation coefficients were calculated as measures of agreement between phenotype distributions, diagnoses of normal/abnormal BP, or between absolute BP values. SPSS for Windows version 19.0 software (Armonk, NY) was used for statistical analysis.
Results
The proportions of the four hypertension phenotypes in the two assessments are shown in Figure 1 for the whole group, regardless of the time interval between measurements. In the first assessment, the proportion of normotensive patients was 17%, white‐coat hypertensive patients was 24%, masked hypertensive patients was 9%, and sustained hypertensive patients was 50%. At the second assessment, corresponding figures were 16%, 21%, 10%, and 53%, respectively.
Figure 1.
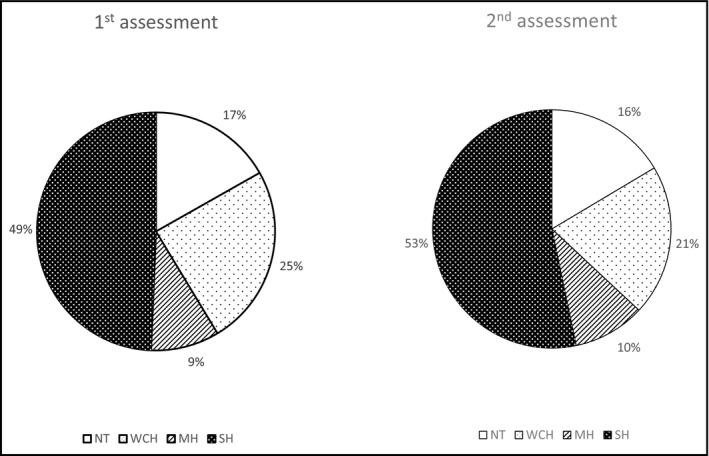
Proportion of patients with the four hypertension phenotypes in the first and second assessments. NT indicates normotension; WCH, white‐coat hypertension; MH, masked hypertension; SH, sustained hypertension.
Globally, 566 patients (67.5%) had a concordant diagnosis in the two assessments, whereas 273 (32.5%) showed a discordant diagnosis. Table 1 shows the clinical characteristics of patients who switched or did not switch to a different category in the second assessment. As shown, no significant differences were observed in the main clinical parameters between groups. BP values (both office and ambulatory) in the first and second assessments for the entire groups of patients, as well as separately for those with a concordant and nonconcordant phenotype, are detailed in Table 2. Table 3 shows the distribution of patients with each of the four phenotypes at the second assessment grouped by the diagnosis at the first assessment. Only a first diagnosis of sustained hypertension was highly reproducible (82.2%). On the contrary, only 52.5% of patients diagnosed as having normotension, 55.6% of patients diagnosed as having white‐coat hypertension, and 47.4% of patients diagnosed as having masked hypertension had the same diagnosis in the second assessment. In the latter three groups, the highest proportion of patients who switched to a different category were those who developed sustained hypertension (19.1% of normotensives, 25.9% of white‐coat hypertensives, and 33.3% of masked hypertensives). Since this increased risk of developing sustained hypertension in the other groups could be affected by the high prevalence of the former phenotype, we also calculated these probabilities by using “mover‐stayer” models.16 The corresponding probabilities were 20.2% for normotension, 27.4% for white‐coat hypertension, and 33.9% for masked hypertension. The overall agreement between assessments in phenotype distribution (kappa statistics) was 0.499.
Table 1.
Clinical Differences Between Patients With a Concordant or Nonconcordant Diagnosis of Blood Pressure Phenotype in the Two Assessments
| Parameter | Concordant (n=566) | Nonconcordant (n=273) | P Value |
|---|---|---|---|
| Age, y | 52.6±13.9 | 53.9±13.7 | .187 |
| Women, % | 44.5 | 43.6 | .799 |
| BMI, kg/m2 | 28.8±6.6 | 29.5±7.3 | .157 |
| Smokers, % | 19.4 | 16.1 | .245 |
| Diabetics, % | 15.2 | 18.7 | .200 |
| Office heart rate, beats per min | 76.1±13.4 | 75.3±13.3 | .445 |
| eGFR, mL/min/1.73m2 | 88.6±19.2 | 86.9±18.5 | .512 |
| UAE, mg/g | 3.9 (1–6.3) | 4.2 (1–14) | .493 |
| LVH by ECG, % | 0.7 | 0.4 | .548 |
| Previous CV disease, % | 1.2 | 0.7 | .507 |
| Time between assessments, mo | 1 (0–11) | 7 (2–18) | <.001 |
Abbreviations: BMI, body mass index; CV, cardiovascular; ECG, electrocardiography; eGFR, estimated glomerular filtration rate using simplified Modification of Diet in Renal Disease formula; LVH, left ventricular hypertrophy; UAE, urinary albumin excretion.
Table 2.
Office and Ambulatory Blood Pressures in the First and Second Assessments in All Studied Patients and Separately in Patients With a Concordant a Nonconcordant Phenotype
| All (N=839) | Concordant (n=566) | Nonconcordant (n=273) | ||||
|---|---|---|---|---|---|---|
| First Assessment | Second Assessment | First Assessment | Second Assessment | First Assessment | Second Assessment | |
| Office SBP | 145.5±17.0 | 145.8±17.4 | 147.6±17.7 | 148.0±17.8 | 141.0±14.7 | 141.4±15.7 |
| Office DBP | 88.2±10.9 | 88.3±11.3 | 89.4±11.2 | 89.1±11.3 | 85.6±9.8 | 86.5±11.0 |
| 24‐Hour SBP | 128.6±12.8 | 130.4±14.3a | 130.2±13.2 | 131.4±14.5b | 125.2±11.1 | 128.3±13.8b |
| 24‐Hour DBP | 78.8±9.4 | 79.5±9.9c | 79.9±9.6 | 80.2±10.1 | 76.6±8.7 | 77.9±9.3c |
| Daytime SBP | 132.1±13.2 | 133.8±14.8a | 133.7±13.7 | 134.9±15.0b | 128.9±11.4 | 131.5±14.1b |
| Daytime DBP | 81.9±9.9 | 82.5±10.3c | 82.9±10.1 | 83.3±10.5 | 79.9±9.1 | 80.9±9.8 |
| Nighttime SBP | 118.3±14.0 | 120.2±15.2a | 120.0±14.4 | 120.8±15.1c | 114.7±12.5 | 118.8±15.2a |
| Nighttime DBP | 69.7±9.8 | 70.4±9.9c | 70.9±10.1 | 70.9±10.1 | 67.3±8.7 | 69.2±9.4b |
a P<.001. b P<.01. c P<.05; paired t test comparing first vs second assessment.
Table 3.
Distribution of Patients in the Four Phenotypes in the Two Assessments Using the Criteria of Normality in 24 Hours
| NT, % | WCH, % | MH, % | SH, % | Total, % | |
|---|---|---|---|---|---|
| NT | 74 (8.8) | 22 (2.6) | 18 (2.1) | 27 (3.2) | 141 (16.8) |
| WCH | 33 (3.9) | 114 (13.6) | 5 (0.6) | 53 (6.3) | 205 (24.4) |
| MH | 13 (1.5) | 2 (0.2) | 37 (4.4) | 26 (3.1) | 78 (9.3) |
| SH | 18 (2.1) | 34 (4.1) | 22 (2.6) | 341 (40.6) | 415 (49.5) |
| Total | 138 (16.4) | 172 (20.5) | 82 (9.8) | 447 (53.3) | 839 (100.0) |
Abbreviations: MH, masked hypertension; NT, normotension; SH, sustained hypertension; WCH, white‐coat hypertension. Data from the first assessment are in shown in the rows and from the second assessment in the columns.
In the specific groups of patients diagnosed as having white‐coat or masked hypertension at the first assessment, we analyzed possible differences between patients who remained in the same category or who developed sustained hypertension. Table 4 shows these results. No significant differences were found in white‐coat hypertensives between those who remained in the category (n=114) or who developed sustained hypertension (n=53). In the masked hypertension group, only diastolic office BP (83.6±4.4 mm Hg vs 80.1±5.3 mm Hg; P=.007) was significantly higher in those who developed sustained hypertension (n=26), compared with those who remained masked hypertensive (n=37).
Table 4.
Clinical Differences Between Patients With White‐Coat Hypertension and Masked Hypertension at Frist Assessment, Depending on the Stability of the Same Diagnosis or a Switch to a Diagnosis of Sustained Hypertension
| Parameter | WCH at the First Assessment | MH at First Assessment | ||||
|---|---|---|---|---|---|---|
| WCH at Second Assessment (n=114) | SH at Second Assessment (n=53) | P Value | MH at Second Assessment (n=37) | SH at Second Assessment (n=26) | P Value | |
| Age, y | 58.1±14.4 | 56.9±12.2 | .592 | 47.0±14.2 | 50.9±10.6 | .243 |
| Women, % | 59.6 | 47.2 | .131 | 43.2 | 38.5 | .704 |
| BMI, kg/m2 | 29.2±5.0 | 30.7±8.4 | .155 | 27.6±7.4 | 29.2±7.8 | .436 |
| Smokers, % | 11.4 | 9.4 | .702 | 16.2 | 26.9 | .301 |
| Diabetics, % | 14.0 | 18.9 | .423 | 8.1 | 23.1 | .095 |
| Office SBP, mm Hg | 150.3±11.0 | 149.3±11.7 | .608 | 128.6±8.1 | 131.9±5.6 | .080 |
| Office DBP, mm Hg | 89.2±8.3 | 89.0±9.3 | .874 | 80.1±5.3 | 83.6±4.4 | .007 |
| 24‐Hour SBP, mm Hg | 120.3±6.1 | 120.0±6.6 | .833 | 133.3±12.0 | 132.7±7.9 | .810 |
| 24‐Hour DBP, mm Hg | 71.6±5.8 | 72.9±8.9 | .222 | 81.9±6.1 | 83.6±7.4 | .325 |
Abbreviations: BMI, body mass index; DBP, diastolic blood pressure; MH, masked hypertension; SH, sustained hypertension; SBP, systolic blood pressure; WCH, white‐coat hypertension.
The same analyses were carried out by separately considering individuals who had an interval between measurements lower than 1 month and those who had an interval longer than 1 month, respectively. This was done in order to further explore factors associated with the degree of reproducibility of hypertension phenotypes and, in particular, the impact of time interval between BP assessments. A total of 325 patients had the two assessments separated by less than 1 month, whereas in the remaining (n=514), between‐assessments time was more than 1 month (median, 11; IQR, 4–23 months). The consistency of category diagnosis was highly dependent on time between assessments. Thus, as shown in Figure 2, in patients having the two assessments separated by less than 1 month, reproducibility was very high for normotension (85%), white‐coat hypertension (89%), and sustained hypertension (95%), and only a masked hypertension diagnosis at the first assessment showed limited reproducibility (68%). The general agreement between phenotype distribution (Cohen's kappa statistics) was 0.799. In contrast, the reproducibility of the hypertension phenotypes when considering assessments separated by more than 1 month were as low as 36%, 42%, and 36%, for normotension, white‐coat hypertension, and masked hypertension, respectively, while only sustained hypertension showed acceptable reproducibility (72%). The general agreement (kappa for phenotype distribution between assessments) was 0.302.
Figure 2.
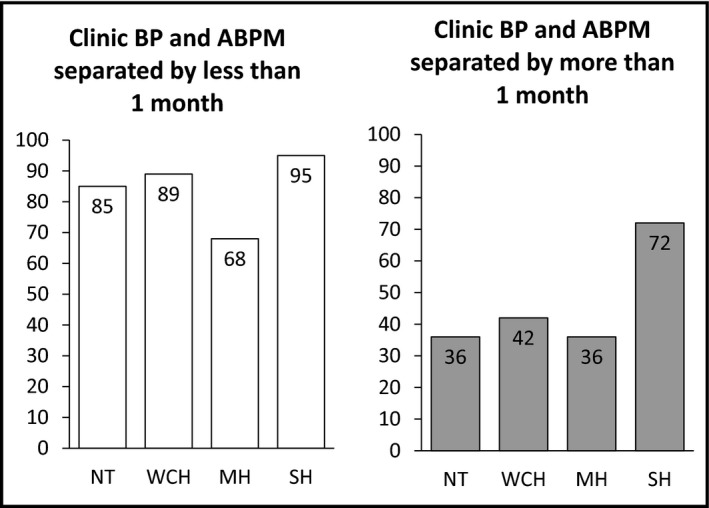
Proportion of patients with reproducible phenotypes according to time between assessments. Left: assessments separated by less than 1 month. Right: assessments separated by 1 month or more. BP indicates blood pressure; ABPM, ambulatory blood pressure monitoring; NT, normotension; WCH, white‐coat hypertension; MH, masked hypertension; SH, sustained hypertension.
We also examined the agreement between diagnosis of normal/abnormal BP, separately for office and 24‐hour BP. Kappa values were 0.522 for office BP and 0.675 for 24‐hour BP. Pearson correlation coefficients between each pair of BP measurements were 0.663 and 0.656 for office systolic and diastolic BP, respectively, and 0.695 and 0.741 for systolic and diastolic 24‐hour BP, respectively.
Discussion
The present analysis from the Spanish ABPM Registry in untreated patients with twice repetition of office BP measurements and ABPM shows that only the sustained hypertension phenotype (both office and 24‐hour BP elevation) was reproducible both in the short‐ and long‐term. Conversely, both white‐coat and masked hypertension, as well as normotension (in this selected population), were reproducible only in the short‐term (with less than a 1‐month interval between measurements), whereas in the long‐term, more than 50% of patients in either one of these three categories showed a different diagnosis, which, in most cases, was sustained hypertension, probably due to a progression in the mechanisms promoting BP elevation over time. This needs to be taken into account in the diagnostic process of hypertension, as well as when deciding on treatment or follow‐up strategies in these patient categories.
The spreading use of ABPM is now recognized as a helpful tool that aids in the diagnosis and management of hypertensive patients, as several estimators (24‐hour, daytime, and nighttime BP; the circadian pattern; and BP variability) provide important information regarding prognosis, association with target organ damage, and effects of antihypertensive therapies.3 White‐coat hypertension and masked hypertension are relatively common phenomena derived from the simultaneous use of both office BP measurements and ABPM (or home self‐measurement). While masked hypertension seems to carry an increased cardiovascular risk,3, 4, 6 the prognostic importance of white‐coat hypertension is a matter of debate, as discrepancies have been observed in longitudinal studies with cardiovascular event rates either similar or higher than in normotensive individuals.3, 4, 5 However, most of these studies have assumed that a diagnosis of white‐coat or masked hypertension is stable over time, while our data, based on long‐term repetition of office and ambulatory BP assessments, indicate that the likelihood of developing sustained hypertension in such patients is high. This is in agreement with a previous report indicating a high rate of development of sustained hypertension after a period of observation of 10 years.9
A previous study assessed the long‐term reproducibility of hypertension phenotypes, defined on the basis of two‐time repetition of simultaneous office and ABP measurements.10 This was a retrospective study in a mixed population of treated and untreated patients, and the mean interval between measurements was 1.5 years. Hypertension phenotypes were defined by office and daytime BP cutoffs. Only 14 of 31 patients (45%) with white‐coat hypertension and 11 of 25 (44%) individuals with masked hypertension at the time of the first assessment had the same diagnosis at the time of the second assessment. The most common reason for change in the diagnosis (35% and 28%, respectively) was the switch to sustained hypertension. Unfortunately, important therapeutic changes occurred during time‐between assessments, with some untreated patients beginning antihypertensive treatment while other already treated patients had an increase in the number of drugs prescribed. As a result of this, differences between assessments were clearly influenced by these changes in treatment. The group who remained untreated included only 39 patients, and only six of nine patients with white‐coat hypertension and four of nine with masked hypertension fell into the same category 1.2 years later.
More recently, another two reports from another group examined the short‐term reproducibility of masked hypertension in patients with prehypertension or mild hypertension without antihypertensive treatment.7, 8 Masked hypertension was confirmed in about 60% to 70% of patients with two examinations 1 week apart.
Finally, in a group of patients with white‐coat resistant hypertension, Muxfeldt and colleagues17 reported that the diagnosis was confirmed in 73% after 3 months, with the remaining patients developing sustained hypertension. Subsequent ABPM performed at 6‐month periods revealed a 20% to 25% rate of patients who developed true resistant hypertension.
To our knowledge, the present study is the first to explore both short‐term and long‐term reproducibility of hypertension phenotypes in a large group of untreated patients who did not receive any antihypertensive therapy during the time interval between assessments. Our results confirm good reproducibility of these hypertension phenotypes only in the short‐term, in agreement with the above‐mentioned studies on patients with masked hypertension.7, 8 However, in our whole analyses and, in particular, when we only considered patients who had the two BP assessments performed at a time distance of almost 1 year, the reproducibility of such phenotypes was relatively poor, with only sustained hypertension being fairly reproducible in the long‐term. In contrast, white‐coat and masked hypertension phenotypes were only reproducible in approximately one half of such patients in the whole analysis and in only 35% to 40% of them when both measurements were separated by a median of almost 1 year.
Our data are therefore in agreement with previous papers showing a satisfactory short‐term reproducibility of these BP phenotypes, while they do not support the conclusions reached by Ben‐Dov and colleagues10 that white‐coat and masked hypertension are also reasonably reproducible conditions in the long‐term. Changes in antihypertensive therapy during the follow‐up of these patients might have eventually led to the reported elevated reproducibility. Our study has the advantage of patients who were not taking antihypertensive pharmacologic therapy, thus eliminating possible sources of bias and confusion in data interpretation. However, we have to acknowledge that other nonpharmacologic therapies implemented or modified during follow‐up, and from which we have no information, could eventually have influenced changes in BP between assessments.
Another important finding of our study is that none of the considered clinical variables were able to predict a change in these hypertension phenotypes. Although we have previously reported several clinical factors associated with the presence of white‐coat hypertension,11 white‐coat resistant hypertension,13 or masked hypertension,14 they do not seem to be able to predict any possible change in these conditions over time, at least in this relative young cohort of untreated patients. This was also observed (Table S3) when the nonconcordant group (273) was divided into those who moved to a higher‐risk phenotype (151) and those who moved to a lower‐risk phenotype (122).
Study Limitations
We have to acknowledge a few limitations of our study. First, these analyses were performed on an existing database, not specifically designed for the purpose of the present investigation. In particular, the second set of BP assessments did not have a specific indication, and it was performed based on independent decisions by the physicians involved in the registry. Moreover, we do not have information regarding the reasons why patients with a diagnosis of masked or sustained hypertension remained untreated after a median of 3 months (1 year in some cases). We can speculate that these patients were considered as not having a high cardiovascular risk. European guidelines recommend an unspecified period of lifestyle changes before starting pharmacologic therapy in such patients.1 It has to be acknowledged, in this regard, that a low prevalence of cardiovascular disease or target organ damage characterized this cohort. In addition, therapeutic inertia should be considered as a cause of patients who were not taking antihypertensive treatment between assessments. Finally, other conditions, such as the degree of physical activity, could have been different in the two ABPM procedures.
Conclusions
The diagnosis of white‐coat or masked hypertension cannot be a priori considered as stable over time, as they can change during follow‐up of various duration. We report here that after 3 months of follow‐up, almost 50% of patients with such diagnoses at the first assessment would fall into a different category at the time of a second assessment, with the development of sustained hypertension being the most frequent diagnostic change. This emphasizes the need of repeating both office and out‐of‐office BP measurements during follow‐up of these patients, especially in those who have not started antihypertensive treatment, in order to assess the stability of their hypertension phenotype.
Sources of Funding
The Spanish ABPM Registry was initiated and is maintained by an unrestricted grant from Lacer Laboratories, Spain.
Disclosures
None.
Supporting information
Table SI. Distribution of patients in the four phenotypes in the two assessments (data from the first assessment are shown in the rows and from the second assessment are shown in the columns), using the criteria of normality in all ABPM periods (daytime, nighttime, and 24‐hours).
Table SII. Distribution of patients in the four phenotypes in the two assessments (data from the first assessment are shown in the rows and from the second assessment are shown in the columns), using the criteria of normality in daytime BP.
Table SIII. Clinical differences among patients with a concordant phenotype, with a lower‐risk phenotype in the second assessment, or with a higher‐risk phenotype in the second assessment.
Figure S1. Histogram of time interval between assessments.
Acknowledgments
We thank all participants of the Spanish ABPM Registry. Their names are available at www.cardiorisc.com.
J Clin Hypertens (Greenwich). 2016;18:927–933. DOI: 10.1111/jch.12792. © 2016 Wiley Periodicals, Inc.
References
- 1. Mancia G, Fagard R, Narkiewicz K, et al. ESH/ESC Guidelines for the management of arterial hypertension. The Task Force for the management of arterial hypertension of the European Society of Hypertension (ESH) and of the European Society of Cardiology (ESC). J Hypertens. 2013;31:1281–1357. [DOI] [PubMed] [Google Scholar]
- 2. National Institute for Health and Clinical Excellence (NICE) . Hypertension. The clinical management of primary hypertension in adults. Clinical Guideline 127. 2011. http://www.nice.org.uk/guidance/CG127. Accessed November, 2015.
- 3. O'Brien E, Parati G, Stergiou G, et al. European Society of Hypertension position paper on ambulatory blood pressure monitoring. J Hypertens. 2013;31:1731–1768. [DOI] [PubMed] [Google Scholar]
- 4. Ohkubo T, Kikuya M, Metoki H, et al. Prognosis of “masked” hypertension and “white‐coat” hypertension detected by 24‐h ambulatory blood pressure monitoring 10‐year follow‐up from the Ohasama study. J Am Coll Cardiol. 2005;46:508–515. [DOI] [PubMed] [Google Scholar]
- 5. Verdecchia P, Reboldi GP, Angeli F, et al. Short‐ and long‐term incidence of stroke in white‐coat hypertension. Hypertension. 2005;45:203–208. [DOI] [PubMed] [Google Scholar]
- 6. Bobrie G, Clerson P, Menard J, et al. Masked hypertension: a systematic review. J Hypertens. 2008;26:1715–1725. [DOI] [PubMed] [Google Scholar]
- 7. Viera AJ, Lin FC, Tuttle LA, et al. Reproducibility of masked hypertension among adults 30 years or older. Blood Press Monit. 2014;19:208–215. [DOI] [PMC free article] [PubMed] [Google Scholar]
- 8. Viera AJ, Hinderliter AL, Kshirsagar AV, et al. Reproducibility of masked hypertension in adults with untreated borderline office blood pressure: comparison of ambulatory and home monitoring. Am J Hypertens. 2010;23:1190–1197. [DOI] [PubMed] [Google Scholar]
- 9. Mancia G, Bombelli M, Facchetti R, et al. Long‐term risk of sustained hypertension in white‐coat or masked hypertension. Hypertension. 2009;54:226–232. [DOI] [PubMed] [Google Scholar]
- 10. Ben‐Dov IZ, Ben‐Arie L, Mekler J, Bursztyn M. Reproducibility of white‐coat and masked hypertension in ambulatory BP monitoring. Int J Cardiol. 2007;117:355–359. [DOI] [PubMed] [Google Scholar]
- 11. Vinyoles E, Felip A, Pujol E, et al. Clinical characteristics of isolated clinic hypertension. J Hypertens. 2008;26:438–445. [DOI] [PubMed] [Google Scholar]
- 12. De la Sierra A, Redon J, Banegas JR, et al. Prevalence and factors associated with circadian blood pressure patterns in hypertensive patients. Hypertension. 2009;53:466–472. [DOI] [PubMed] [Google Scholar]
- 13. De la Sierra A, Segura J, Banegas JR, et al. Clinical features of 8295 patients with resistant hypertension classified on the basis of ambulatory blood pressure monitoring. Hypertension. 2011;57:898–902. [DOI] [PubMed] [Google Scholar]
- 14. Banegas JR, Ruilope LM, de la Sierra A, et al. High prevalence of masked uncontrolled hypertension (MUCH) in people with treated hypertension. Eur Heart J. 2014;35:3304–3312. [DOI] [PubMed] [Google Scholar]
- 15. Asayama K, Thijs L, Li Y, et al. Setting thresholds to varying blood pressure monitoring intervals differentially affects risk estimates associated with white‐coat and masked hypertension in the population. Hypertension. 2014;64:935–942. [DOI] [PMC free article] [PubMed] [Google Scholar]
- 16. Griffiths DA. Maximum likelihood estimation fot the beta‐binomial distribution and an application to the household distribution of the total number of cases of a disease. Biometrics. 1973;29:637–648. [PubMed] [Google Scholar]
- 17. Muxfeldt ES, Fiszman R, de Souza F, et al. Appropriate time interval to repeat ambulatory blood pressure monitoring in patients with white‐coat resistant hypertension. Hypertension. 2012;59:384–389. [DOI] [PubMed] [Google Scholar]
Associated Data
This section collects any data citations, data availability statements, or supplementary materials included in this article.
Supplementary Materials
Table SI. Distribution of patients in the four phenotypes in the two assessments (data from the first assessment are shown in the rows and from the second assessment are shown in the columns), using the criteria of normality in all ABPM periods (daytime, nighttime, and 24‐hours).
Table SII. Distribution of patients in the four phenotypes in the two assessments (data from the first assessment are shown in the rows and from the second assessment are shown in the columns), using the criteria of normality in daytime BP.
Table SIII. Clinical differences among patients with a concordant phenotype, with a lower‐risk phenotype in the second assessment, or with a higher‐risk phenotype in the second assessment.
Figure S1. Histogram of time interval between assessments.