

Abstract
Clinical pharmacists are utilized in Veterans Health Administration (VHA) facilities to assist with management of patients with chronic conditions including hypertension. The goal of this study was to examine blood pressure (BP) control after discontinuation of an intensive pharmacist‐managed intervention. The study was conducted at a single Midwest VHA medical center and two affiliated community‐based outpatient clinics. Patients with uncontrolled BP received an intensive pharmacist intervention for the first 6 months. Patients were then stratified based on whether their BP was controlled or not and were randomized to either continue the intervention for another 24 months (30 month total time period) or the intervention was discontinued following one‐time receipt of educational materials. Mean systolic and diastolic BPs were reduced (P<.001) in diabetic patients (8.0±14.4 mm Hg and 4.0±9.1 mm Hg, respectively) and in nondiabetic patients (14.0±16.4 mm Hg and 5.0±10.0 mm Hg, respectively) following the 6‐month intervention, with 54% of the total sample achieving BP control. BP control and the reduction in mean BP was maintained to a similar degree in both study groups at 12, 18, 24, and 30 months. There were no significant differences in BP at any of the follow‐up periods in patients who did and did not receive the continued pharmacist intervention. This study found that BP control was maintained for at least 24 months following discontinuation of an intensive pharmacist intervention. These findings were seen in both the group that had a continued pharmacist intervention and in the group that had a one‐time educational session when the intervention was discontinued. This study suggests that once BP control is achieved following a pharmacist intervention, patients can be referred back to their primary care provider for continued follow‐up.
Team‐based care strategies have emerged as an effective approach for managing hypertension and other chronic conditions.1, 2, 3, 4 For example, the Community Preventive Services Task Force recently evaluated 44 studies of team‐based care (median intervention duration of 12 months) and found a mean difference of −5.4 mm Hg in systolic blood pressure (SBP),5 while a previous systematic review found a mean difference of −9.7 mm Hg when compared with usual care.6 The former systematic review found higher blood pressure (BP) control rates with pharmacists compared with the addition of other professionals. This finding was confirmed by another systematic review that found that nurses and pharmacists were effective in improving BP but that the effect of pharmacists was greater, with 9 mm Hg vs 5 mm Hg reductions, respectively.7
Based on this and other evidence, hypertension guidelines developed by the Veterans Health Administration (VHA) and the Department of Defense recommend the use of team‐based strategies involving pharmacists to improve BP control in patients with resistant hypertention.8 While studies have found that pharmacist‐based teams can improve BP control, these studies have largely involved short‐term interventions. Thus, it is not known whether patients should be referred back to primary care providers (PCPs) once BP is controlled or whether longer‐term pharmacist assistance is needed. To date, few randomized studies have evaluated team‐based strategies to sustain the effect of such interventions.
We previously reported the results of a trial in veterans in which all patients with uncontrolled BP at baseline were enrolled. Many of these participants' BP had been poorly controlled for long periods. All patients received a pharmacist intervention for 6 months.9 In order to determine whether the intervention could be sustained, patients were then randomized to continue or discontinue the intervention. The primary goal of this study was to evaluate whether improvements in BP seen at 6 months could be sustained for 24 months following the discontinuation of the intervention. We hypothesized that improvements in mean BP would be maintained in patients who continued to receive the intervention but would deteriorate in patients who received a one‐time educational intervention and then discontinued the pharmacist intervention. This hypothesis was based on one retrospective evaluation conducted after a prospective intervention had been discontinued.10
Methods
Study Design and Patient Selection
The study design has previously been reported and will be briefly reviewed here.9 This was a randomized controlled trial conducted at the Iowa City Veteran Affairs (VA) Health Care System (VAHCS) and two community‐based outpatient clinics in Coralville and Cedar Rapids, IA (Figure). The study was approved by the University of Iowa's institutional review board and the Iowa City VA Research and Development Committee.
Figure 1.
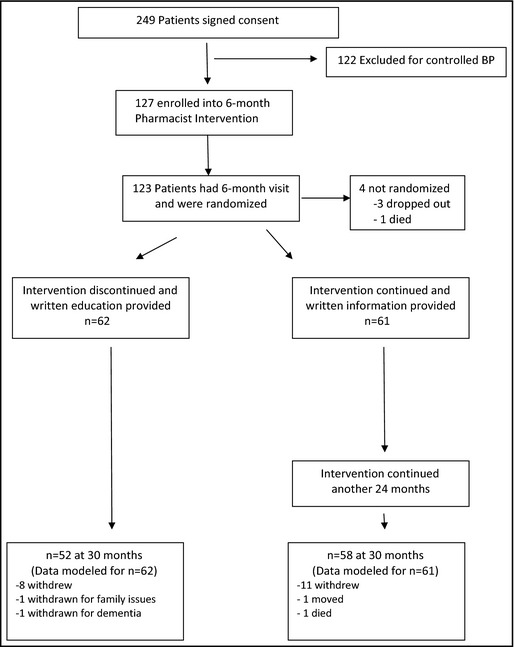
Study overview. BP indicates blood pressure.
Participants were identified from the VAHCS computerized patient record system and screened for inclusion by the study coordinator. The coordinator determined whether the patient had an assigned VA PCP and a diagnosis of hypertension and then reviewed clinic BP values over the previous 18 months. If the most recent clinic BP met study criteria or the average of the last three BP values met criteria, the coordinator then determined whether any exclusions (see below) were present. Eligible participants were mailed a letter inviting them to participate and then contacted via telephone by a member of the research team, who explained the study. If the individual expressed interest, the 10‐item Pfeiffer Short Portable Mental Status Questionnaire was administered. If no impairment in cognitive function was noted (defined as ≥3 errors), a baseline visit was scheduled.
Participants were eligible if they were enrolled in primary care through the VAHCS and met the following inclusion criteria: (1) diagnosis of hypertension captured by International Classification of Diseases, Ninth Revision, Clinical Modification codes from prior outpatient visits; (2) elevated BP (≥140/90 mm Hg among nondiabetics or ≥130/80 mm Hg among diabetics)8 during the most recent VA clinic visit or based on the average from the last three visits; and (3) elevated BP measured by a member of the research team at the baseline visit. Patients were excluded if they had: (1) a prior history or current signs of hypertensive emergency including symptoms of angina, stroke, or acute renal failure; (2) severe hypertension (SBP >200 mm Hg or diastolic BP [DBP] >114 mm Hg); (3) history of acute myocardial infarction, stroke, or unstable angina in the prior 6 months; (4) heart failure caused by systolic dysfunction with a left ventricular ejection fraction <35% documented by echocardiography, nuclear medicine study, or ventriculography; (5) renal insufficiency, defined by a glomerular filtration rate <30 mL/min or previously documented proteinuria >1 g per day; (6) significant hepatic disease, including prior diagnoses of cirrhosis, hepatitis B or C infection, or laboratory abnormalities (serum alanine aminotransferase or aspartate aminotransferase >2 times control or total bilirubin >1.5 mg/dL) in the prior 6 months; (7) pregnancy; (8) prior diagnoses of pulmonary hypertension or sleep apnea (unless treated by continuous positive pressure ventilation); (9) poor prognosis, with a life expectancy estimated less than 2 years; (10) residence in a nursing home or diagnosis of dementia; (11) inability to give informed consent or impaired cognitive function (as defined above); and (12) no telephone for follow‐up calls.
Study personnel were trained to measure BP using standardized guidelines.11, 12 BP was measured three times using an automated device (HEM 907‐XL; Omron, Schaumburg, IL). The second and third BP values at each study visit were averaged using previous methods to determine the research BP value.11, 13 Research BP measurements were obtained at baseline and at 6, 12, 18, 24, and 30 months in all patients.
At the baseline visit, study personnel reviewed the study with the patient and obtained informed consent. If the patient's BP did not meet the inclusion criteria or if their SBP was >200 mg Hg or <100 mg Hg or their DBP was >114 mg Hg or <50 mm Hg, research staff informed the patient's PCP and the patient was not enrolled. If patients were enrolled, the following information was obtained: (1) the duration of hypertension; (2) other cardiac risk factors (eg, smoking status and alcohol use); (3) diet, nutrition, activity, and exercise; (4) symptoms and adverse drug reactions; (5) medication and dietary adherence (eg, low‐sodium or reduced‐calorie diet); (6) sociodemographics; (7) comorbidities; and (8) current medications. The patient's height, weight, and pulse rate were also obtained. Following the interview, all patient were referred to the intervention pharmacist.
Intervention
All enrolled patients received the study intervention for 6 months.9 This included structured visits with the pharmacist at baseline and 1, 2, 4, and 6 months and telephone calls at 2 weeks and between the in‐person visits as needed. In this study, PCPs gave the pharmacist authority to prescribe BP medications and order appropriate laboratory tests to assess renal function and electrolytes. The pharmacist reviewed the electronic medical record and performed a structured interview, including: (1) a detailed medication history of all prescription, nonprescription, and herbal therapies; (2) an assessment of patient knowledge of all medications, dosages and timing, and potential side effects; (3) potential contraindications to specific medications; (4) expectations for future dosage changes and of the need for future monitoring; and (5) potential barriers to BP control (eg, side effects,14 nonadherence,15, 16 low self‐efficacy).17, 18, 19 The PCP was informed about any changes made in the patient's therapy within the VHA's electronic medical record system. Three different pharmacists provided the intervention over the course of the study.
The goal BPs for this study were based on VA guidelines including SBP <140 mm Hg and DBP <90 mm Hg for nondiabetics and <130 mm Hg and 80 mm Hg for diabetics.8, 20
Stratification and Randomization
Participants completing the 6‐month pharmacist intervention were then randomized to a continued high‐intensity pharmacist intervention or to a low‐intensity one‐time education intervention.21 Prior to randomization, patients were stratified into those who had achieved BP control at 6 months and those not at control in order to ensure balance in each arm. Randomization was based on a stratified blocked design, in which group assignments were made sequentially from numbered sealed envelopes prepared in blocks of eight.
Data Analysis
This study used intent‐to‐treat analysis in which all enrolled and eligible patients were included regardless of treatment engagement, adherence, and completion of follow‐up visits. There were four patients, however, who were never randomized to one of the treatment groups and were excluded from this analysis. Nineteen participants had missing BP data at 6 months and 23 had missing data at 30 months. The majority of patients (86.2%) had BP data for all time points. One patient was missing all BP data after the 6‐month interview. There were two patients with BP information only and no data collected from face‐to‐face interviews. More than 94% of the sample had complete data for the demographic variables such as race, education, and income. In order to retain all eligible patients in the analyses we used multiple imputation (MI) to fill in missing values. We imputed values for all variables with missing data and created five datasets.22 The five imputed datasets were analyzed simultaneously using the SAS MIANALYZE procedure (SAS Institute, Cary, NC).22
We compared baseline characteristics by study arm using chi‐square tests for categorical variables and independent samples t tests for continuously measured variables. We also examined changes over time by study arm in BP control rates, SBP, medication changes, and the receipt of thiazide prescriptions. Again, we used chi‐square tests for categorical variables and t tests for continuously measured variables.
In order to measure medication changes made by the intervention pharmacist, we used medication information at each time point to create a medication change variable classifying patients as having received: (1) increased medication between visits, (2) decreased medication, (3) some other medication change, or (4) no change. A patient was identified as having increased their medications if they had an increase in the dose of at least one medication or had an increase in the total number of medications they were taking. A patient decreased medications if they had a decrease in the dosage of any medication or a reduction in the total number of medications taken. Other medication changes included replacing one medication for another (with dosages and the total number of medications staying the same). There was no medication change if the patient was taking the exact same medications (medication name, number, and dosage for all medications) between various time points. If a patient had a mix of increases and decreases of medication, the final determination was based on difference in the total number of medications taken. In other words, if the pharmacist added some medications and stopped some medications or increased the dose of some medications and decreased the dose for some medications but the total number of medications increased between visits, the patient was coded as having an increase in medication. The reverse is true for patients who had a mix of increases and decreases in dosages and number of medications but had a decrease in the total number of medications between visits. A patient was only coded as “other change” if the total number of medications did not change from between visits but some other change did occur.
Results
A total of 249 patients with previously uncontrolled BP consented to the study. However, when BP was properly measured by the research staff, 122 (49%) had controlled BP and were excluded. The remaining 127 patients were enrolled in the study. Following the 6‐month interview, 123 patients were randomized and assigned to one of the two arms and are included in this analysis. The mean age was 64.8±10.8 years. Patients were predominantly male (n=120; 98%) and white (n=114; 93%) and 54 (43.9%) had diabetes. Baseline demographics in patients randomized to the continued pharmacist intervention and to the discontinued intervention are shown in Table 1. Although not statistically significant, a greater proportion of participants in the continued intervention vs the discontinued intervention who were diabetic (52.5% vs 35.5%, P=.06), had <12 years of education (52.5% vs 38.7%, P=.14) or had income <$25,000 per year (37.7% vs 33.9%, P=.16), potentially making it more difficult to maintain BP control in the continued intervention group.
Table 1.
Patient Characteristics at Randomization (6 Months)
| Variable Name | Discontinued Intervention (n=62) | Continued Pharmacist Intervention (n=61) | P Value |
|---|---|---|---|
| Men, % (No.) | 96.8 (60) | 98.4 (60) | .57 |
| Age, mean (SD), y | 66.0 (10.4) | 63.6 (11.2) | .23 |
| Minimum–Maximum | 31–94 | 27–83 | |
| Race/ethnicity, % (No.) | |||
| Non‐Hispanic Caucasian | 91.9 (57) | 93.4 (57) | .85 |
| Minority | 4.8 (3) | 4.9 (3) | |
| Declined to answer | 3.2 (2) | 1.6 (1) | |
| Education, % (No.) | |||
| ≤12 y | 38.7 (24) | 52.5 (32) | .14 |
| >12 y | 58.1 (36) | 47.5 (29) | |
| Missing | 3.2 (2) | 0.0 (0) | |
| Marital status, % (No.) | |||
| Married | 56.5 (35) | 67.2 (41) | .15 |
| Not married | 38.7 (24) | 32.8 (20) | |
| Missing | 4.8 (3) | 0.0 (0) | |
| Supplemental insurance coverage, % (No.) | |||
| Medicare | 35.5 (22) | 26.2 (16) | .39 |
| Commercial | 35.5 (22) | 47.5 (29) | |
| Medicaid | 4.8 (3) | 3.3 (2) | |
| None | 21.0 (13) | 23.0 (14) | |
| Missing | 3.2 (2) | 0.0 (0) | |
| Annual income, % (No.) | |||
| <$25,000 | 33.9 (21) | 37.7 (23) | .16 |
| ≥$25,000 | 56.5 (35) | 60.7 (37) | |
| Missing | 9.7 (6) | 1.6 (1) | |
| Diabetes, % (No.) | 35.5 (22) | 52.5 (32) | .06 |
Abbreviation: SD, standard deviation.
During the 6‐month initial intervention, mean SBP and DBP were reduced (P<.001) from baseline values in the 54 diabetic patients (8.0±14.4 mm Hg and 4.0±9.1 mm Hg, respectively) and in the 73 patients without diabetes (14.0±16.4 mm Hg and −5.0±10.0 mm Hg, respectively). BP control was attained in 54% of patients by the end of the 6‐month intervention (Table 2).
Table 2.
BP at Each Time Period in Patients in Whom the Pharmacist Intervention Was Continued or Discontinued at 6 Months
| Endpoint/Study Group | Baselinea | 6 Monthsa | 12 Monthsa | 18 Monthsa | 24 Monthsa | 30 Monthsa |
|---|---|---|---|---|---|---|
| BP control rate | ||||||
| Intervention discontinued | ||||||
| BP controlled at 6 months (33), % | 0 | 100 | 57.6 | 57.6 | 66.7 | 51.5 |
| BP uncontrolled at 6 months (29), % | 0 | 0 | 34.5 | 34.5 | 41.4 | 55.2 |
| All patients (62), % | 0 | 53.2 | 48.4 | 46.8 | 53.2 | 53.2 |
| Intervention continued | ||||||
| BP controlled at 6 months (34), % | 0 | 100 | 55.9 | 58.8 | 55.9 | 67.1 |
| BP uncontrolled at 6 months (27), % | 0 | 0 | 22.2 | 29.6 | 33.3 | 48.1 |
| All patients (61), % | 0 | 55.7 | 41.0 | 45.9 | 47.5 | 57.4 |
| Mean systolic BP (SD) | ||||||
| Intervention discontinued | 147 (11.7) | 136 (14.2) | 136 (16.0) | 138 (17.7) | 136 (15.0) | 137 (17.7) |
| Intervention continued | 147 (13.7) | 134 (14.7) | 136 (17.6) | 134 (17.2) | 133 (16.4) | 132 (17.3) |
| Mean diastolic BP (SD) | ||||||
| Intervention discontinued | 78.8 (9.9) | 75.0 (11.1) | 75.2 (10.8) | 75.9 (10.3) | 74.4 (9.1) | 74.5 (11.7) |
| Intervention continued | 79.9 (11.8) | 73.9 (12.4) | 76.9 (12.5) | 74.6 (10.6) | 74.6 (10.8) | 73.6 (12.0) |
Abbreviations: BP, blood pressure; SD, standard deviation.
None of the differences between the study groups were significant (P>.1 for all comparisons).
Mean SBP, DBP, and BP control rates were similar at 6 months in patients who were randomized to the continued pharmacist intervention or to discontinuing the intervention (Table 2). There were small differences between the two groups after randomization at 12, 18, 24, and 30 months, but none of these differences were statistically significant (P>.1). BP control at 30 months was similar to what was observed at randomization (6 months) in both groups, suggesting that the overall benefits of the intervention were largely maintained over time.
Table 3 displays good balance between the group that had the intervention discontinued and the group in which the intervention was continued regarding controlled BP at the 6‐month randomization (53.2% vs 55.7%, respectively). BP control was maintained in 53.2% and 57.4% of patients by 30 months, respectively. However, examination of the individual data for patients in both groups who were controlled at randomization is revealing. It is apparent that 48% in the group where the intervention was stopped lost BP control compared with 35% who had the intervention continued (not significantly different). Likewise, for patients in either group whose BP was not controlled at randomization, about half had their BP controlled by 30 months.
Table 3.
Medication Changes and Thiazide Use a
| Baseline | 6 Months b | 12 Months | 18 Months | 24 Months | 30 Months | |
|---|---|---|---|---|---|---|
| Intervention discontinued (n=62) | ||||||
| Medication changes | N/A | |||||
| Increased | 35.5 | 21.0 | 14.5 | 4.8 | 21.0 | |
| Decreased | 4.8 | 16.1 | 17.7 | 4.8 | 9.7 | |
| Other change | 37.1 | 11.3 | 9.7 | 1.6 | 14.5 | |
| No change | 22.6 | 51.6 | 58.1 | 88.7 | 54.8 | |
| Intervention continued (n=61) | ||||||
| Medication change | N/A | |||||
| Increased | 31.1 | 24.6 | 27.9 | 1.6 | 26.2 | |
| Decreased | 8.2 | 18.0 | 13.1 | 4.9 | 14.8 | |
| Other change | 45.9 | 21.3 | 11.5 | 1.6 | 11.5 | |
| No change | 14.8 | 36.1 | 47.5 | 91.8 | 47.5 | |
| Thiazides | ||||||
| Intervention discontinued | 45.2 | 61.3 | 54.8 | 59.7 | 58.1 | 51.6 |
| Intervention continued | 41.0 | 52.5 | 57.4 | 62.3 | 62.3 | 59.0 |
Abbreviation: N/A, not applicable. Medication change represents the change from the time period immediately preceding it. aAll values are expressed as percentages. bAll patients received the pharmacist intervention from baseline to 6 months but the two groups are separated at these time points to demonstrate any imbalances at randomization.
Roughly 43% of patients were receiving thiazide diuretics at baseline. Following the pharmacist intervention for the first 6 months, the rate of thiazide use increased to 52% (Table 3). After randomization at the 6‐month visit, thiazide use remained higher in patients who continued to receive the pharmacist intervention, but the differences between groups were not significant. It appeared that thiazides were discontinued in many patients when referred back to their primary physician, while thiazide use increased over time in those who had the intervention continued. Table 3 also displays that there were more medication increases and medication changes in the intervention group at 12 and 18 months when compared with the group that had the intervention discontinued. However, these differences were not significant and suggest that physicians in this usual care portion of the trial were also increasing medications.
Discussion
This study found that overall BP control was maintained after a 6‐month pharmacist intervention was discontinued. Mean BP and BP control was similar in both the group that had the intervention continued for an additional 24 months and in the group receiving the one‐time educational intervention. As previously reported, patients who were involved in the intervention had high levels of satisfaction.9
The most likely explanation for these findings is that BP control that was achieved during the first 6 months of the intensive pharmacist intervention was maintained after it was discontinued, as has been observed in other studies including one conducted at Walter Reed Hospital.2, 23 We hypothesized that the group receiving the continued pharmacist intervention would have better BP control based on another study.10 One possible explanation is that the educational intervention may have had an influence to sustain BP in that arm. We modeled the education effort from another study that found that patients of providers who were randomly assigned to the patient education group had better BP values than those in the provider education alone groups.21
A possible explanation for continued BP control after discontinuation of the intervention may be the result of improved endothelial function once the more intensive therapy was implemented. Calcium channel blockers, angiotensin‐converting enzyme inhibitors, and angiotensin receptor blockers have been shown to reverse remodeling in resistance vessels and improve endothelial function.24, 25, 26 It is possible that once these agents are added or dosages increased and sustained for 6 months, long‐term BP control can be maintained.
It is important to note, however, that regardless of whether BP was controlled at the end of the 6‐month intervention, a larger percentage of patients had a change in BP control status over time (Table 3). Indeed, nearly half of patients in both groups who had BP controlled at 6 months no longer achieved BP control by 12 months. Likewise, about half of patients whose BP was not controlled at randomization achieved control by the end of the study regardless of the study arm. There are several potential explanations for these findings. First, many medication adjustments were being made over time in both groups, which likely led to some patients achieving BP control and others falling short of the cut point as medications were started or stopped. Second, these findings could be the result of the long‐term fluctuations in adherence to medications and lifestyle modifications. Third, these findings may be attributed to the common visit‐to‐visit variability in BP. For patients who are very close to the target cut points to determine BP control, a few mm Hg difference from one visit to the next can easily change BP control status.
There are two potential reasons it may have been more difficult to achieve BP control in this study. First, the high BP control rates throughout the VHA system led to selection of more patients with resistant hypertension or who had difficulty in achieving control.27 Second, we used Seventh Report of the Joint National Committee on Prevention, Detection, Evaluation, and Treatment of High Blood Pressure criteria to determine BP targets.20 The new 2014 hypertension guidelines were published after this study was completed.28 In our study, 53% of patients who had the continued intervention had diabetes compared with 36% in those who had the discontinued intervention. Because the 2014 guidelines have higher BP goals for patients with diabetes or chronic kidney disease and those 60 years and older, our BP control rates would have been substantially higher with the new guidelines. Finally, there were slightly more patients with diabetes, education ≤12 years, or income <$25,000 per year in those with the continued intervention compared with the discontinued intervention. These differences, though not statistically significant, could make achieving BP control more difficult in the group who had the continued intervention. Even so, this group had slightly lower mean BP values and higher BP control than the group who had the discontinued intervention.
We previously found in another study that BP control was maintained at 27 months following discontinuation of a 6‐month pharmacist intervention.23 However, in that study, only the intervention phase was prospectively evaluated with research‐measured BP values. The follow‐up values after discontinuation of the intervention in that study were determined from retrospective medical record review, which could be subject to bias or error. The present study used a standardized research BP measurement at every time period. The Community Preventive Services Task Force reviewed 44 studies of team‐based care and found a mean decline of 5.4 mm Hg in SBP when compared with usual care.5 Another review found that the strongest evidence for collaborative care was found with pharmacists.29 One research group updated their previous meta‐analysis to include 39 randomized controlled trials in 14,224 patients.30 These authors found that pharmacist interventions reduced SBP by 7.6 mm Hg (95% confidence interval, −9.0 to −6.3 mm Hg) compared with usual care. They concluded that pharmacist interventions were highly effective but that additional comparative effectiveness studies with longer duration of follow‐up are still needed to determine the most efficient methods of implementation.30 Our design was different in that there was no true control or usual care group. All patients initially received the intervention. We found that SBP was reduced 12 mm Hg during the 6‐month intervention. Our findings would suggest that once a patient's BP is controlled following a pharmacist intervention, it may be appropriate to refer the patient back to usual care and follow‐up, especially if they can be provided with one‐time educational materials at the end of the intervention. Such an approach has important cost and efficiency implications since clinical pharmacists are a scarce and relatively costly resource for a health system such as the VHA. Clinical pharmacists' time may be most efficiently spent working with patients with adherence problems and those who have not achieved BP control. However, since BP control status may frequently change in this population, frequent assessments are critical by either the PCP, pharmacist, or nurse to be sure BP control is not eventually lost.
There was another interesting finding in this study. Half the patients were excluded because their BP was controlled when measured properly despite the lack of control in the medical record. It is possible that some had improvement in control since their last clinic visit. It is more likely that inaccuracies in performing clinic BP led to higher BP values in the medical record that were lower when performed with a rigorous research technique using American Heart Association guidelines.12 This finding is not unique to VHA settings. One of us recently found the same pattern in 32 primary care offices throughout the United States where half the patients were excluded at enrollment for controlled BP.31
Study Limitations
There are several limitations to the present study. First is the unknown generalizability of our results beyond VA health systems. Second, the patient population examined was largely male, Midwestern, and Caucasian. Third, 19 patients had missing BP data at 6 months and 23 had missing data at 30 months. To address this issue and any potential bias introduced by differences between study completers and noncompleters, we performed several analyses including a multiple imputation procedure to replace missing values.
Another limitation is the relatively small sample size because of good BP control, as noted above. During the course of the study, VA policies led to BP control rates, which now are at 77% nationally.27 These factors led to a small pool of patients with poorly controlled BP, many of whom had never had controlled BP. Mean SBP was 5 mm Hg lower in the continued intervention group at 30 months compared with the group that had the intervention discontinued. It is possible that these differences may have been significant if there were more patients. In fact, this difference is nearly identical to at least one systematic review of the literature that was significant.5
Conclusions
This study found that BP control was improved and mean BP was significantly reduced during a 6‐month pharmacist intervention. The effect was maintained for another 24 months in both patients who continued to receive the intervention and those with a discontinued intervention plus one‐time educational materials. Additional studies must be performed to determine the most efficient strategies to utilize various team members. This study suggests that once BP control is achieved following a pharmacist intervention, the patient can be referred back to other PCPs.
Acknowledgment and Conflict of Interest
This project was funded by the Department of Veterans Affairs, Veterans Health Administration, Office of Research and Development, Health Services Research and Development Service (grant no. IIR 07‐145) and Comprehensive Access and Delivery Research and Development (CADRE), Iowa City VA Health Care System, Iowa City, IA. None of these sponsors had a role in the study design, methods, analyses, and interpretation or in the preparation of the manuscript or the decision to submit it for publication. The views expressed are those of the authors and do not necessarily reflect the position or policy of the VA. The authors have no conflicts of interest with the research presented in this paper.
J Clin Hypertens (Greenwich). 2015:701–708. DOI: 10.1111/jch.12577. © 2015 Wiley Periodicals, Inc.
ClinicalTrials.gov Identifier: NCT00760552.
References
- 1. Vivian EM. Improving blood pressure control in a pharmacist‐managed hypertension clinic. Pharmacotherapy. 2002;22:1533–1540. [DOI] [PubMed] [Google Scholar]
- 2. Lee JK, Grace KA, Taylor AJ. Effect of a pharmacy care program on medication adherence and persistence, blood pressure, and low‐density lipoprotein cholesterol: a randomized controlled trial. JAMA. 2006;296:2563–2571. [DOI] [PubMed] [Google Scholar]
- 3. Monson R, Bond CA, Schuna A. Role of the clinical pharmacist in improving drug therapy. Clinical pharmacists in outpatient therapy. Arch Intern Med. 1981;141:1441–1444. [PubMed] [Google Scholar]
- 4. Bond CA, Monson R. Sustained improvement in drug documentation, compliance, and disease control. A four‐year analysis of an ambulatory care model. Arch Intern Med. 1984;144:1159–1162. [PubMed] [Google Scholar]
- 5. Proia KK, Thota AB, Njie GJ, et al. Team‐based care and improved blood pressure control: a community guide systematic review. Am J Prev Med. 2014;47:86–99. [DOI] [PMC free article] [PubMed] [Google Scholar]
- 6. Walsh JM, McDonald KM, Shojania KG, et al. Quality improvement strategies for hypertension management: a systematic review. Med Care. 2006;44:646–657. [DOI] [PubMed] [Google Scholar]
- 7. Carter BL, Rogers M, Daly J, et al. The potency of team‐based care interventions for hypertension: a meta‐analysis. Arch Intern Med. 2009;169:1748–1755. [DOI] [PMC free article] [PubMed] [Google Scholar]
- 8. Department of Veterans Administration and Department of Defense . VA/DoD Clinical practice guideline for diagnosis and management of hypertension in the primary care setting. Department of Veterans Administration, Department of Defense. 2004, Revision July 2005, pages 40–46. [Google Scholar]
- 9. Parker CP, Cunningham CL, Carter BL, et al. A mixed‐method approach to evaluate a pharmacist intervention for veterans with hypertension. J Clin Hypertens (Greenwich). 2014;16:133–140. [DOI] [PMC free article] [PubMed] [Google Scholar]
- 10. Carter BL, Doucette WR, Franciscus CL, et al. Deterioration of blood pressure control after discontinuation of a physician‐pharmacist collaborative intervention. Pharmacotherapy. 2010;30:228–235. [DOI] [PMC free article] [PubMed] [Google Scholar]
- 11. Wright JT Jr, Bakris G, Greene T, et al. Effect of blood pressure lowering and antihypertensive drug class on progression of hypertensive kidney disease: results from the AASK trial. JAMA. 2002;288:2421–2431. [DOI] [PubMed] [Google Scholar]
- 12. Pickering TG, Hall JE, Appel LJ, et al. Recommendations for blood pressure measurement in humans and experimental animals: part 1: blood pressure measurement in humans: a statement for professionals from the Subcommittee of Professional and Public Education of the American Heart Association Council on High Blood Pressure Research. Hypertension. 2005;45:142–161. [DOI] [PubMed] [Google Scholar]
- 13. Carter BL, Ardery G, Dawson JD, et al. Physician and pharmacist collaboration to improve blood pressure control. Arch Intern Med. 2009;169:1996–2002. [DOI] [PMC free article] [PubMed] [Google Scholar]
- 14. Kaboli PJ, Barnett MJ, Rosenthal GE. Associations with reduced length of stay and costs on an academic hospitalist service. Am J Manag Care. 2004;10:561–568. [PubMed] [Google Scholar]
- 15. Morisky DE, Green LW, Levine DM. Concurrent and predictive validity of a self‐reported measure of medication adherence. Med Care. 1986;24:67–74. [DOI] [PubMed] [Google Scholar]
- 16. Lowry KP, Dudley TK, Oddone EZ, Bosworth HB. Intentional and unintentional nonadherence to antihypertensive medication. Ann Pharmacother. 2005;39:1198–1203. [DOI] [PubMed] [Google Scholar]
- 17. Bandura A, Jeffery RW, Wright CL. Efficacy of participant modeling as a function of response induction aids. J Abnorm Psychol. 1974;83:56–64. [DOI] [PubMed] [Google Scholar]
- 18. Bandura A, Reese L, Adams NE. Microanalysis of action and fear arousal as a function of differential levels of perceived self‐efficacy. J Pers Soc Psychol. 1982;43:5–21. [DOI] [PubMed] [Google Scholar]
- 19. Bandura A, Jourden EJ. Self‐regulatory mechanisms governing the impact of social comparison on complex decision making. J Pers Soc Pyschol. 1991;60:941–951. [Google Scholar]
- 20. Chobanian AV, Bakris GL, Black HR, et al. The Seventh Report of the Joint National Committee on Prevention, Detection, Evaluation, and Treatment of High Blood Pressure: the JNC 7 report. JAMA. 2003;289:2560–2572. [DOI] [PubMed] [Google Scholar]
- 21. Roumie CL, Elasy TA, Greevy R, et al. Improving blood pressure control through provider education, provider alerts, and patient education: a cluster randomized trial. Ann Intern Med. 2006;145:165–175. [DOI] [PubMed] [Google Scholar]
- 22. What's New in SAS 9.3. Cary, NC: SAS Institute Inc, 2012. [Google Scholar]
- 23. Wentzlaff DM, Carter BL, Ardery G, et al. Sustained blood pressure control following discontinuation of a pharmacist intervention. J Clin Hypertens (Greenwich). 2011;13:431–437. [DOI] [PMC free article] [PubMed] [Google Scholar]
- 24. Schiffrin EL, Pu Q, Park JB. Effect of amlodipine compared to atenolol on small arteries of previously untreated essential hypertensive patients. Am J Hypertens. 2002;15:105–110. [DOI] [PubMed] [Google Scholar]
- 25. Taddei S, Virdis A, Ghiadoni L, et al. Restoration of nitric oxide availability after calcium antagonist treatment in essential hypertension. Hypertension. 2001;37:943–948. [DOI] [PubMed] [Google Scholar]
- 26. Makris TK, Stavroulakis GA, Krespi PG, et al. Fibrinolytic/hemostatic variables in arterial hypertension: response to treatment with irbesartan or atenolol. Am J Hypertens. 2000;13:783–788. [DOI] [PubMed] [Google Scholar]
- 27. Fletcher RD, Amdur RL, Kolodner R, et al. Blood pressure control among US veterans: a large multiyear analysis of blood pressure data from the Veterans Administration health data repository. Circulation. 2012;125:2462–2468. [DOI] [PubMed] [Google Scholar]
- 28. James PA, Oparil S, Carter BL, et al. 2014 evidence‐based guideline for the management of high blood pressure in adults: report from the panel members appointed to the Eighth Joint National Committee (JNC 8). JAMA. 2014;311:507–520. [DOI] [PubMed] [Google Scholar]
- 29. Houle SK, Chatterley T, Tsuyuki RT. Multidisciplinary approaches to the management of high blood pressure. Curr Opin Cardiol. 2014;29:344–353. [DOI] [PubMed] [Google Scholar]
- 30. Santschi V, Chiolero A, Colosimo AL, et al. Improving blood pressure control through pharmacist interventions: a meta‐analysis of randomized controlled trials. J Am Heart Assoc. 2014;3:e000718. [DOI] [PMC free article] [PubMed] [Google Scholar]
- 31. Carter BL, Coffey CS, Ardery G, et al. A cluster‐randomized trial of a physician‐pharmacist collaborative model to improve blood pressure control. Circ Cardiovasc Qual Outcomes 2015. Mar 24 [Epub ahead of print]. [DOI] [PMC free article] [PubMed] [Google Scholar]