Abstract
The aim of this study was to evaluate the preference for salt in hypertensive and normotensive older individuals. Hypertensive (group 1: n=32, aged 73.7±6.3 years) or normotensive patients (group 2: n=26, aged 71.5±8.0 years) were submitted to a test to determine their preference for bread samples with different salt concentrations: 1.5%, 2.0% (usual concentration), and 2.7%, and were reevaluated 2 weeks later using the same salt concentrations, but with the addition of oregano. Twenty‐four–hour urinary sodium excretion (UNaV), blood pressure (BP), and body mass index (BMI) were obtained. Systolic BP, BMI, and UNaV were higher in group 1. In the first analysis, group 1 showed greater preference for the saltiest sample (P=.001). Comparing the first evaluation and the second, a greater preference for less salty samples was observed in both groups (P<.01). Hypertensive older patients consumed more salt and showed a greater salt preference than the normotensive patients. The use of the spice reduced the preference for salt in both groups.
In some studies, hypertensive individuals have shown a lower salt taste perception than normotensive individuals in tests evaluating different concentrations of saline solutions,1, 2 a difference that may favor a greater salt consumption by hypertensive patients. There is no consensus about the difference in habitual salt consumption between hypertensive and normotensive patients, with some studies reporting greater intake by hypertensive patients3 and other studies demonstrating similar consumption.4 Older people have been reported to have a reduced perception of salty flavor, possibly as a result of changes in taste buds, a fact that might expose patients in this age range to greater salt consumption and to its consequences on arterial pressure.5
Regarding the preference for foods containing more or less salt, studies conducted in young individuals have shown a similar choice for foods with different salt contents among normotensive and hypertensive patients.6, 7
Older individuals are known to be more sensitive to salt than younger individuals, ie, they have higher blood pressure (BP) levels after ingesting the same quantity of salt as younger people.8 Thus, if elderly people have a preference for saltier foods, their arterial pressure levels will be even higher. On the other hand, changes in diet, including the addition of spices and a reduced salt content, may be particularly beneficial in the elderly as long as they do not compromise intake because of low acceptance.
The objective of the present study was to evaluate salt preference in normotensive and hypertensive older individuals before and after modifying the food by adding oregano.
Methods
Before starting the protocol itself, 34 volunteers not included in the sample were tested for their ability to recognize samples of breads with more or less salt, which guided the choice of the percentages of salt in the bread samples in this study (pre‐test).
The first 100 older individuals evaluated in a public health center were selected to participate in this study. Exclusion criteria were: (1) Alcohol abuse or the presence of chronic renal failure; (2) volunteers with flu, colds, or any oral disease that would impair taste on the day of the experiment; (3) volunteers taking medications that might alter gustatory sensitivity such as chemotherapeutic drugs, penicillin, metronidazole hydrochloride, amphotericin, nortriptyline hydrochloride, carbamazepine, biguanide, etambutol, phenylbutazone, fluorouracil, allopurinol, penicillamine, or levodopa; (4) and volunteers who underwent radiotherapy of the head and/or cervical region.
After exclusions, and factoring individuals who refused to participate, the study was conducted in 56 older individuals aged 60 to 80 years, 30 of whom were hypertensive and under treatment and 26 of whom were normotensive (mean arterial pressure <140/90 mm Hg).
The study was approved by the ethics committee of the Public Health Center of the Ribeirão Preto Medical School, University of São Paulo (Protocol no. 464/CEP‐CSE‐FMRP‐USP; 09/11/2011) and met the guidelines of the responsible governmental agency. All volunteers gave written informed consent to participate. On the day of the experiment, general data of each volunteer were obtained using a semistructured questionnaire, including previous diagnoses and use of medications. Weight and height were measured and body mass index (BMI) was calculated for all participants. Urine was collected during the 24 hours preceding the experiment for the determination of urinary sodium by the ion selective electrode method. Sodium excreted during the 24‐hour period was used to estimate sodium consumption. A second 24‐hour urine collection was performed 2 weeks later for further determination of urinary sodium excretion. BP was measured with a semiautomatic instrument, with 3 measurements on the upper right limb and 3 measurements on the upper left limb after the patients rested in the sitting position for 5 minutes. The measurements were repeated after 2 weeks.
French bread rolls of the same composition except for different amounts of salt were prepared for the experiment. Salt (1.5%, 2.0%, and 2.7%) was added to each kg of dough since the French bread habitually sold in this community contains, on average, 2% salt in its composition. Therefore, we provided a sample of bread with less salt (1.5% salt; 25% less salt than ordinary bread), a sample with the usual percentage of salt (2.0%), and a sample of bread with higher salt (2.7% salt; 35% more salt than usual bread).The three bread samples were prepared on the day of the test and offered to the volunteers in a random manner in disposable paper bags coded with random 3‐digit numbers so that the investigator involved in the test would also be unaware of the salt content of each sample. For the tasting, the samples were tested from left to right with a standard size of 10 g to 15 g each in order to provide uniformity. Between each sample experienced, the patients drank mineral water at room temperature in order to help remove the taste.9 The test was always performed 2 hours after breakfast.
At the end of the test, the volunteers, who did not know that the bread samples contained different amounts of salt, were asked to state which sample they preferred.
Two weeks later, the volunteers participated in an experiment similar to the previous one in which they tasted samples of bread with the same salt contents (1.5%, 2.0%, and 2.7%), although this time the bread also contained oregano (0.23 g/100 g of bread) added to the dough. There were no medication changes in between the first and the second tests.
Statistical analysis
Data are reported as mean±standard deviation and were analyzed statistically by the Student t test, Fisher exact test, and McNamer's test. Differences were considered to be statistically significant when P<.05. The SAS system (version 9; SAS Institute, Cary, NC) was used for all statistical calculations.
Results
Groups 1 (n=32) and 2 (n=26) were of similar age (73.7±6.3 years and 71.5±8.0 years, P=.25), sex distribution (P=.19), prevalence of intake of alcoholic drinks (P=.55), and smoking habit (P=.45) (Table).
Table 1.
Characteristics and Clinical Data of Hypertensive (Group 1) and Normotensive (Group 2) Older Patients
| Group 1 (n=32) | Group 2 (n=26) | P Value | |
|---|---|---|---|
| Sex, No. (%) | |||
| Male | 9 (28.1) | 10 (38.5) | .29 |
| Female | 23 (71.9) | 16 (61.5) | |
| Use of alcohol, No. (%) | |||
| Yes | 8 (25) | 7 (26.9) | .55 |
| No | 24 (75) | 19 (73.1) | |
| Smoking habit, No. (%) | |||
| Yes | 0 (0) | 1 (3.8) | .45 |
| No | 32 (100) | 25 (96.2) | |
| Systolic BP, mm Hg | 135±16 | 126±11 | .02 |
| Diastolic BP, mm Hg | 80±10 | 76±6 | .11 |
| BMI, kg/m2 | 29.7±4.7 | 27.2±3.9 | .03 |
| UNaV, mEq/L | 177.3±62.4 | 131.0±38.4 | .002 |
Abbreviations: BP, blood pressure; BMI, body mass index; UnaV, 24‐hour urinary sodium excretion.
Mean systolic BP, BMI, and mean urinary sodium excretion were higher in patients in group 1 (Table). Group 1 also consisted of a larger number of volunteers with diabetes mellitus (40.6% vs 3.8%) and dyslipidemia (71.9% vs 11.5%) than group 2. In group 1, 86.7% of the patients used diuretics, 63% used angiotensin‐converting enzyme inhibitors or angiotensin II receptor antagonists, 27% used calcium channel antagonists, and 27% used β‐blockers. In group 2, there were no antihypertensive medications used.
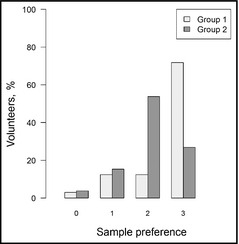
The preference for bread samples containing different amounts of salt differed between groups on the occasion of the first sensory evaluation, with more hypertensive patients choosing the saltiest sample as the best (P=.001; Figure 1).
Figure 1.

Distribution of the preference for samples of French bread in group 1 (hypertensive elderly patients) and group 2 (normotensive elderly patients) in the first test, without oregano. 0: did not perceive a difference; 1: preferred the sample with 1.5% salt; 2: preferred the sample with 2.0% salt; 3: preferred the sample with 2.7% salt.
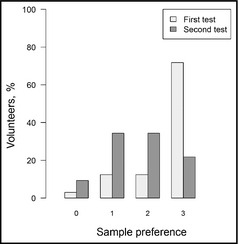
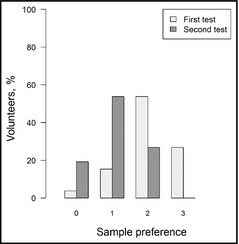
Comparison of the preference in the first and the second sensory evaluation for each study group revealed that with the introduction of the spice (oregano) in the bread there was a change in preference in both groups (P<.01), with a greater preference for less salty samples (Figure 2 and Figure 3).
Figure 2.

Distribution of the preference for samples of French bread in the first test (without oregano) and in the second (with oregano) in group 1 (hypertensive elderly patients). 0: did not perceive a difference; 1: preferred the sample with 1.5% salt; 2: preferred the sample with 2.0% salt; 3: preferred the sample with 2.7% salt.
Figure 3.

Distribution of the preference for samples of French bread in the first test (without oregano) and in the second (with oregano) in group 2 (normotensive elderly patients). 0: did not perceive a difference; 1: preferred the sample with 1.5% salt; 2: preferred the sample with 2.0% salt; 3: preferred the sample with 2.7% salt.
Discussion
Habitual salt intake estimated by higher 24‐hour urinary sodium excretion was greater among hypertensive patients, similar to findings from previous studies.3, 9, 10 The variation in salt intake among humans does not seem to be fundamentally influenced by ethnic or environmental factors, but may be determined by physiological hormonal factors such as the renin‐angiotensin system.11 It has been reported that the use of a diuretic, which activates the renin‐angiotensin system, may also be associated with greater salt intake,12 although the cited study did not state whether the volunteers were in equilibrium regarding sodium. In the present study it was not possible to exclude the influence of the use of diuretics, since only 13.3% of the volunteers did not use this medication. It has also been reported that the habitual salt content of the diet may interfere with gustatory sensitivity.13 If we consider hypertensive patients who habitually ingest large amounts of salt, it becomes difficult to assess whether a lower salt perception would lead to greater consumption or whether the greater consumption, which may have genetically determined bases, would favor a reduced gustatory sensitivity to salt.
Regarding the preference for saltier food, there was a clear difference between the hypertensive and normotensive groups, with the former more frequently choosing the bread sample containing 2.7% NaCl as the tastier bread. Paul and colleagues14 compared the preference of hypertensive patients for soup samples containing 3 different salt concentrations, with the patients showing a greater preference for the soup with the lowest salt content. However, all patients were hypertensive, with no comparison to a normotensive group. An extensive review15 that analyzed several studies concluded that there was no difference in salt preference between hypertensive and normotensive patients, but this review did not mention studies performed with older individuals.
A recent study showed the presence of an association between a report of greater salt preference and higher daily salt consumption,16 this possibly being a practical way to estimate individuals at higher risk. Another study confirmed the ability of students in identifying saltier meals.17
In the present study, the introduction of oregano led to a change in the pattern of choice of both the hypertensive and normotensive groups, with a greater option for samples containing less salt. Oregano has the advantage of being of low cost and easy to add to bread. We are not aware of previous salt preference studies that modified foods by adding spices.
Study Limitations
It is important to point out that in this study we did not check the adhesion to bread modified with the addition of oregano over time, with the need to test this model in order to confirm the benefit of this intervention. Another limitation of the present study is that the group of hypertensive patients contained a larger number of diabetic and dyslipidemic individuals than the normotensive group, a fact that may have influenced salt preference. However, we selected the patients based only on diagnosis of the presence or absence of hypertension and we know that this is the reality for the morbidity profile of hypertensive patients.
Previous studies have shown that salt preference was modified in patients given a low‐sodium diet,18, 19, 20 who developed a greater preference for lower salt content. On this basis, an intervention that reduces the salt content of diet, if maintained, may be of help in reducing general sodium consumption.
Conclusions
The present study demonstrated a greater salt preference among hypertensive elderly patients than among normotensive patients, with a greater habitual salt consumption. The intervention of adding oregano shifted the preference to less salty foods in both normotensive and hypertensive patients, possibly representing an auxiliary measure for the reduction of salt consumption for the prevention and nonpharmaceutical treatment of hypertension. A larger, longer, and randomized clinical trial is needed to confirm the benefits of an intervention of adding spice to the bread usually eaten.
Acknowledgments and disclosures
This study was supported by Ribeirão Preto Medical School – University of São Paulo. The authors have nothing to disclose.
J Clin Hypertens (Greenwich). 2014;16:587–590. ©2014 Wiley Periodicals, Inc.
References
- 1. Fallis N, Lasagna L, Tetreault L. Gustatory thresholds in patients with hypertension. Nature. 1962;196:74–75. [Google Scholar]
- 2. Bisht DB, Krishamurthy M, Rangaswamy R. Studies on threshold of taste for salt with special reference to hypertension. Indian Heart J. 1971;23:137–140. [PubMed] [Google Scholar]
- 3. Jan RA, Shah S, Saleem SM, et al. Sodium and potassium excretion in normotensive and hypertensive population in Kashmir. J Assoc Physicians India. 2006;54:22–26. [PubMed] [Google Scholar]
- 4. Intersalt Cooperative Research Group . Intersalt: an international study of electrolyte excretion and blood pressure. Results for 24 hour urinary sodium and potassium excretion. BMJ. 1988;297:319–328. [DOI] [PMC free article] [PubMed] [Google Scholar]
- 5. Murphy C, Whithee J. Age‐related diferences in the pleasantness of chemosensory stimuli. Pshycol Aging. 1986;1:312–318. [DOI] [PubMed] [Google Scholar]
- 6. Lauer RM, Filer LJ, Reiter MA, Clark WR. Blood pressure, salt preference, salt threshold and relative weight. Am J Dis Child. 1976;130:493–497. [DOI] [PubMed] [Google Scholar]
- 7. Mattes RM, Kumanyika SK, Halpern BP. Salt taste responsiveness and preference among normotensive, prehypertensive and hypertensive adults. Chem Senses. 1983;8:27–40. [Google Scholar]
- 8. Lima NK, Tozetto DJ, Lima LG, et al. Salt and insulin sensitivity after short and prolonged high salt intake in elderly subjects. Braz J Med Biol Res. 2009;42:738–743. [DOI] [PubMed] [Google Scholar]
- 9. Polónia J, Maldonado J, Ramos R, et al. Estimation of salt intake by urinary sodium excretion in a Portuguese adult population and its relationship to arterial stiffness. Rev Port Cardiol. 2006;25:801–817. [PubMed] [Google Scholar]
- 10. Perin MS, Cornélio ME, Rodrigues RC, Gallani MC. Characterization of salt consumption among hypertensives according to socio‐demographic and clinical factors. Rev Lat Am Enfermagem. 2013;21:1013–1021. [DOI] [PubMed] [Google Scholar]
- 11. McCarron DA, Kazaks AG, Geerling JC, et al. Normal range of human dietary sodium intake: a perspective study based on 24‐hour urinary sodium excretion worldwide. Am J Hypertens. 2013;26:1218–1223. [DOI] [PubMed] [Google Scholar]
- 12. Rock CL, Hall WD. Dietary salt intake increases with thiazide therapy. Am Fam Physician. 1978;17:207. [Google Scholar]
- 13. Bertino M, Beauchamp GK, Engelman K. Increasing dietary salt alters salt taste preference. Physiol Behav. 1986;38:203–213. [DOI] [PubMed] [Google Scholar]
- 14. Paul O. Discussion. In: Stamler J, Stamler R, Pullman TN, eds. Epidemiology of Hypertension. New York: Grune and Stratton. 1967;248–249. [Google Scholar]
- 15. Mattes RD. Salt taste and hypertension: a critical review of the literature. J Chronic Dis. 1984;37:195–208. [DOI] [PubMed] [Google Scholar]
- 16. Takachi R, Ishihara J, Iwasaki M, et al. Self‐reported taste preference can be a proxy for daily sodium intake in middle‐aged Japanese adults. J Acad Nutr Diet. 2014;114:781–787. [DOI] [PubMed] [Google Scholar]
- 17. Ahn S, Park S, Kim JN, et al. Salt content of school meals and comparison of perception related to sodium intake in elementary, middle, and high schools. Nutr Res Pract. 2013;7:59–65. [DOI] [PMC free article] [PubMed] [Google Scholar]
- 18. Bertino M, Beauchamp GK, Engelman K. Long‐term reduction in dietary sodium alters the taste of salt. Am J Clin Nutr. 1982;36:1134–1144. [DOI] [PubMed] [Google Scholar]
- 19. Mattes RD. The taste for salt in humans. Am J Clin Nutr. 1997;65(suppl):692S–697S. [DOI] [PubMed] [Google Scholar]
- 20. Kusaba T, Mori Y, Masami O, et al. Sodium restriction improves the gustatory threshold for salty taste in patients with chronic kidney disease. Kidney Int. 2009;76:638–643. [DOI] [PubMed] [Google Scholar]


