Supplemental digital content is available in the text.
Key Words: 3D-QALAS, compressed sensing, magnetic resonance imaging, parallel imaging, quantitative mapping, synthetic MRI
Abstract
Objectives
The aims of this study were to develop an accelerated multiparametric magnetic resonance imaging method based on 3D-quantification using an interleaved Look-Locker acquisition sequence with a T2 preparation pulse (3D-QALAS) combined with compressed sensing (CS) and to evaluate the effect of CS on the quantitative mapping, tissue segmentation, and quality of synthetic images.
Materials and Methods
A magnetic resonance imaging system phantom, containing multiple compartments with standardized T1, T2, and proton density (PD) values; 10 healthy volunteers; and 12 patients with multiple sclerosis were scanned using the 3D-QALAS sequence with and without CS and conventional contrast-weighted imaging. The scan times of 3D-QALAS with and without CS were 5:56 and 11:11, respectively. For healthy volunteers, brain volumetry and myelin estimation were performed based on the measured T1, T2, and PD. For patients with multiple sclerosis, the mean T1, T2, PD, and the amount of myelin in plaques and contralateral normal-appearing white matter (NAWM) were measured. Simple linear regression analysis and Bland-Altman analysis were performed for each metric obtained from the datasets with and without CS. To compare overall image quality and structural delineations on synthetic and conventional contrast-weighted images, case-control randomized reading sessions were performed by 2 neuroradiologists in a blinded manner.
Results
The linearity of both phantom and volunteer measurements in T1, T2, and PD values obtained with and without CS was very strong (R2 = 0.9901–1.000). The tissue segmentation obtained with and without CS also had high linearity (R2 = 0.987–0.999). The quantitative tissue values of the plaques and NAWM obtained with CS showed high linearity with those without CS (R2 = 0.967–1.000). There were no significant differences in overall image quality between synthetic contrast-weighted images obtained with and without CS (P = 0.17–0.99).
Conclusions
Multiparametric imaging of the whole brain based on 3D-QALAS can be accelerated using CS while preserving tissue quantitative values, tissue segmentation, and quality of synthetic images.
Quantitative magnetic resonance imaging (MRI) techniques allow objective rather than the current subjective evaluation.1 Simultaneous multiparametric mapping techniques provide tissue property maps, including T1 and T2 maps, in a single scan, and have attracted much attention owing to their high acquisition efficiency.2–4 Their clinical feasibility in the evaluation of the brain has been reported in many studies assessing and characterizing brain conditions, such as multiple sclerosis (MS) and brain tumors, as well as brain development.5–9 Rapid myelin estimation has also been developed on the basis of multiparametric mapping techniques.10,11 These techniques were validated on histology12,13 and compared with other myelin imaging techniques,14,15 and applied to diseases such as MS and Sturge-Weber syndrome.16,17 From the quantitative maps acquired in a single time-efficient scanning process, multiparametric mapping techniques have the potential to reduce the long MRI time by producing any of the contrast-weighted images, such as T1-weighted, T2-weighted, and fluid-attenuated inversion recovery (FLAIR) images.2
In recent years, there has been an increasing interest in improving the spatial resolution of multiparametric mapping techniques by acquiring the whole-brain data in 3D. One of these techniques, namely, 3D-quantification using an interleaved Look-Locker acquisition sequence with a T2 preparation pulse (3D-QALAS) sequence, has been applied to the brain and has demonstrated high repeatability and reproducibility both in vivo and in vitro.18–20 Compared with a 2D acquisition, a 3D acquisition enables thinner slices, which are contiguous and more amenable to interpolation in the slice direction. Furthermore, a 3D acquisition with isotropic resolution would allow visualization of the subject from any orientation, enabling improved depiction of structures and characterization of the pathologies. Despite their potential, current 3D quantitative imaging techniques require long acquisition times, thereby limiting its clinical use.
Compressed sensing (CS) is an acceleration technique that reconstructs images from subsampled data by leveraging the sparsity of the image.21 Using incoherently undersampled k-space data, CS accelerates image acquisition by reducing the amount of data acquired and filling in unacquired data points in a manner that minimizes the incoherent artifacts. Generally, CS and 3D acquisitions are highly compatible owing to the compressibility of the volume data and the increased incoherence offered in the added spatial dimension. It has been observed previously that utilization of CS in combination with parallel imaging (PI), another acceleration technique, could achieve a higher acceleration rate than application of either method alone,22 while preserving the quality of 3D MRI scans.23–27 However, the effects of CS on quantitative values obtained with multiparametric mapping techniques, including 3D-QALAS, have been largely unexplored.28–30
This study aimed to propose an application of CS combined with PI to the 3D-QALAS sequence, a multiparametric mapping technique, to enable the whole-brain 1-mm isotropic T1, T2, and proton density (PD) quantification and myelin estimation within a span of 6 minutes. We assessed whether an accelerated acquisition could allow reliable T1, T2, and PD quantification and myelin estimation while maintaining the quality of the contrast-weighted images. Furthermore, we also compared 3D-QALAS with and without CS and conventional contrast-weighted images in patients with MS for assessing lesion quantitative values and diagnostic image quality.
MATERIALS AND METHODS
Magnetic Resonance Imaging Settings
We implemented an acceleration technique that serially combined CS and data-driven PI to 3D-QALAS according to the procedure proposed by King et al.31,32 The overview of the procedure is illustrated in Supplemental Digital Content Figure 1, http://links.lww.com/RLI/A587 showing a reconstruction based on the serial combination of CS and PI. K-space data were first undersampled in a Gaussian random distribution outside of a fully sampled small area around the center of the k-space. The standard deviation of the Gaussian random distribution was set to 0.28, which was determined empirically. The unacquired points in this step were filled with CS reconstruction to restore uniformly undersampled k-space data. This CS reconstruction was performed on each channel of the coil, based on a total variation sparsifying transform and an iterative nonlinear conjugate gradient method described by Lustig et al.21 The image from the undersampled k-space data was reconstructed by using the following formula:
where is the reconstructed image, Ψ is sparsifying transform, m is all the pixel values, y is the acquired k-space data samples, E is coil and gradient encoding, and ε is noise standard deviation in y controlling the fidelity of the reconstruction to the measured data. The maximum number of CS iteration was set to 10. Finally, PI reconstruction based on the Autocalibrating Reconstruction for Cartesian imaging method33 restored the rest of the k-space on each coil channel, followed by fast Fourier transform and sum of squares reconstruction.
A 3-T scanner (Discovery 750w; GE Healthcare, Waukesha, WI) with a 32-channel head coil was utilized for image acquisition in the standardized phantom and all the human subjects. To evaluate the effects of CS on quantitative mapping and tissue segmentation, we have acquired 3D-QALAS with and without CS for each subject. The sequence used a Look-Locker inversion acquisition-based technique with acquisition parameters shown in Table 1. The imaging parameters were all identical between the 2 acquisitions, except for the incorporation of CS acceleration with an undersampling factor of 1.9, corresponding to 53% of the full k-space points. The scan times for the 3D-QALAS sequence with and without CS were 5:56 and 11:11, respectively. For patient data acquisition, we additionally acquired conventional T1-weighted, T2-weighted, and FLAIR images for comparison of diagnostic image quality (Table 1).
TABLE 1.
Sequence Parameters for 3D-QALAS With CS, 3D-QALAS Without CS, and Conventional Imaging
| 3D-QALAS | Conventional | ||||
|---|---|---|---|---|---|
| Parameter | With CS | Without CS | T1WI | T2WI | FLAIR |
| Acquisition dimension | 3D | 3D | 3D | 2D | 2D |
| Acquisition plane | Axial | Axial | Axial | Axial | |
| Repetition time, ms | 8.6 | 7.7 | 4500 | 9000 | |
| Echo time, ms | 3.5 | 3.1 | 122.3 | 120 | |
| Flip angle, degree | 4 | 11 | — | — | |
| Bandwidth, Hz/pixel | 244.1 | 244.1 | 162.8 | 195.3 | |
| Field of view, mm | 256 × 205 × 146 | 256 × 218 | 240 × 240 | 240 × 240 | |
| Matrix | 256 × 205 × 146 | 256 × 218 | 320 × 224 | 320 × 224 | |
| Interpolated matrix | 512 × 410 × 292 | 256 × 218 | 320 × 224 | 320 × 224 | |
| Slice thickness, mm | 1 (0.5)* | 1 (0.5)* | 4 | 4 | |
| Slice gap, mm | — | — | 1 | 1 | |
| Parallel imaging (ARC) | 2 × 1 | 2 × 1 | 2 × 1 | 2 × 1 | |
| Compressed sensing | 1.9 | — | — | — | — |
| Acquisition time | 5:56 | 11:11 | 5:45 | 2:06 | 2:33 |
*Slice thicknesses after zero-fill interpolation.
3D-QALAS, 3D-quantification using an interleaved Look-Locker acquisition sequence with a T2 preparation pulse; ARC, Autocalibrating Reconstruction for Cartesian imaging; CS, compressed sensing; FLAIR, fluid-attenuated inversion recovery images; T1WI, T1-weighted imaging; T2WI, T2-weighted imaging.
Phantom Study
A standardized NIST/ISMRM (National Institute of Standards and Technology/International Society for Magnetic Resonance in Medicine) system phantom (High Precision Devices, Inc, Boulder, CO) with 3 layers of sphere arrays was designed to assess a range of specific T1, T2, and PD values (Supplemental Digital Content Table 1, http://links.lww.com/RLI/A587).34 Each sphere was filled with either NiCl2 or MnCl2 doped water. Over a period of 1 month, this phantom was scanned 10 times on different days. Moreover, to minimize the effects of motion on the measurements, the phantom was positioned 30 minutes before commencement of each scan. The images produced by 3D-QALAS sequences were postprocessed using a prototype version 0.45.5 of SyMRI software (SyntheticMR, Linköping, Sweden) to generate T1, T2, and PD maps. A spherical volume of interest (VOI) was manually placed at the center of each sphere on the T1, T2, and PD maps, and the respective mean values were recorded. To minimize the effects of the artifacts near the edge of the sphere, the spherical VOI was set to 10-mm diameter within each sphere with an inner diameter of 15 mm.
In Vivo Quantitative Assessment
This study was approved by the local institutional review board. Ten healthy volunteers (7 men, 3 women; mean age ± standard deviation, 29.7 ± 4.7 years) and 12 patients with relapsing-remitting MS (1 man, 11 women; 42.3 ± 10.9 years) diagnosed using the McDonald criteria35 were included in the study. Patient characteristics were as follows: disease duration, 11.3 ± 7.8 years; and median Expanded Disability Status Scale score, 1.0 (range, 0–4.5). Written informed consent was obtained from all the study participants. In addition to T1, T2, and PD maps as described in the phantom study, SyMRI software was used to create myelin volume fraction (MVF) maps for each human subject based on a 4-compartment model.10 To compare the quantitative T1, T2, PD, and MVF values in vivo, quantitative maps that were derived from 3D-QALAS with and without CS were compared by adopting semiautomated VOI analyses proposed by Hagiwara et al.36 In brief, 16 VOIs were automatically created in the Montreal Neurological Institute space and registered to each subject's space using the FMRIB Software Library (http://fsl.fmrib.ox.ac.uk/fsl/fslwiki/FSL).37 Of the 16 VOIs, 8 were gray matter (frontal, parietal, temporal and occipital GM, insula, caudate, putamen, and thalamus) and 8 were white matter (frontal, parietal, temporal, and occipital WM, genu and splenium of the corpus callosum, internal capsules, and middle cerebellar peduncles). Circular ROIs with a diameter of 5 mm were manually placed by a neuroradiologist with 6 years of experience (S.F.) in the anterior horns of the lateral ventricles. The ROIs were carefully placed so as not to include the brain parenchyma or the choroid plexus. To topologically show the differences in T1, T2, and PD values obtained with and without CS, the difference divided by their mean on a group level in the Montreal Neurological Institute space was calculated in a voxelwise manner.
For 3D-QALAS data with and without CS, voxelwise T1, T2, and PD values were used to derive the following tissue fraction maps: WM, white matter; GM, gray matter; and CSF, cerebrospinal fluid fraction maps.38 By integrating the tissue fraction maps across all voxels, the following tissue volumes were calculated: WM volume, GM volume, CSF volume, myelin volume, and intracranial volume. The effects of CS on the tissue fraction maps obtained with 3D-QALAS were evaluated by comparing those obtained with and without CS.
To compare the quantitative values of the plaques and normal-appearing white matter (NAWM) of MS patients obtained with and without CS, VOI analysis was performed. A neuroradiologist (S.F.) identified plaques that were larger than 5 mm in diameter using all the available images. A spherical VOI with 4-mm diameter was placed on each plaque and contralateral NAWM to measure the mean T1, T2, PD, and MVF values (see Supplemental Digital Content Figure 2, http://links.lww.com/RLI/A587, an example of spherical VOI placement in a patient with MS).
In Vivo Qualitative Assessment
To evaluate the effects of CS on image quality, all patient images were blinded and independently assessed by 2 neuroradiologists (C.A. and S.K.) with 10 and 6 years of experience, respectively. The evaluation was performed with at least 4 weeks of washout period between reading sessions to minimize the recall bias. The images were presented in a random order in 3 sessions during which each reader was presented only once with each case per session from one of the following 3 datasets: 3D-QALAS with CS, 3D-QALAS without CS, and conventional contrast-weighted image dataset. For 3D-QALAS datasets, the following contrast-weighted images were generated using SyMRI software: T1WI, T1-weighted images; T2WI, T2-weighted images; FLAIR, fluid-attenuated inversion recovery images; DIR, double-inversion recovery images; and PSIR, phase-sensitive inversion recovery images. TR, TE, and TI used for image synthesis were virtually set as follows: T1WI, 650/10/− milliseconds; T2WI, 4500/100/− milliseconds; FLAIR, 15,000/75/3000 milliseconds; DIR, 15,000/100/3600 milliseconds; and PSIR, 6000/10/500 milliseconds, respectively. The conventional contrast-weighted image dataset consisted only of T1WI, T2WI, and FLAIR images.
For each contrast-weighted view, the overall image quality and visibility of brain structures (how easily the margins and structures of an anatomic region can be detected) were rated on a 5-point Likert scale, which was defined as follows: 1, unacceptable; 2, poor; 3, acceptable; 4, good; and 5, excellent. The structures included the central sulcus, head of the caudate nucleus, posterior limb of the internal capsule, cerebral peduncle, and middle cerebellar peduncle.39 Conspicuity of plaques was also rated by using the same 5-point Likert scale. Further, readers recorded whether any of the following artifacts were present in each image: truncation and ringing artifacts, motion artifacts, aliasing artifacts, chemical shift artifacts, and any other artifacts (eg, spike noise, banding, and blurring).40 Readers were provided with a free text column to record any other observations.
Statistical Analysis
All statistical analyses were performed on R program version 3.5.1 (R Core Team [2018], R).41 Simple linear regression analyses were performed for each quantitative metric obtained from the datasets with and without CS. A Bland-Altman analysis was performed to assess the agreement and biases between the metrics derived from 3D-QALAS with and without CS. Agreement of categorical data between readers was assessed using Kendall's coefficient of concordance. The overall image quality and structural delineations for each contrast-weighted image were compared among 3D-QALAS with and without CS and conventional images using the pairwise Dunn-Bonferroni post hoc test when there were significant differences in the Friedman test. Agreement of overall image quality between 3D-QALAS with and without CS was assessed using Kendall's coefficient of concordance. A P value of less than 0.05 was considered statistically significant.
RESULTS
Phantom Study
The temperature of the phantom immediately after the scan was 19.6°C ± 0.4°C. The T1, T2, and PD values that were measured using the data acquired with CS showed strong linear associations with the values acquired without CS (R2 = 0.999, 0.993, and 0.996, respectively; see Supplemental Digital Content Figure 3, http://links.lww.com/RLI/A587: Scatterplots and Bland-Altman plots comparing T1, T2, and PD values). The linear fits had slopes of 0.99 for T1, 0.90 for T2, and 1.0 for PD, and the intercepts were 8.3 milliseconds for T1, 15.2 milliseconds for T2, and −0.1% for PD. The mean biases for T1, T2, and PD were −3.3 milliseconds, 9.6 milliseconds, and −0.3%, respectively. The 95% agreement limits for T1, T2, and PD were −30.0 milliseconds to 23.5 milliseconds, −114.5 milliseconds to 133 milliseconds, and −2.5% to 1.9%, respectively.
In Vivo Quantitative Assessment
Figure 1 shows representative T1, T2, and PD maps and tissue fraction maps of the brain obtained from a healthy volunteer using 3D-QALAS with and without CS. The relative difference of T1, T2, and PD values obtained with and without CS are shown in Figure 2. The difference was very small on the brain parenchyma, whereas T2 values on the brain surface tended to be smaller when using CS. Representative quantitative maps, tissue fraction maps, and contrast-weighted images of an MS patient created from data acquired by 3D-QALAS with CS are shown in Figure 3. Figure 4 summarizes the agreement of the T1, T2, PD, and MVF values between the data acquired with and without CS in different brain regions. The linearity of measurements in T1, T2, PD, and MVF values obtained with and without CS were very strong (R2 = 0.990–0.998). The T1, T2, and PD values of the CSF with CS were 4216 ± 45.6 milliseconds, 1997 ± 7.3 milliseconds, and 101% ± 3.2%, respectively, whereas the mean T1, T2, and PD without CS were 4181 ± 36.0 milliseconds, 1998 ± 3.9 milliseconds, and 98.2 ± 2.9, respectively. Figure 5 shows the agreement of the tissue fraction volumes that were calculated using 3D-QALAS with and without CS. The tissue segmentation obtained with and without CS also showed a high linearity (R2 = 0.987–0.999).
FIGURE 1.
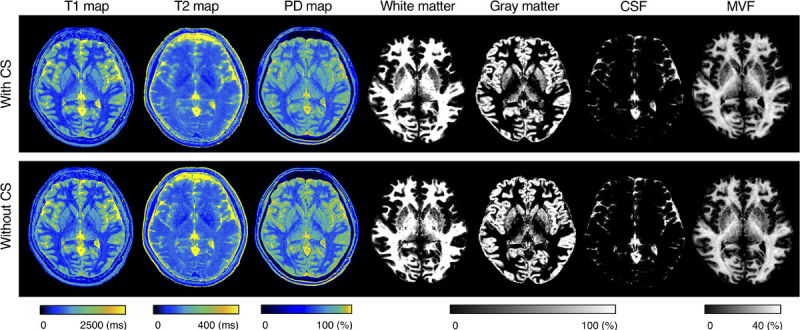
Representative quantification maps and tissue fraction maps of a healthy volunteer. Axial images of T1, T2, and PD maps, and segmentation results for white matter, gray matter, cerebrospinal fluid, and myelin volume fraction. Minimal differences are observed between the maps obtained with and without CS. PD, proton density; CSF, cerebrospinal fluid; MVF, myelin volume fraction; CS, compressed sensing.
FIGURE 2.
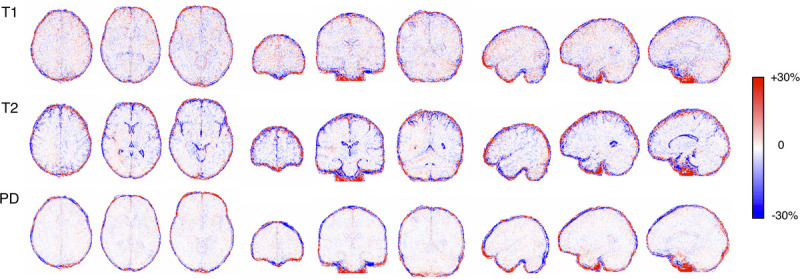
Images show relative differences in T1, T2, and PD values between with and without CS. Maps were calculated by subtraction (quantitative values acquired with CS minus those without) divided by their mean on a group level. Different metrics (rows) and sections (columns) are shown. Red and blue indicates larger and smaller value with CS than without, respectively.
FIGURE 3.
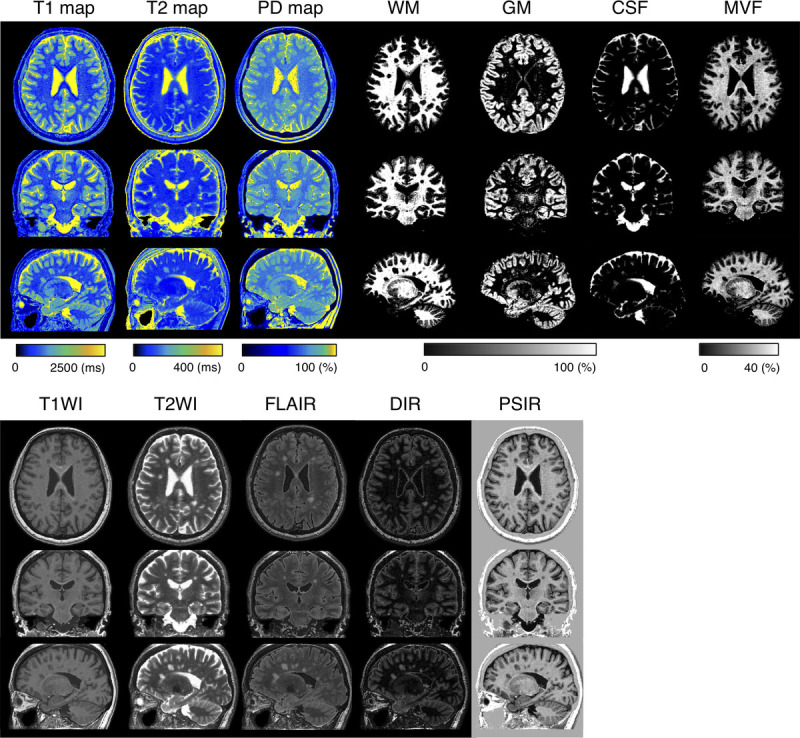
Representative quantitative maps, tissue fraction maps, and contrast-weighted images of a multiple sclerosis patient created from data acquired by 3D-QALAS with CS. All images are reformatted in 3 directions. Note that all of these maps are acquired in a single scan. WM, white matter; GM, gray matter; CSF, cerebrospinal fluid; MVF, myelin volume fraction; T1WI, T1-weighted images; T2WI, T2-weighted images; FLAIR, fluid-attenuated inversion recovery images; DIR, double-inversion recovery images; and PSIR, phase-sensitive inversion recovery images.
FIGURE 4.
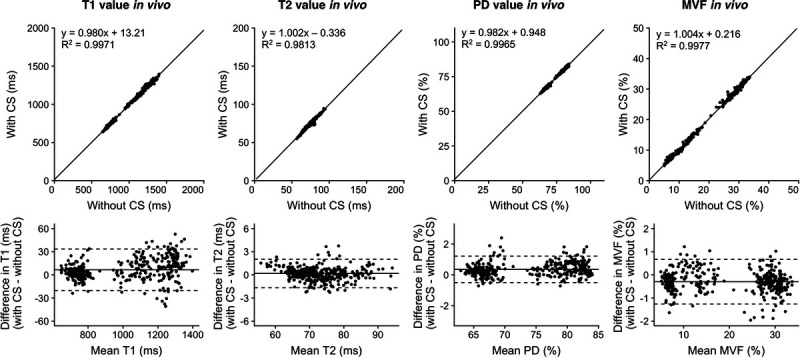
Scatterplots and Bland-Altman plots comparing T1, T2, PD, and MVF values of 16 brain regions of 10 volunteers and 12 patients with MS, which were calculated from 3D-QALAS with CS compared with those calculated without CS. Solid black lines in the scatterplots represent the linear regression fit, and the center solid lines in the Bland-Altman plots represent mean differences. The upper and lower dotted lines represent the agreement limit, which was defined as the mean difference ± 1.96 × SD of the difference between the values acquired with and without CS. SD, standard deviation. PD, proton density; MVF, myelin volume fraction.
FIGURE 5.
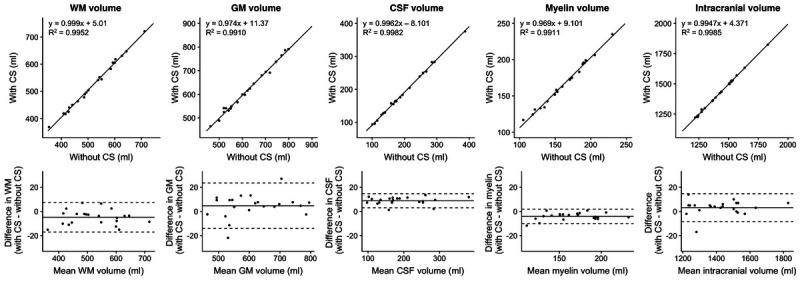
Scatterplots and Bland-Altman plots comparing GM, WM, CSF, myelin, and intracranial volumes of 10 volunteers and 12 patients with MS, calculated from 3D-QALAS acquired with and without CS. The center solid lines in the Bland-Altman plots represent mean differences, whereas the upper and lower dotted lines represent the limit of agreement, which is defined as the mean difference ± 1.96 × SD of the difference between the values acquired with and without CS. SD, standard deviation, WM, white matter; GM, gray matter; CSF, cerebrospinal fluid.
A total of 140 plaques were analyzed in 12 patients with MS. Supplemental Digital Content Figure 4, http://links.lww.com/RLI/A587 shows 3D scatterplots comparing the quantitative properties of the plaques and NAWM; a clear differentiation of the plaques and NAWM using quantitative values was observed regardless of the application of CS. Figure 6 shows the linearity and biases of T1, T2, and PD values of the plaques evaluated from the images obtained with and without CS. The quantitative tissue values of the plaques and NAWM obtained with CS showed a high linearity with those obtained without CS (R2 = 0.967–1.000).
FIGURE 6.
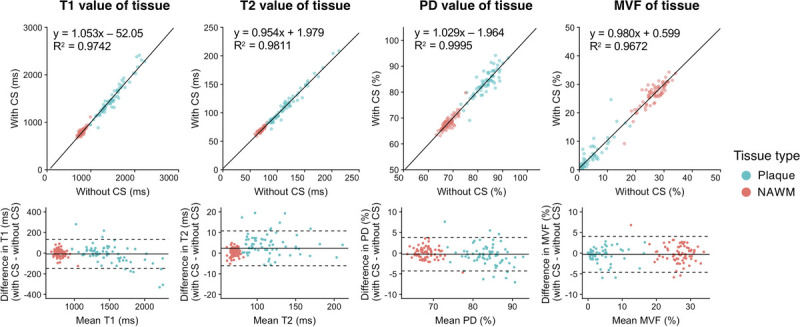
Scatterplots and Bland-Altman plots comparing T1, T2, and PD values of plaques and NAWM calculated from 3D-QALAS acquired with and without CS. The solid black lines in the scatterplots represent the linear regression fit, and the center solid lines of the Bland-Altman plots represent mean differences. The dotted lines represent the agreement limit, which was defined as the mean difference ± 1.96 × SD of the difference between the measurements with and without CS. SD, standard deviation; CS, compressed sensing; PD, proton density; MVF, myelin volume fraction; NAWM, normal-appearing white matter.
In Vivo Qualitative Assessment
Representative examples of synthetic contrast-weighted images of 3D-QALAS with and without CS are presented in Figure 7. Another representative case of MS is presented in Supplemental Digital Content Figure 5, http://links.lww.com/RLI/A587 (a representative example of a patient with MS shown in reformatted sagittal views). Because the interrater agreement between the 2 readers was high, with Kendall's coefficient of concordance of 0.82, the pooled overall image quality and structural delineation, that is, the results of the 2 readers, were simultaneously used for further analysis. Figure 8 shows the overall image quality and structural delineation of contrast-weighted images scored on a 5-point Likert scale. On Friedman test, there was no significant difference in the overall image quality of T1WI among the examined datasets (ie, 3D-QALAS with CS, 3D-QALAS without CS, and conventional contrast-weighted images) (P = 0.17). Pairwise Dunn-Bonferroni post hoc test revealed that the overall image quality of the synthetic images acquired with T2WI and FLAIR sequences, with and without CS, was significantly lower than that of the conventional images (P < 0.001). No significant differences were present between the synthetic images with and without CS for all contrast weightings (P values for T2WI, FLAIR, DIR, and PSIR were 0.53, 0.98, 0.99, and 0.99, respectively). Overall image quality between 3D-QALAS with and without CS across all contrast-weighted images showed high agreement with Kendall's coefficient of concordance of 0.83. Among the target structures examined, there were no significant differences between contrast-weighted images acquired with and without CS for all contrast weightings.
FIGURE 7.
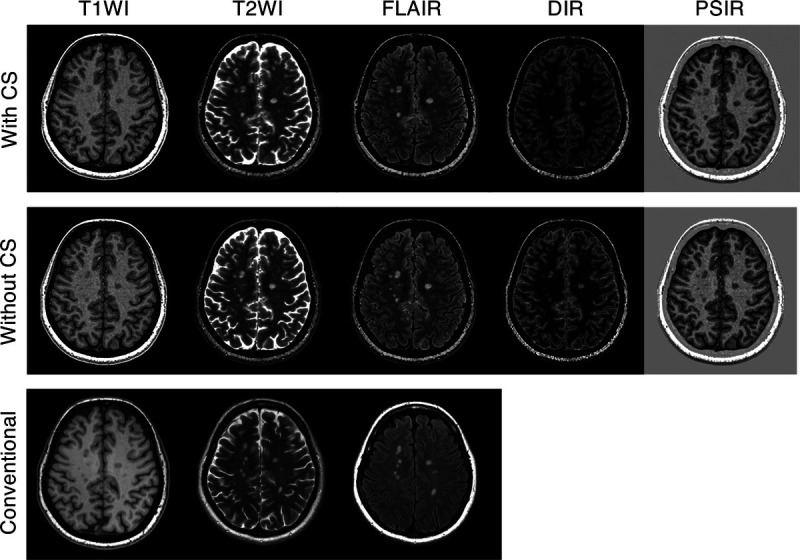
Representative contrast-weighted images of a multiple sclerosis patient. Minimal differences are seen between the contrast-weighted images that were obtained with and without CS. CS, compressed sensing; T1WI, T1-weighted images; T2WI, T2-weighted images; FLAIR, fluid-attenuated inversion recovery images; DIR, double-inversion recovery images; and PSIR, phase-sensitive inversion recovery images.
FIGURE 8.
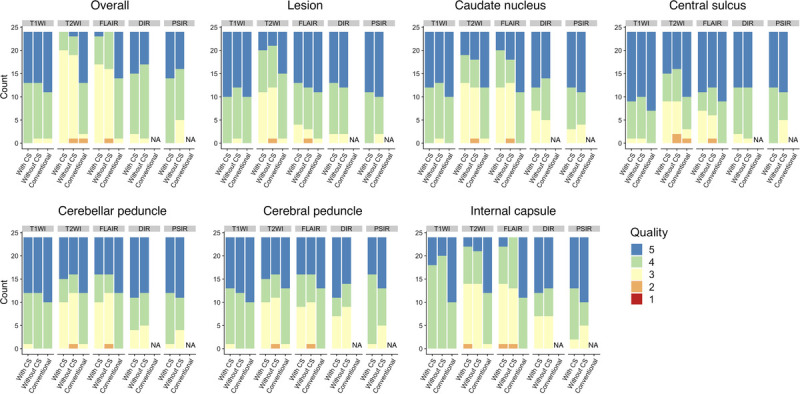
Visual assessment of contrast-weighted images generated from 3D-QALAS with and without CS and conventional imaging for patients with multiple sclerosis. Overall image quality and structural delineation scored on a 5-point Likert score by 2 neuroradiologists are shown. T1WI, T1-weighted images; T2WI, T2-weighted images; FLAIR, fluid-attenuated inversion recovery images; DIR, double-inversion recovery images; and PSIR, phase-sensitive inversion recovery images; NA, not applicable.
Truncation artifacts were seen in 4.2% (3/72) of the conventional contrast-weighted images, 5% (3/60) of 3D-QALAS–acquired images with CS, and 3.3% (2/60) of 3D-QALAS–acquired images without CS. Parenchymal-CSF interface hyperintensities39,42,43 were found in 8.3% (5/60) of the 3D-QALAS–acquired images with CS and without CS (8.3%; 5/60). None of the images exhibited a global ringing artifact, which is known to be associated with CS.44 No artifacts were noted in conventional contrast-weighted images.
DISCUSSION
The long acquisition times of quantitative MRI have made the procedure suboptimal for routine clinical practice. Although faster imaging is desirable, assuring reproducible quantitative values and sufficient image quality is a prerequisite for utilization in clinical settings.45 Hence, to address both these issues and evaluate the performance of quantitative MRI, we have implemented CS acceleration for high spatial resolution multiparametric imaging by 3D-QALAS; we also assessed the quantitative values and tissue segmentation performance with and without CS acceleration. The accelerated acquisition protocol of 3D-QALAS with CS enabled isotropic, 1-mm, multiparametric imaging of the whole brain in less than 6 minutes, while maintaining the tissue quantitative values and segmentation quality. This technology can alleviate the problem of long MRI scanning times and provide objective information of the brain to supplement the contrast-weighted imaging commonly used in clinical settings.
The relaxometry parameters and tissue volumes obtained with 3D-QALAS with and without CS showed a high agreement with both in vitro and in vivo settings. The bias caused by the presence or absence of CS was estimated to be approximately 0.99% (mean difference of 9.9 milliseconds divided by 1000 milliseconds), 0.24% (mean difference of 0.19 milliseconds divided by 80 milliseconds), 0.49% (mean difference of 0.34% divided by 70%), and −1.7% (mean difference of −0.33% divided by 20%) for T1, T2, PD, and MVF, respectively, which is sufficiently small. The robustness of the quantitative value could be attributed to the fact that the center of the k-space, which dominates the contrast, was fully sampled. Acceleration with CS was effective for high-resolution imaging with 3D-QALAS, partly because the proportion of high-frequency components, which have a high undersampling ratio, increases as the resolution increases. Although only small differences were observed between values obtained with and without CS, the differences in T2 were noticeable on brain surfaces and ventricular walls. This may be due to partial volume effects: the T2 value was forcefully calculated using Bloch equation supposing a monoexponential behavior, but the relaxation behavior in these regions is expected to be multiexponential.
The overall image quality of contrast-weighted images acquired with 3D-QALAS in patients was maintained with the combination of CS. However, the image quality of the synthetic T2-weighted and FLAIR images, either with and without CS, was inferior than the corresponding conventional images. This difference in image quality has been observed in published literature,39,42 whereas another study applied deep learning to improve the image quality of synthetic FLAIR images.43 It may be possible to reduce artifacts by creating synthetic contrast-weighted images directly from the original source images, bypassing the quantitative maps.46 In the current study, parenchymal-CSF interface hyperintensities were observed in both synthetic FLAIR images with and without CS. Although this artifact did not affect the delineation of MS plaques (P = 0.33), it may mimic certain pathologies involving the meninges, such as subarachnoid hemorrhage and meningitis. Although this artifact was readily recognizable by its distinctive appearance and by confirming the lack of such artifact on other contrast-weighted images, additional imaging of conventional FLAIR may be still desirable. The partial volume effect may explain the reason for lower P values when comparing the T2-weighted images obtained with and without CS than other contrast-weighted images. Although there were no indications that the application of CS made lesions less visible in the reading sessions, the appearance may be slightly different for T2WI and should be interpreted with caution.
Scan time reduction with CS may enable the incorporation of high spatial resolution multiparametric imaging in routine clinical settings. The rapid acquisition of relaxometry parameters in 6 minutes is comparable to our routine 3D T1WI structural imaging protocol, which requires 4 to 5 minutes. This approach could be particularly effective for pediatric and preoperative imaging, wherein multiple contrast images are needed in a short time.
Traditionally, visual and quantitative assessments have required independent scans, resulting in very long examination times, making them difficult to use simultaneously in clinical practice. The present study showed that 3D-QALAS combined with CS provides information required for both visual and quantitative assessment. For example, scan times for MS lesions and other lesions would be shorter, allowing for more objective clinical management.
The inherent alignment of the maps is a significant advantage of multiparametric mapping techniques. It has been shown that brain segmentation with synthetic T1WI strongly agrees with image segmentation obtained with conventional 3D T1WI.19 Reliable morphometry metrics with relaxometry parameters would translate this segmentation to reliable VOI data to detect small differences in local tissues; this will further pave the way for combined evaluation of morphometric and quantitative values.47 Further, image postprocessing, including deep learning, could be performed without the need for image resampling or registration.43,48 However, simultaneous acquisition of spin parameter maps could also be problematic because all the maps would be degraded if motion corruption occurs at any point during the acquisition. To mitigate this complication, current developments in motion detection or correction49 could be incorporated into the 3D-QALAS technique in the future, in addition to the further acceleration of acquisition time.
The generalizability of our study results is subject to certain limitations. For instance, we did not compare CS to a standard PI technique, and we have used a fixed undersampling factor in this study. This was chosen based on a preliminary study with a phantom. Although a study that iterates multiple undersampling factors by small steps to explore the highest undersampling factor with tolerable degradation in quantitative values and image quality would be of tremendous interest from the point of view of engineering, it was not feasible to perform such a study on human subjects. Second, the phantom measurements were not verified by conventional quantitative mapping methods, such as variable flip angle gradient echo scan and Carr-Purcell-Meiboom-Gill sequence. Third, this study only included a single group of patients with MS. Relatively young adults, in whom MS is frequently seen, tend to be cooperative during MRI examinations. The results may not be generalizable to patients with other movement disorders and to older patients who may not be cooperative during MRI examinations. Hence, to mimic actual clinical scenarios, inclusion and evaluation of patients with movement disorders and elderly patients may further demonstrate the effectiveness of applying CS to 3D-QALAS.
In conclusion, isotropic 1-mm multiparametric imaging of the whole brain based on 3D-QALAS can be performed in less than 6 minutes using CS, while preserving tissue quantitative values, tissue segmentation, and contrast-weighted image quality. The image quality of T2WI and FLAIR was inferior to that of conventional contrast-weighted images, and additional conventional imaging may be selected. This technique would further facilitate the use of quantitative imaging in actual clinical settings.
Supplementary Material
ACKNOWLEDGMENTS
The authors acknowledge Takuya Haruyama and Yuma Nishimura who were helpful with data handling.
Footnotes
Conflicts of interest and sources of funding: N.T. is an employee of GE Healthcare Japan. This work was supported by Japan Agency for Medical Research and Development under grant number JP19lk1010025h9902; JSPS KAKENHI grant numbers 19K17150, 19K17177, 18H02772, and 18K07692; Health, Labor and Welfare Policy Research Grants for Research on Region Medical; and a grant-in-aid for special research in subsidies for ordinary expenses of private schools from The Promotion and Mutual Aid Corporation for Private Schools of Japan; Brain/MINDS beyond program from Japan Agency for Medical Research and Development grant numbers JP19dm0307024 and JP19dm0307101.
Supplemental digital contents are available for this article. Direct URL citations appear in the printed text and are provided in the HTML and PDF versions of this article on the journal’s Web site (www.investigativeradiology.com).
Contributor Information
Shohei Fujita, Email: shifujita-tky@umin.ac.jp.
Naoyuki Takei, Email: NAOYUKI.TAKEI@ge.com.
Ken-Pin Hwang, Email: khwang@mdanderson.org.
Issei Fukunaga, Email: Fukunaga.
Shimpei Kato, Email: s.kato.cy@juntendo.ac.jp.
Christina Andica, Email: andicach@gmail.com.
Koji Kamagata, Email: kkamagat@juntendo.ac.jp.
Kazumasa Yokoyama, Email: kazumasa@juntendo.ac.jp.
Nobutaka Hattori, Email: nhattori@juntendo.ac.jp.
Osamu Abe, Email: abediag-tky@umin.ac.jp.
Shigeki Aoki, Email: saoki@juntendo.ac.jp.
REFERENCES
- 1.Tofts P. Quantitative MRI of the Brain: Measuring Changes Caused by Disease. Chichester, West Sussex; Hoboken, NJ: Wiley; 2003. [Google Scholar]
- 2.Warntjes JB Leinhard OD West J, et al. Rapid magnetic resonance quantification on the brain: optimization for clinical usage. Magn Reson Med. 2008;60:320–329. [DOI] [PubMed] [Google Scholar]
- 3.Hagiwara A Warntjes M Hori M, et al. SyMRI of the brain: rapid quantification of relaxation rates and proton density, with synthetic MRI, automatic brain segmentation, and myelin measurement. Invest Radiol. 2017;52:647–657. [DOI] [PMC free article] [PubMed] [Google Scholar]
- 4.Ma D Gulani V Seiberlich N, et al. Magnetic resonance fingerprinting. Nature. 2013;495:187–192. [DOI] [PMC free article] [PubMed] [Google Scholar]
- 5.Blystad I Warntjes JBM Smedby O, et al. Quantitative MRI for analysis of peritumoral edema in malignant gliomas. PLoS One. 2017;12:e0177135. [DOI] [PMC free article] [PubMed] [Google Scholar]
- 6.Lee SM Choi YH You SK, et al. Age-related changes in tissue value properties in children: simultaneous quantification of relaxation times and proton density using synthetic magnetic resonance imaging. Invest Radiol. 2018;53:236–245. [DOI] [PubMed] [Google Scholar]
- 7.Hagiwara A Hori M Yokoyama K, et al. Utility of a multiparametric quantitative MRI model that assesses myelin and edema for evaluating plaques, periplaque white matter, and normal-appearing white matter in patients with multiple sclerosis: a feasibility study. AJNR Am J Neuroradiol. 2017;38:237–242. [DOI] [PMC free article] [PubMed] [Google Scholar]
- 8.Badve C Yu A Dastmalchian S, et al. MR fingerprinting of adult brain tumors: initial experience. AJNR Am J Neuroradiol. 2017;38:492–499. [DOI] [PMC free article] [PubMed] [Google Scholar]
- 9.Fujita S Nakazawa M Hagiwara A, et al. Estimation of gadolinium-based contrast agent concentration using quantitative synthetic MRI and its application to brain metastases: a feasibility study. Magn Reson Med Sci. 2019;18:260–264. [DOI] [PMC free article] [PubMed] [Google Scholar]
- 10.Warntjes M Engström M Tisell A, et al. Modeling the presence of myelin and edema in the brain based on multi-parametric quantitative MRI. Front Neurol. 2016;7:16. [DOI] [PMC free article] [PubMed] [Google Scholar]
- 11.Chen Y Chen MH Baluyot KR, et al. MR fingerprinting enables quantitative measures of brain tissue relaxation times and myelin water fraction in the first five years of life. Neuroimage. 2019;186:782–793. [DOI] [PubMed] [Google Scholar]
- 12.Warntjes JBM Persson A Berge J, et al. Myelin detection using rapid quantitative MR imaging correlated to macroscopically registered luxol fast blue-stained brain specimens. AJNR Am J Neuroradiol. 2017;38:1096–1102. [DOI] [PMC free article] [PubMed] [Google Scholar]
- 13.Ouellette R Mangeat G Polyak I, et al. Validation of rapid magnetic resonance myelin imaging in multiple sclerosis. Ann Neurol. 2020;87:710–724. [DOI] [PubMed] [Google Scholar]
- 14.Saccenti L Hagiwara A Andica C, et al. Myelin measurement using quantitative magnetic resonance imaging: a correlation study comparing various imaging techniques in patients with multiple sclerosis. Cell. 2020;9:393. [DOI] [PMC free article] [PubMed] [Google Scholar]
- 15.Hagiwara A Hori M Kamagata K, et al. Myelin measurement: comparison between simultaneous tissue relaxometry, magnetization transfer saturation index, and T1w/T2w ratio methods. Sci Rep. 2018;8:10554. [DOI] [PMC free article] [PubMed] [Google Scholar]
- 16.Andica C Hagiwara A Hori M, et al. Aberrant myelination in patients with Sturge-Weber syndrome analyzed using synthetic quantitative magnetic resonance imaging. Neuroradiology. 2019;61:1055–1066. [DOI] [PubMed] [Google Scholar]
- 17.Hagiwara A Kamagata K Shimoji K, et al. White matter abnormalities in multiple sclerosis evaluated by quantitative synthetic MRI, diffusion tensor imaging, and neurite orientation dispersion and density imaging. AJNR Am J Neuroradiol. 2019;40:1642–1648. [DOI] [PMC free article] [PubMed] [Google Scholar]
- 18.Hwang KP Banerjee S Zhang T, et al. 3D isotropic multi-parameter mapping and synthetic imaging of the brain with 3D-QALAS: comparison with 2D MAGIC. In Proceedings of the 27th Annual Meeting of ISMRM. Montréal, Canada; 2019:5759. [Google Scholar]
- 19.Fujita S Hagiwara A Hori M, et al. 3D quantitative synthetic MRI-derived cortical thickness and subcortical brain volumes: scan-rescan repeatability and comparison with conventional T1 -weighted images. J Magn Reson Imaging. 2019;50:1834–1842. [DOI] [PMC free article] [PubMed] [Google Scholar]
- 20.Fujita S Hagiwara A Hori M, et al. Three-dimensional high-resolution simultaneous quantitative mapping of the whole brain with 3D-QALAS: an accuracy and repeatability study. Magn Reson Imaging. 2019;63:235–243. [DOI] [PubMed] [Google Scholar]
- 21.Lustig M, Donoho D, Pauly JM. Sparse MRI: the application of compressed sensing for rapid MR imaging. Magn Reson Med. 2007;58:1182–1195. [DOI] [PubMed] [Google Scholar]
- 22.Sagawa H Kataoka M Kanao S, et al. Impact of the number of iterations in compressed sensing reconstruction on ultrafast dynamic contrast-enhanced breast MR imaging. Magn Reson Med Sci. 2019;18:200–207. [DOI] [PMC free article] [PubMed] [Google Scholar]
- 23.Kijowski R Rosas H Samsonov A, et al. Knee imaging: rapid three-dimensional fast spin-echo using compressed sensing. J Magn Reson Imaging. 2017;45:1712–1722. [DOI] [PMC free article] [PubMed] [Google Scholar]
- 24.Seo N Park MS Han K, et al. Feasibility of 3D navigator-triggered magnetic resonance cholangiopancreatography with combined parallel imaging and compressed sensing reconstruction at 3T. J Magn Reson Imaging. 2017;46:1289–1297. [DOI] [PubMed] [Google Scholar]
- 25.Fushimi Y Fujimoto K Okada T, et al. Compressed sensing 3-dimensional time-of-flight magnetic resonance angiography for cerebral aneurysms: optimization and evaluation. Invest Radiol. 2016;51:228–235. [DOI] [PubMed] [Google Scholar]
- 26.Okuchi S Fushimi Y Okada T, et al. Visualization of carotid vessel wall and atherosclerotic plaque: T1-SPACE vs. compressed sensing T1-SPACE. Eur Radiol. 2019;29:4114–4122. [DOI] [PubMed] [Google Scholar]
- 27.Fushimi Y Okada T Kikuchi T, et al. Clinical evaluation of time-of-flight MR angiography with sparse undersampling and iterative reconstruction for cerebral aneurysms. NMR Biomed. 2017;30. [DOI] [PubMed] [Google Scholar]
- 28.Koolstra K Beenakker JM Koken P, et al. Cartesian MR fingerprinting in the eye at 7T using compressed sensing and matrix completion-based reconstructions. Magn Reson Med. 2019;81:2551–2565. [DOI] [PMC free article] [PubMed] [Google Scholar]
- 29.Mazor G Weizman L Tal A, et al. Low-rank magnetic resonance fingerprinting. Med Phys. 2018. doi: 10.1002/mp.13078. [DOI] [PubMed] [Google Scholar]
- 30.Doneva M Bornert P Eggers H, et al. Compressed sensing reconstruction for magnetic resonance parameter mapping. Magn Reson Med. 2010;64:1114–1120. [DOI] [PubMed] [Google Scholar]
- 31.King K Xu D Brau AC, et al. Compressed sensing description: “a new combination of compressed sensing and data driven parallel imaging”. In: Proceedings of the 19th Annual Meeting of ISMRM. Stockholm, Sweden; 2010:4881. [Google Scholar]
- 32.Takei N Hagiwara A Fujita S, et al. Compressed sensing 3D multi-parametric imaging toward isotropic 1mm3 imaging. In: Proceedings of the 27th Annual Meeting of ISMRM. Montréal, Canada; 2019:2981. [Google Scholar]
- 33.Brau AC Beatty PJ Skare S, et al. Comparison of reconstruction accuracy and efficiency among autocalibrating data-driven parallel imaging methods. Magn Reson Med. 2008;59:382–395. [DOI] [PMC free article] [PubMed] [Google Scholar]
- 34.Keenan KE Stupic KF Boss MA, et al. Multi-site, multi-vendor comparison of T1 measurement using ISMRM/NIST system phantom. In: Proceedings of the 24th Annual Meeting of ISMRM. Singapore; 2016:3290. [Google Scholar]
- 35.Thompson AJ Banwell BL Barkhof F, et al. Diagnosis of multiple sclerosis: 2017 revisions of the McDonald criteria. Lancet Neurol. 2018;17:162–173. [DOI] [PubMed] [Google Scholar]
- 36.Hagiwara A Hori M Cohen-Adad J, et al. Linearity, bias, intrascanner repeatability, and interscanner reproducibility of quantitative multidynamic multiecho sequence for rapid simultaneous relaxometry at 3 T: a validation study with a standardized phantom and healthy controls. Invest Radiol. 2019;54:39–47. [DOI] [PubMed] [Google Scholar]
- 37.Jenkinson M Beckmann CF Behrens TE, et al. FSL. Neuroimage. 2012;62:782–790. [DOI] [PubMed] [Google Scholar]
- 38.West J, Warntjes JB, Lundberg P. Novel whole brain segmentation and volume estimation using quantitative MRI. Eur Radiol. 2012;22:998–1007. [DOI] [PubMed] [Google Scholar]
- 39.Tanenbaum LN Tsiouris AJ Johnson AN, et al. Synthetic MRI for clinical neuroimaging: results of the magnetic resonance image compilation (MAGiC) prospective, multicenter, multireader trial. AJNR Am J Neuroradiol. 2017;38:1103–1110. [DOI] [PMC free article] [PubMed] [Google Scholar]
- 40.Krupa K, Bekiesinska-Figatowska M. Artifacts in magnetic resonance imaging. Pol J Radiol. 2015;80:93–106. [DOI] [PMC free article] [PubMed] [Google Scholar]
- 41.R Core Team. R: A Language and Environment for Statistical Computing [computer program]. Version 3.5.1. Vienna, Austria: R Foundation for Statistical Computing; 2018. Available at: https://www.R-project.org/. Accessed July 2, 2020. [Google Scholar]
- 42.Lee SM Choi YH Cheon JE, et al. Image quality at synthetic brain magnetic resonance imaging in children. Pediatr Radiol. 2017;47:1638–1647. [DOI] [PubMed] [Google Scholar]
- 43.Hagiwara A Otsuka Y Hori M, et al. Improving the quality of synthetic flair images with deep learning using a conditional generative adversarial network for pixel-by-pixel image translation. AJNR Am J Neuroradiol. 2019;40:224–230. [DOI] [PMC free article] [PubMed] [Google Scholar]
- 44.Sharma SD Fong CL Tzung BS, et al. Clinical image quality assessment of accelerated magnetic resonance neuroimaging using compressed sensing. Invest Radiol. 2013;48:638–645. [DOI] [PubMed] [Google Scholar]
- 45.Hagiwara A Fujita S Ohno Y, et al. Variability and standardization of quantitative imaging: monoparametric to multiparametric quantification, radiomics, and artificial intelligence. Invest Radiol. 2020;55:601–616. [DOI] [PMC free article] [PubMed] [Google Scholar]
- 46.Wang K Doneva M Amthor T, et al. High fidelity direct-contrast synthesis from magnetic resonance fingerprinting in diagnostic imaging. In Proceedings of the 28th Annual Meeting of ISMRM. Sydney, Australia; 2020:867. [Google Scholar]
- 47.Damulina A Pirpamer L Soellradl M, et al. Cross-sectional and longitudinal assessment of brain iron level in Alzheimer disease using 3-T MRI. Radiology. 2020;296:619–626. [DOI] [PubMed] [Google Scholar]
- 48.Fujita S Hagiwara A Otsuka Y, et al. Deep learning approach for generating MRA images from 3D quantitative synthetic MRI without additional scans. Invest Radiol. 2020;55:249–256. [DOI] [PubMed] [Google Scholar]
- 49.Takei N Shin D Rettman D, et al. Prospective motion corrected 3D multi-parametric imaging. In Proceedings of the 28th Annual Meeting of ISMRM. Sydney, Australia; 2020:880. [Google Scholar]
Associated Data
This section collects any data citations, data availability statements, or supplementary materials included in this article.


