ABSTRACT
Although the treatment of brain tumors by targeting kinase-regulated macroautophagy/autophagy, is under investigation, the precise mechanism underlying autophagy initiation and its significance in glioblastoma (GBM) remains to be defined. Here, we report that PAK1 (p21 [RAC1] activated kinase 1) is significantly upregulated and promotes GBM development. The Cancer Genome Atlas analysis suggests that the oncogenic role of PAK1 in GBM is mainly associated with autophagy. Subsequent experiments demonstrate that PAK1 indeed serves as a positive modulator for hypoxia-induced autophagy in GBM. Mechanistically, hypoxia induces ELP3-mediated PAK1 acetylation at K420, which suppresses the dimerization of PAK1 and enhances its activity, thereby leading to subsequent PAK1-mediated ATG5 (autophagy related 5) phosphorylation at the T101 residue. This event not only protects ATG5 from ubiquitination-dependent degradation but also increases the affinity between the ATG12–ATG5 complex and ATG16L1 (autophagy related 16 like 1). Consequently, ELP3-dependent PAK1 (K420) acetylation and PAK1-mediated ATG5 (T101) phosphorylation are required for hypoxia-induced autophagy and brain tumorigenesis by promoting autophagosome formation. Silencing PAK1 with shRNA or small molecule inhibitor FRAX597 potentially blocks autophagy and GBM growth. Furthermore, SIRT1-mediated PAK1-deacetylation at K420 hinders autophagy and GBM growth. Clinically, the levels of PAK1 (K420) acetylation significantly correlate with the expression of ATG5 (T101) phosphorylation in GBM patients. Together, this report uncovers that the acetylation modification and kinase activity of PAK1 plays an instrumental role in hypoxia-induced autophagy initiation and maintaining GBM growth. Therefore, PAK1 and its regulator in the autophagy pathway might represent potential therapeutic targets for GBM treatment.
Abbreviations: 3-MA: 3-methyladenine; Ac-CoA: acetyl coenzyme A; ATG5: autophagy related 5; ATG16L1, autophagy related 16 like 1; BafA1: bafilomycin A1; CDC42: cell division cycle 42; CGGA: Chinese Glioma Genome Atlas; CHX, cycloheximide; ELP3: elongator acetyltransferase complex subunit 3; GBM, glioblastoma; HBSS: Hanks balanced salts solution; MAP1LC3B/LC3: microtubule associated protein 1 light chain 3 beta; MAP2K1: mitogen-activated protein kinase kinase 1; MAPK14, mitogen-activated protein kinase 14; PAK1: p21 (RAC1) activated kinase 1; PDK1: pyruvate dehydrogenase kinase 1; PGK1, phosphoglycerate kinase 1; PTMs: post-translational modifications; RAC1: Rac family small GTPase 1; SQSTM1: sequestosome 1; TCGA, The Cancer Genome Atlas.
KEYWORDS: Acetylation, ATG5, dimerization, ELP3, glioblastoma, PAK1, phosphorylation, SIRT1, ubiquitination
Introduction
It is well-known that post-translational modifications (PTMs) such as acetylation, ubiquitination, phosphorylation, and methylation modulate almost all autophagy-related (ATG) proteins [1]. Interestingly, the different PTMs of multiple residues from one ATG protein often operate together to dictate the final functional outcome [2]. ATG proteins constitute the most important molecular platform and are the central players in autophagy by regulating autophagosome initiation and maturation [3]. Fine-tuning of the levels of autophagy in tumor cells occurs by a plethora of strategies, including PTMs of ATG proteins [4]. Therefore, it is crucial to further uncover the PTMs of ATG proteins, particularly the crosstalk of PTMs.
P21-activated kinase (PAK) family includes six serine-threonine kinase members (PAK1-6), initially identified as major effector proteins for the Rho GTPases CDC42 and Rac family small GTPase (RAC) [5]. Previous studies have shown that most of the PAKs are often associated with tumorigenesis [6]. However, the molecular mechanisms by which the PAKs operate in cancer still are not elucidated very well. Recently, TCGA data uncover that PAK1, the best characterized and most ubiquitous member among the six isoforms, is significantly upregulated in glioblastoma (GBM). Nevertheless, the significance and mechanism of PAK1 in GBM progression remain to be clarified.
This study reports a novel finding that acetylated PAK1 can serve as a modulator for hypoxia-induced autophagy in GBM, suggesting that targeting PAK1 might be a potential option for the treatment of GBM.
Results
PAK1 was significantly upregulated and acted as an oncogene in GBM
To uncover the function of PAK1, we first evaluated the kinase activity in glioma cells (Figure 1A). It was found that the PAK1 activity was higher in glioma cells compared to normal human astrocytes (HA). The transcriptomic profiles from the Cosmic cell lines project indicated that the level of PAK1 mRNA was higher in most GBM cells than low-grade glioma cells (H4) (Figure 1B). Moreover, the protein level of PAK1 was also upregulated in the majority of GBM cells (Figure 1C). In the Human Protein Atlas, the immunohistochemical (IHC) staining revealed that the value of PAK1 was higher in high-grade gliomas (Figure 1D), which we validated in our specimens (P = 0.002, Figure 1E). Notably, knockdown of PAK1 using shRNA significantly suppressed the proliferation of LN229 and U251 cells in vitro and GBM growth in vivo (Figure 1F, G, and S1). Consistently, the proliferation index, MKI67, was significantly reduced in the PAK1 knockdown group (Figure 1H).
Figure 1.
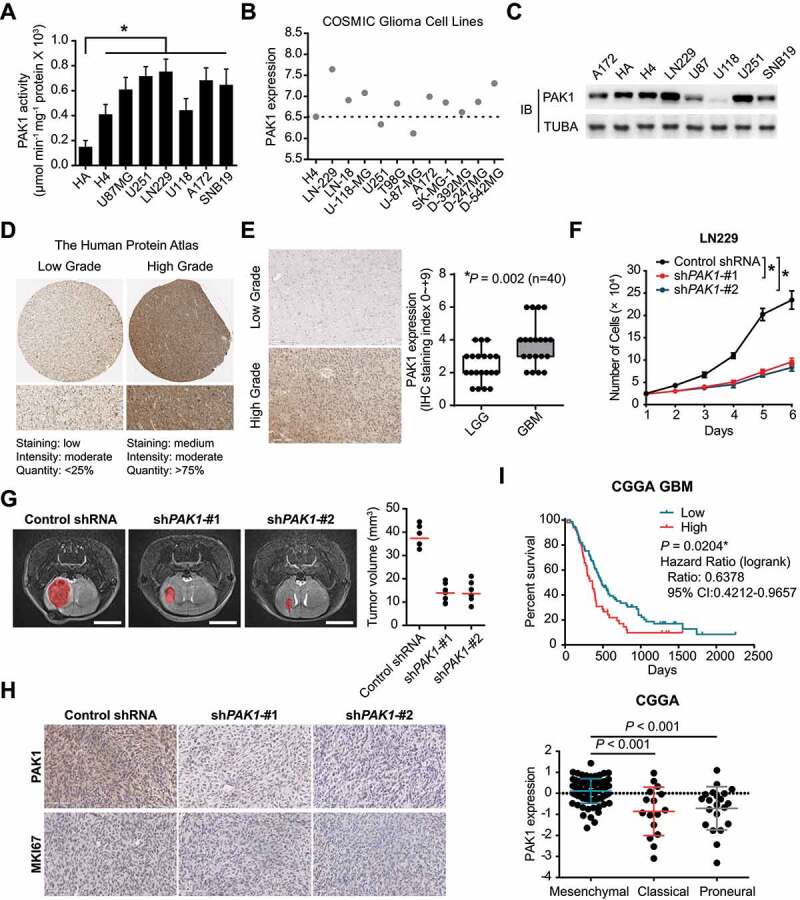
PAK1 was significantly upregulated and acted as an oncogene in GBM. (A) The kinase activity of PAK1 in GBM cells and normal human astrocytes (HA). (B) The transcriptomic expression of PAK1 in the COSMIC project. (C) The protein level of PAK1 in glioma cells. (D) In the Human Protein Atlas, the representative IHC staining of PAK1 in low-grade and high-grade gliomas was presented. (E) The PAK1 staining in lower grade glioma (WHO II and III) is lower than that in GBM samples. (F) CCK-8 assay indicated that the proliferative potential of LN229 cells was attenuated in PAK1 shRNA groups. (G) The 7 T MR images indicated that the tumor cell growth was inhibited in mice with PAK1 knockdown. Scale bars: 4 mm. (H) The IHC staining of MKI67 in PAK1 shRNA transfected and control tumors in xenograft mice. (I) The prognostic implication and expression pattern of PAK1 in human GBM CGGA data. The OS of GBM patients was shown. The level of PAK1 was higher in the MES subtype compared to Classical or Proneural subtypes
We obtained clinical information and transcriptome data from both CGGA and TCGA datasets to evaluate the prognostic significance of PAK1 in human GBM. In the CGGA cohort, the GBM patients with higher expression of PAK1 survived significantly shorter than those with lower PAK1 values (Figure 1I). We validated the prognostic implication of PAK1 in the TCGA RNA-sequencing and microarray cohort (P < 0.01, Fig. S2). Furthermore, it also was observed that the expression of PAK1 was higher in the mesenchymal (MES) subtype (Figure 1I and S2). Given that The MES transcriptional subtype was believed to be associated with shorter survival and poor radiation response in GBM patients [7], our results strongly suggest an oncogenic role of PAK1 in GBM.
Bioinformatic analysis in GBM patients reveals an important relationship between PAK1 and autophagy
To clarify the mechanism by which PAK1 promotes GBM development, we performed a bioinformatic analysis of PAK1 in GBM patients. To this end, the PAK1-positive-related genes in the CGGA cohort were screened and subjected to gene enrichment analysis. We found that the PAK1-associated cellular components were mainly about lysosome, lytic vacuole, and vesicle, which are tightly involved in autophagy (Figure 2A). The gene ontology analysis demonstrated that high expression of PAK1 positively associated with protein modification, metabolism, immune response, as well as autophagy-related biological processes in KEGG pathways (Figure 2B,C). Then, we analyzed the correlation between PAK1 expression and GSVA score. As shown in Figure 2D, PAK1 positively associated with autophagy-related GO terms (positive regulation of autophagy, R = 0.38; regulation of autophagy, R = 0.32; autophagy, R = 0.25 and macroautophagy, R = 0.22) and public available gene set (autophagy network [8], R = 0.23). Moreover, the expression of PAK1 was positively associated with 113 of autophagy genes, such as SQSTM1 and ATG3 (Figure 2D). Together, bioinformatic analysis suggests that the oncogenic function of PAK1 in GBM might be related to its regulation in autophagy.
Figure 2.
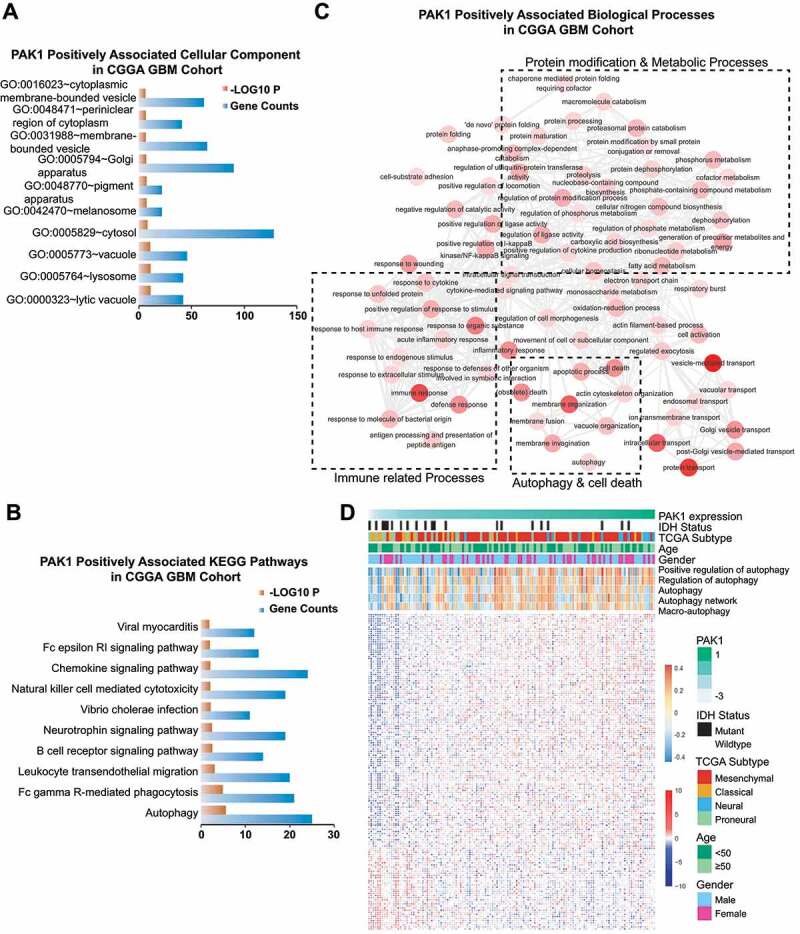
Bioinformatic analysis in GBM patients reveals an important relationship between PAK1 and autophagy. The cellular component (A) and KEGG pathway (B) for PAK1-positively-associated genes. (C) The annotation indicated that PAK1 was positively associated with several biological processes mainly involved in immune-related processes, protein modification, metabolic processes, cell death, and particularly autophagy. (D) The heatmap of autophagy-related genes (blue-red), pathway, and relevant clinical features
PAK1 promotes autophagy under hypoxia, which is required for PAK1-mediated GBM cell growth
To explore the function of autophagy in PAK1-mediated GBM cell growth, we examined the effects of 3-methyladenine (3-MA), an autophagy inhibitor on the growth of GBM cells with PAK1 overexpression. We observed that 3-MA suppressed PAK1-mediated cell growth in a dose-dependent manner under hypoxia (Figure 3A). Knockdown of ATG5, a core component of the functional autophagy, not only blocked the conversion of LC3B-I to LC3B-II but also significantly inhibited PAK1-mediated U87 cell growth under hypoxia (Figure 3B), indicating that autophagy is needed for PAK1-mediated GBM cell growth.
Figure 3.
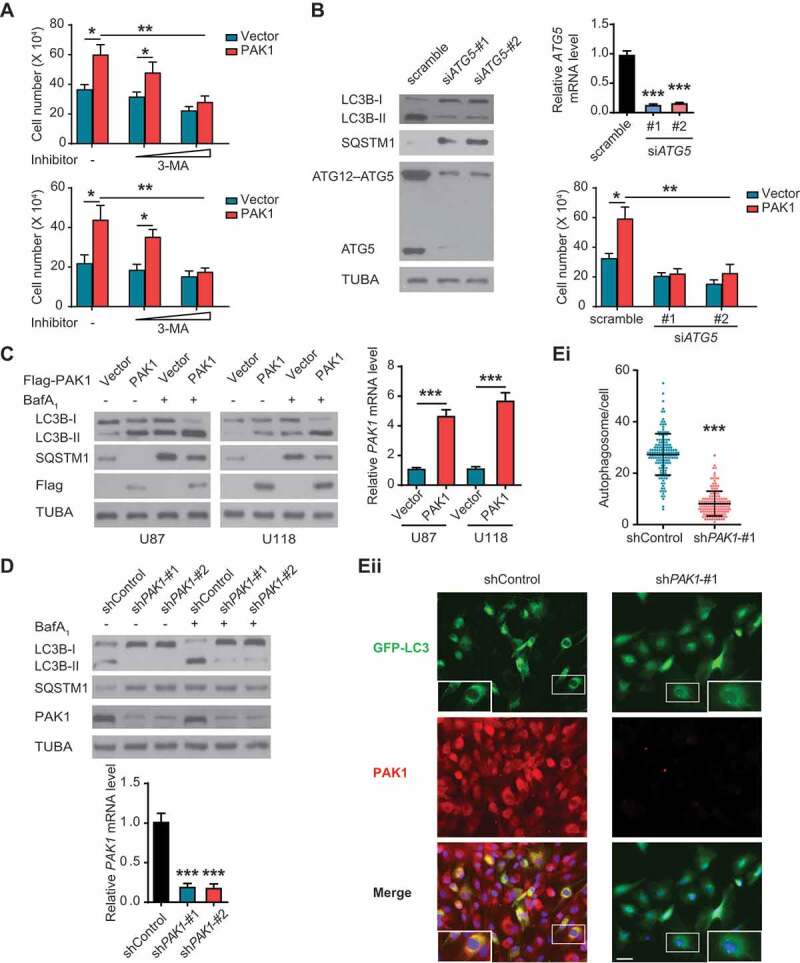
PAK1 promotes autophagy which is needed for PAK1-enhanced GBM cell proliferation. (A) U87 and U118 cells were transfected with or without PAK1 construct in combination with or without increasing concentrations of 3-MA (1 and 10 mM). Cells were subjected to hypoxia, the relative number of cells was quantified using MTT assay. Each sample was performed in triplicate. (B) U87 cells were overexpressed with or without PAK1, together with or without siRNA targeting ATG5. Cells were subjected to hypoxia. Relative cell numbers were then quantitated as in A. Immunoblotting assay (left panel) and qRT-PCR (right panel) using lysates from transfected U87 cells was performed to demonstrate ATG5 knockdown and assess autophagy. (C) U87 and U118 cells were transfected with a control vector or PAK1 construct. Then cells were subjected to hypoxia, with or without treatment of BafA1. Western blots were performed as indicated (left panel) and qRT-PCR (right panel) to demonstrate PAK1 overexpression. (D and E) LN229 cells were transfected with PAK1 shRNA-#1 or -#2, respectively. Then cells were subjected to hypoxia, with or without treatment of BafA1. qRT-PCR was performed to demonstrate PAK1 knockdown (D lower panel). The level of LC3B-II was shown (D, upper panel). Representative figure of GFP-LC3 puncta (Eii) and the quantification of autophagosomes (Ei, data was shown as the mean ± SD of 150 cells) was shown. Scale bar: 0.05 mm
Interestingly, we also observed that overexpression of PAK1 enhanced LC3B-II, and decreased SQSTM1 in hypoxia-treated U87 and U118 cells (Figure 3C). Conversely, knockdown of PAK1 reduced LC3B-II in LN229 and U251 cells (Figure 3D and S3), and the number of autophagic puncta in LN229 cells under hypoxia (Figure 3E). Therefore, PAK1 promotes autophagy in hypoxia-treated GBM cells, suggesting that autophagy may be necessary for PAK1-mediated GBM growth.
PAK1 directly phosphorylates ATG5 at conserved T101 residue in GBM cells
We performed the proximity-dependent biotin method (BioID2) to screen the interactors of PAK1 in U87 cells to clarify the regulatory mechanism by which PAK1 modulates autophagy [9]. This screening identified RAC1 and MAP2K1, two bona fide PAK1 interactors [10], validating the approach (Figure 4A and Table S1). Given that we observed ATG5, a key initiator of early autophagy, in PAK1-BioID2 samples (Figure 4A), we hypothesized that ATG5 might be the downstream effector of PAK1 in GBM. We first confirmed that hypoxia indeed induced the co-immunoprecipitation and co-localization of endogenous PAK1 and ATG5 in LN229 cells (Figure 4B,C).
Figure 4.
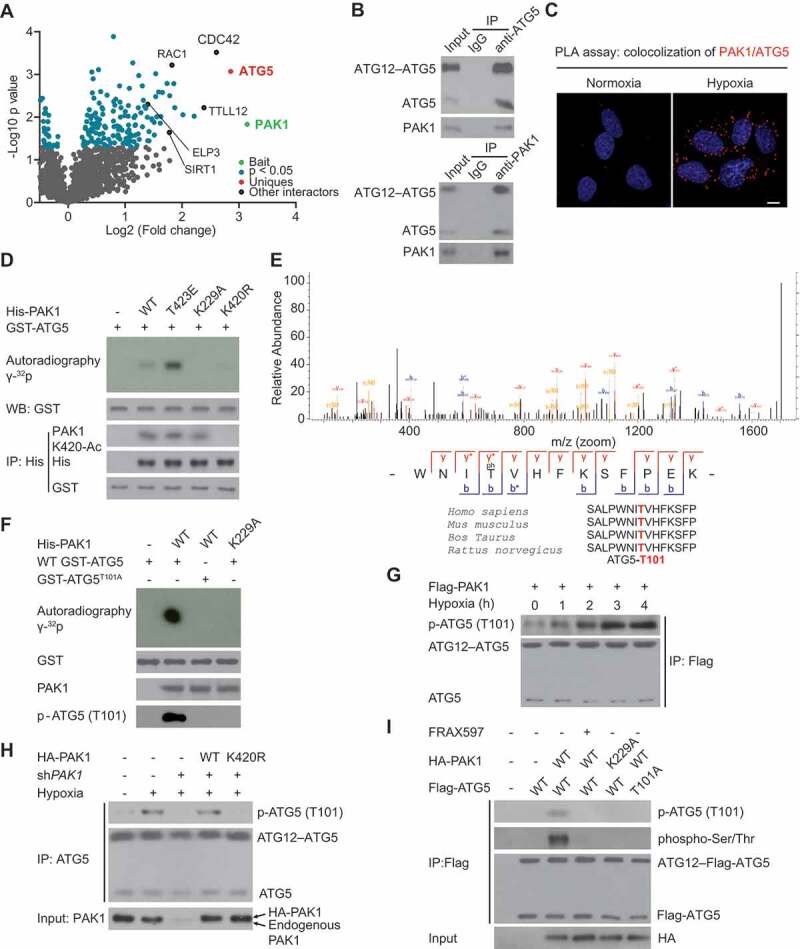
PAK1 directly phosphorylates ATG5 at conserved T101 residue in GBM cells. (A) Volcano plot indicating the interactors of PAK1 in U87 cells. (B) Hypoxia-induced the co-immunoprecipitation of endogenous PAK1 and ATG5 in LN229 cells. (C) PLA assay indicated that hypoxia promoted the cytoplasmic co-localization of endogenous PAK1 and ATG5 in LN229 cells. Scale bar: 0.01 mm. (D) Ni-NTA agarose beads were used to immobilize bacterially purified His-PAK1 proteins, then incubated with HA-ELP3 and Ac-CoA. Then these beads were incubated with purified GST-ATG5 and [γ-32P] ATP kinase buffer. Autoradiography was performed. (E) Mass spectrometric analysis was performed to identify the PAK1-induced phosphorylation site of ATG5. (F) Ni-NTA agarose beads were used to immobilize bacterially purified His-PAK1 proteins as indicated. Then these beads were incubated with GST-ATG5 or GST-ATG5T101A mutant and [γ-32P] ATP kinase buffer. ATG5 phosphorylation was examined. (G) LN229 cells with Flag-PAK1 transfection were submitted to hypoxia treatment or not. Immunoprecipitation (IP) with anti-Flag was performed. A specific anti-p-ATG5 (T101) antibody produced by our group was used to detect ATG5 phosphorylation. (H) LN229 cells with or without shPAK1 or WT HA-PAK1 or HA-PAK1K420R transfection were subjected to hypoxia. A specific anti-p-ATG5 (T101) antibody produced by our group was used to detect ATG5 phosphorylation. (I) Before hypoxia treatment, PAK1-depleted LN229 cells with the reintroduction of WT HA-PAK1 or HA-PAK1K229A mutant were subjected to FRAX597 treatment or not for 1 hr. ATG5 (T101) phosphorylation was measured as indicated
Given that PAK1 was a protein kinase, we then examined whether ATG5 was one of its phosphorylation substrates. To this end, we performed an in vitro kinase experiment. As shown in Figure 4D, bacterially-purified wild type PAK1 and kinase active PAK1T423E, but not active-dead PAK1K229A mutant, phosphorylated ATG5. Mass spectrometric (MS) analysis further identified PAK1-mediated ATG5 phosphorylation at evolutionarily conserved T101 residue (Figure 4E). We confirmed this finding using a specific anti-p-ATG5 (T101) antibody produced by our group while the mutation of ATG5 (T101) into Ala completely abrogated its phosphorylation (Figure 4F). Physiologically, hypoxia rapidly induced ATG5 (T101) phosphorylation in LN229 cells (Figure 4G). However, silencing PAK1 significantly mitigated this enhanced phosphorylation, which could be restored by reintroduction of WT PAK1, in LN229 cells (Figure 4H) or U251 cells (Fig. S4A). Consistent with the above findings, FRAX597, a PAK1 small molecule inhibitor [11], strongly reverted WT PAK1-induced ATG5 (T101) phosphorylation in LN229 cells (Figure 4I) or U251 cells under hypoxia (Fig. S4B).
Although literature reported another phosphorylation site of ATG5 at T75 [12], we found that hypoxia-induced ATG5 (T101) phosphorylation is independent of ATG5 (T75) phosphorylation (Fig. S4 C).
Together, these findings indicate that hypoxia induces phosphorylation of ATG5 at T101 by PAK1 in GBM cells.
Pak1-mediated phosphorylation of ATG5 protein at threonine 101 prevents its ubiquitination and degradation
Having demonstrated that PAK1 phosphorylates ATG5 at T101, our next objective was to investigate its functional significance. Using MS/MS assay, we identified 2 possible ubiquitination sites (K105 and K110) on ATG5 (data now shown). Given that K105 and K110 are very close to the T101 phosphorylation site, we reasoned that PAK1-mediated ATG5 phosphorylation at T101 might affect the ubiquitination and stability of ATG5.
Supporting this idea, PAK1 overexpression or knockdown did not change the levels of ATG5 mRNA in U87 and LN229 cells, respectively (Figure 5A). Cycloheximide (CHX) treatment indicated that PAK1 deficiency in LN229 cells significantly reduced the half-life of ATG5 (Figure 5B), while PAK1 overexpression had the opposite effect in U87 cells (Figure 5B,C). PAK1 knockdown-mediated decrease in LN229 cells was inhibited by adding MG132 (Figure 5D). Together, these data indicate that PAK1 enhances the protein stability of ATG5 in GBM cells.
Figure 5.
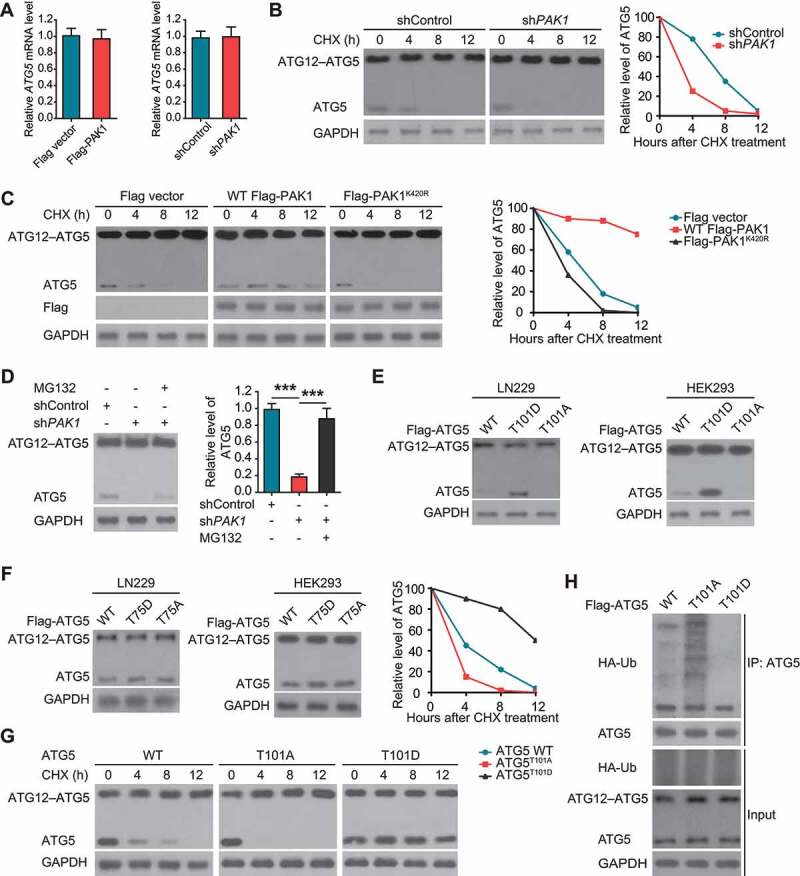
PAK1-induced phosphorylation on T101 of ATG5 inhibits ATG5 ubiquitination and promotes its stability. (A) The levels of ATG5 mRNA in U87 cells or LN229 cells with indicated treatment were measured using qRT-PCR. (B and C) The effect of treatment of CHX (20 μg/ml) on the half-life of ATG5 protein in LN229 or U87 cells with indicated treatment, respectively. (D) The effect of MG-132 on ATG5 degradation in LN229 cells with PAK1 deficiency. (E) The effect of different ATG5 constructs on the levels of ATG5 protein in HEK293 T cells and LN229 cells, respectively. (F) The effect of ATG5 (T75) mutants on the expression of ATG5 protein. (G) The effect of CHX treatment on the levels of ATG5 protein in HEK293 T cells transfected with different ATG5 plasmids. (H) The effect of different ATG5 plasmids on the level of ATG5 ubiquitination in HEK293 T cells. We used an anti-Flag antibody to check the protein level of ATG5 in E-H.
Next, we investigated whether PAK1-mediated phosphorylation at T101 regulated ATG5 stability. Thus, we transfected HEK293 T and LN229 cells with a phospho-deficient ATG5T101A or phosphomimetic ATG5T101D mutant, respectively. We found that T101A decreased, but T101D increased the levels of ATG5 protein compared with WT ATG5 (Figure 5E). However, the level of ATG5 protein was not affected by the T75 mutant (Figure 5F). CHX treatment further confirmed the importance of T101 phosphorylation in the stability of ATG5 protein in HEK293 T cells (Figure 5G).
We also performed the ubiquitination assay. As shown in Figure 5H, we observed less ubiquitin binding to T101D as compared with WT ATG5, while ATG5T101A had significantly increased ubiquitination compared with WT ATG5, suggesting crosstalk between phosphorylation at T101 and ubiquitination of ATG5 in GBM cells.
Pak1-mediated phosphorylation of ATG5 protein at T101 enhances ATG12–ATG5-ATG16L1 complex formation and thereby promotes hypoxia-induced autophagosome
Since ATG5 mediates the binding of ATG16L1 to ATG12–ATG5 conjugate [13], we investigated whether PAK1-mediated phosphorylation of ATG5 protein at T101 modulated ATG12–ATG5-ATG16L1 complex formation. To this end, we first determined whether PAK1 depletion or inhibition with a compound could affect ATG12–ATG5-ATG16L1 association in response to hypoxia in LN229 cells. As indicated in Figure 6A,B, hypoxia treatment significantly upregulated the amount of ATG12–ATG5 that co-immunoprecipitates with ATG16L1 while no increase was seen in PAK1-silenced or inhibitor-treated cells, even though ATG12–ATG5 and ATG16L1 protein levels were similar in all cell extracts treated with MG132. Co-immunoprecipitation assay further indicated that the increasing ATG12–ATG5-ATG16L1 binding in U87 cells in response to hypoxia required the kinase activity of PAK1 (Figure 6C), indicating that the phosphorylation events regulate the ATG12–ATG5-ATG16L1 association. We performed similar experiments to determine the role of T101 phosphorylation in ATG12–ATG5-ATG16L1 association. We found that PAK1 overexpression cannot induce the binding of ATG12–ATG5T101A to ATG16L1 (Figure 6D). Altogether, these findings suggest that PAK1 promotes the physical association between ATG12–ATG5 and ATG16L1 in GBM cells under hypoxia and, for this, the phosphorylation of ATG5 on T101 by PAK1 is required.
Figure 6.
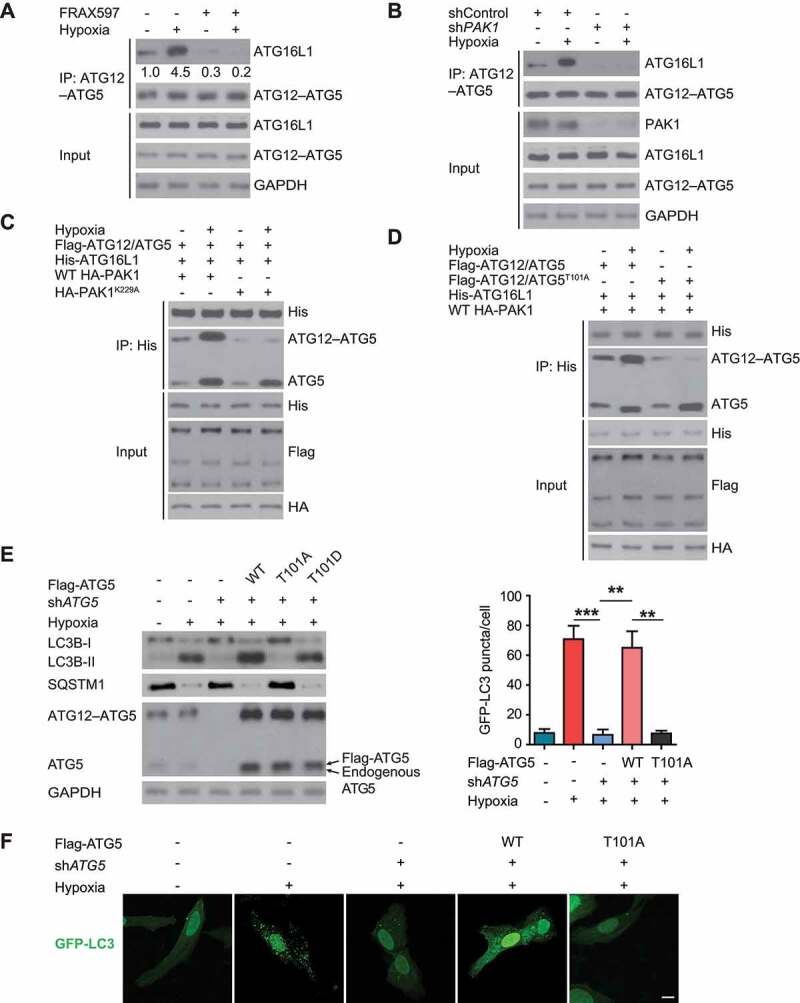
PAK1-mediated phosphorylation of ATG5 protein at T101 promotes ATG12–ATG5-ATG16L1 binding and autophagosome in response to hypoxia in GBM cells. ATG16L1 was immunoprecipitated from LN229 cells pretreated with a PAK1 inhibitor and then exposed to hypoxia (A) or transfected with control or PAK1 shRNA with or without hypoxia (B). Cells were treated with MG132 before harvest. Immunoblotting confirmed ATG12–ATG5 presence in immunocomplexes. (C) Stably expressed HA-PAK1 or HA-PAK1K229A U87 cells were transfected with Flag-ATG12, Flag-ATG5 (labeled as Flag-ATG12/ATG5), and His-ATG16L1. His-ATG16L1 was immunoprecipitated, and immunocomplexes were analyzed by western blot with the indicated antibodies. (D) Stably expressed HA-PAK1 U87 cells were transfected with Flag-ATG12, Flag-ATG5 (labeled as Flag-ATG12/ATG5), or Flag-ATG5101A (labeled as Flag-ATG12/ATG5101A), and His-ATG16L1. His-ATG16L1 was immunoprecipitated and western blots were performed as indicated. (E) The endogenous ATG5 in LN229 cells was knocked down or not. Then WT Flag-ATG5 or ATG5T101A or ATG5T101D were reintroduced into LN229 cells which were cultured with or without hypoxia treatment. Western blots were performed with anti-SQSTM1 or LC3B antibody. (F) The cells in (E) were transfected with GFP-LC3 and representative images were shown. Scale bar: 0.01 mm
Because an increased ATG12–ATG5-ATG16L1 association promoted autophagosome production [14], we examined the functional consequence of PAK1-mediated T101 phosphorylation of ATG5 in response to hypoxia in GBM cells. As indicated in Figure 6E,F, WT ATG5, and ATG5T101D promoted while ATG5T101A significantly suppressed the decrease of SQSTM1, LC3B-II, and autophagy puncta in LN229 cells with endogenous ATG5 deficiency. Thus, hypoxia-induced autophagy in GBM cells required PAK1-mediated ATG5 (T101) phosphorylation.
Hypoxia-induced PAK1 acetylation at K420 promotes its binding to ATG5 and autophagy initiation in GBM cells
Although hypoxia enhanced the interaction between PAK1 and ATG5, we found that recombinant PAK1 could not bind to recombinant ATG5 in vitro (Fig. S5). Given that PTMs of proteins often changed protein-protein interactions by their structures’ alteration [15], we reasoned that hypoxia might induce the PTM of PAK1, which subsequently increased the affinity of PAK1 to ATG5. Indeed, immunoblotting experiments indicated that hypoxia significantly upregulated the acetylation of PAK1 in LN229 and U251 cells (Figure 7A). Additionally, the treatment of anacardic acid (AA, an acetylation inhibitor) significantly decreased hypoxia-induced acetylation of PAK1 and the association of PAK1 with ATG5 in LN229 and U251 cells (Figure 7A), validating our hypothesis. Furthermore, MS identified K420 as an acetylation site in the hypoxia-treated LN229 cells (Figure 7B). In vitro affinity-isolation experiments demonstrated that PAK1 with K420 acetylation interacted with ATG5 while PAK1K420R mutant lost this function (Figure 7C). Similarly, PAK1K420R mutant, different from WT PAK1, failed to interact with ATG5 in endogenous PAK1-depleted LN229 cells in response to hypoxia (Figure 7D). These results indicate that the hypoxia-induced K420 acetylation of PAK1 promotes its binding to ATG5 in GBM cells.
Figure 7.
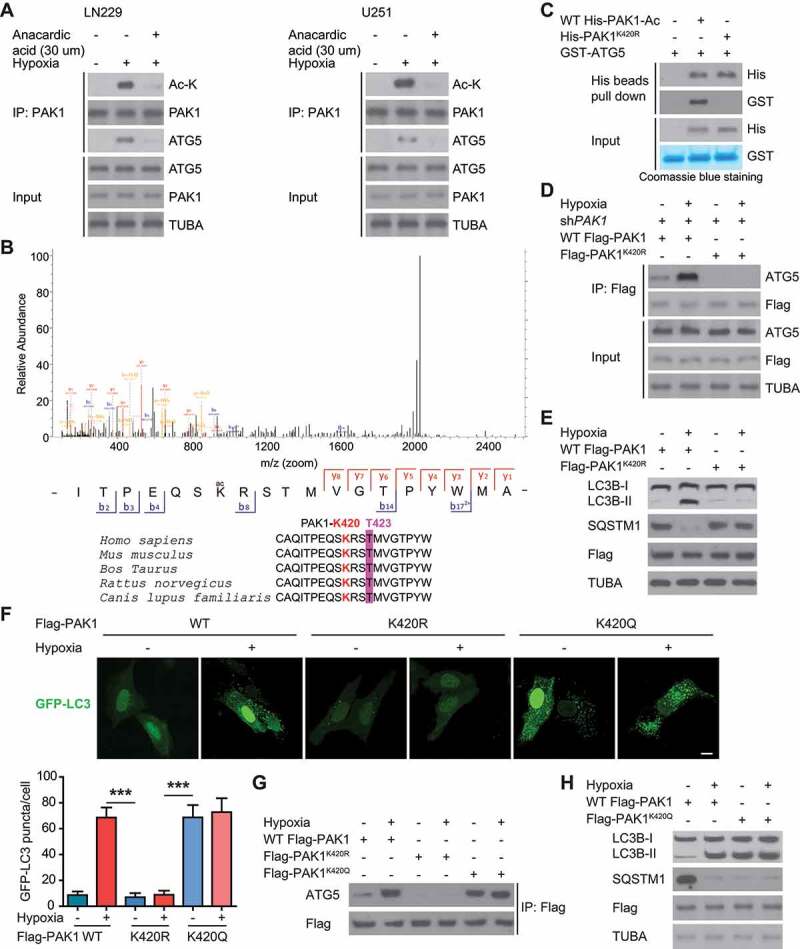
PAK1 at K420 acetylation promotes the binding of PAK1 to ATG5 and autophagy initiation in GBM cells upon hypoxia. (A) LN229 and U251 cells were treated with 30 μM anacardic acid (AA) and subjected to hypoxia or normoxia for one day. Then the indicated antibodies were probed to analyze the cell lysates. (B) MS identified the site of acetylation of PAK1 in hypoxia-treated GBM cells. (C) Ni-NTA agarose beads were used to immobilize bacterially purified WT His-PAK1 or His-PAK1K420R proteins, then incubated with HA-ELP3 and Ac-CoA. Then these beads were incubated with purified GST or GST-ATG5 to perform His bead pull-down assay. (D) The endogenous PAK1 in LN229 cells was knocked down. Then these cells were reintroduced with WT Flag-PAK1 or Flag-PAK1K420R mutant and were subjected to hypoxia or not. Then immunoprecipitation analysis with indicated antibodies was performed. (E) The endogenous PAK1 in LN229 cells was knocked down. Then these cells were reintroduced with WT Flag-PAK1, or Flag-PAK1K420R, and were subjected to hypoxia or not. Western blots were performed as indicated. (F) GFP-LC3 was transiently expressed in PAK1-depleted LN229 cells which were reintroduced with WT Flag-PAK1 or Flag-PAK1K420R or Flag Flag-PAK1K420Q. Representative pictures were presented and quantitation of GFP-LC3 puncta from 10 different images was performed. Scale bar: 0.01 mm. (G) The endogenous PAK1 in LN229 cells was knocked down. Then these cells were reintroduced with WT Flag-PAK1 or Flag-PAK1K420Q mutant were subjected to hypoxia or not. Then immunoprecipitation analysis with indicated antibodies was performed. (H) The endogenous PAK1 in LN229 cells was knocked down. Then these cells were reintroduced with WT Flag-PAK1 or Flag-PAK1K420Q and were subjected to hypoxia or not. Western blots were performed as indicated
Then we investigated the effect of PAK1K420 acetylation on autophagy in GBM cells. We observed that compared with WT counterpart, PAK1K420R significantly upregulated SQSTM1 but decreased LC3B-II and the number of LC3 puncta LN229 cells with endogenous PAK1 deficiency under hypoxia (Figure 7E,F). Consistent with the above findings, the reintroduction of an acetylation-mimic mutant PAK1K420Q significantly promoted the association of PAK1 with ATG5, SQSTM1 degradation, LC3B-II level, and autophagosome formation in endogenous PAK1-deficient LN229 cells even under normoxia (Figure 7F-H). Figure 4D,H demonstrated that PAK1K420R could not phosphorylate ATG5 at T101, and Figure 5C indicated that PAK1K420R impaired the stability of ATG5 compared with WT PAK1. Therefore, PAK1 (K420) acetylation promotes the interaction of PAK1 with ATG5 and autophagy initiation in the hypoxia-treated GBM cells.
ELP3 is identified as an acetyltransferase of PAK1 in response to hypoxia
We generated one siRNA library with two siRNAs against 19 human KAT genes to search for potential lysine acetyltransferase (KAT), which was responsible for PAK1 acetylation in hypoxia-treated GBM cells. We found that knockdown of ELP3 but not the other KATs significantly decreased hypoxia-induced acetylation level of endogenous PAK1 without changing its protein expression in LN229 cells (Figure 8A,B). Conversely, co-overexpression of HA-ELP3 but not acetyltransferase-dead ELP3Y529A mutant with Flag-PAK1 increased the levels of PAK1 acetylation in hypoxia-treated U87 cells (Figure 8C) [16]. Although KAT2B (lysine acetyltransferase 2B) is an acetyltransferase that acetylates diverse histone and non-histone substrates [17], KAT2B did not acetylate PAK1, indicating that PAK1 is a specific acetylation substrate of ELP3 (Figure 8C). We also found that ELP3-mediated acetylation of PAK1 was dose-dependent in U87 cells (Figure 8D). Notably, we also identified ELP3 as an interactor of PAK1 using the BioID2 method in U87 cells (Figure 4A). Together, these results suggest that ELP3-mediated acetylation regulated PAK1.
Figure 8.
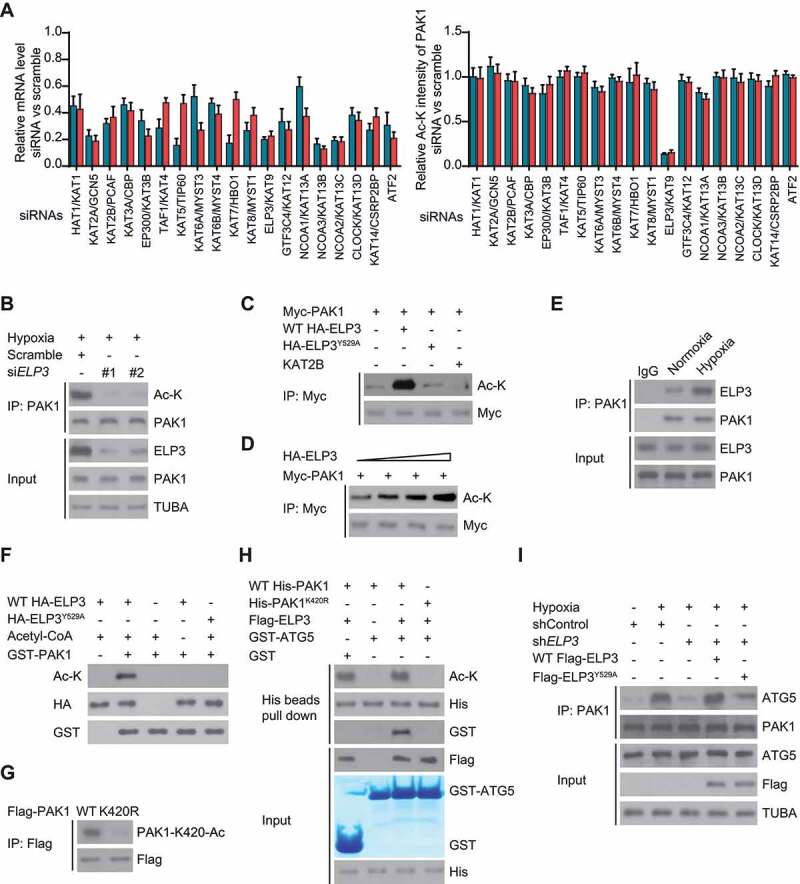
ELP3 is identified as an acetyltransferase of PAK1 in response to hypoxia. (A) One siRNA library with two siRNAs against each of 19 human KAT genes was generated. Each siRNA was transiently transfected into LN229 cells, and the mRNA level of KAT genes was determined by quantitative real-time PCR (left panel). LN229 cells transfected as described were subjected to hypoxia and then harvested for immunoprecipitation with PAK1. Then western blotting was used to detect the acetylation level of PAK1. Band intensity of Ac-K was quantified (right panel). (B) Two different siRNAs targeting ELP3 were transiently transfected into hypoxia-treated LN229 cells. The acetylation level of endogenous PAK1 was determined. (C) ELP3 overexpression increased PAK1 acetylation. Indicated plasmids were transiently co-overexpressed in U87 cells under hypoxia, and PAK1 protein was purified by IP, the acetylation level was determined by western blot. (D) PAK1 with an increasing dose of ELP3 were co-transfected into U87 cells under hypoxia. Acetylation assessment of PAK1 was performed with an Ac-K antibody. (E) Association of endogenous ELP3 with endogenous PAK1 in LN229 cells. PAK1 was immunoprecipitated from LN229 cells treated with or without hypoxia, and the precipitates were analyzed using anti-ELP3. (F) In vitro acetylation assays using purified GST-PAK1 and HA-tagged WT-ELP3 or ELP3Y529A. (G) Flag-tagged PAK1 or PAK1K420R mutant was expressed in U87 cells with ELP3 overexpression. Acetylation assessment was performed with a special PAK1-K420-Ac antibody produced by this group. (H) Ni-NTA agarose beads were used to immobilize purified WT His-PAK1 or His-PAK1K420R. Then these beads were mixed with or without Acetyl-CoA and WT Flag-ELP3, GST or GST-ATG5 to perform the affinity-isolation assay. (I) The endogenous ELP3 in LN229 cells was knocked down. Then these cells were reintroduced with WT Flag-ELP3 or Flag-ELP3Y529A mutant were cultured under hypoxia for 30 min. Immunoprecipitation analysis was performed
Moreover, we indeed detected a co-immunoprecipitation of endogenous ELP3 with endogenous PAK1 from LN229 cells, which was enhanced by hypoxia (Figure 8E). Further, in vitro acetylation assay indicated that WT ELP3 acetylated GST-PAK1, but not ELP3Y529A (Figure 8F), indicating that PAK1 was a direct ELP3 substrate.
We co-transfected WT Flag-PAK1 or PAK1K420R mutant with ELP3 into U87 cells to validate that K420 might be an ELP3-mediated acetylation site of PAK1. Acetylation assessment with a special PAK1-K420-Ac antibody affirmed that K420 was the major acetylated residue (Figure 8G).
Next, we determined the effect of ELP3-mediated K420 acetylation on the binding of PAK1 to ATG5. Figure 8H indicated that only in the presence of WT-ELP3, there were more GST-ATG5, which interacts with WT His-PAK1 but not to His-PAK1K420R. In addition, knockdown of ELP3 significantly impaired the binding of PAK1 to ATG5, which was reverted by reintroducing WT ELP3, not ELP3Y529A mutant in LN229 cells (Figure 8I).
Elp3-mediated K420 acetylation activates PAK1 by decreasing PAK1 dimerization and promoting T423 phosphorylation
Because of a conformational conversion from dimer to monomer activated PAK1 [18], we determined the impact of ELP3 on PAK1 dimerization. To test the idea, we co-expressed WT ELP3 or ELP3Y529A with GFP- and Flag-tagged PAK1. We found that ELP3Y529A did not block the binding of differently tagged PAK1 (Figure 9A). However, WT ELP3 significantly impaired the binding of differently tagged WT PAK1 but not PAK1K420R mutant (Figure 9B). Consistently, crosslinking assays demonstrated that silencing ELP3 enhanced the conversion of endogenous PAK1 from active monomers to inactive dimers in LN229 cells (Figure 9C). Re-expressing WT ELP3, but not ELP3Y529A, restored the conversion of PAK1 from monomer to dimer in LN229 cells with ELP3 deficiency (Figure 9D).
Figure 9.
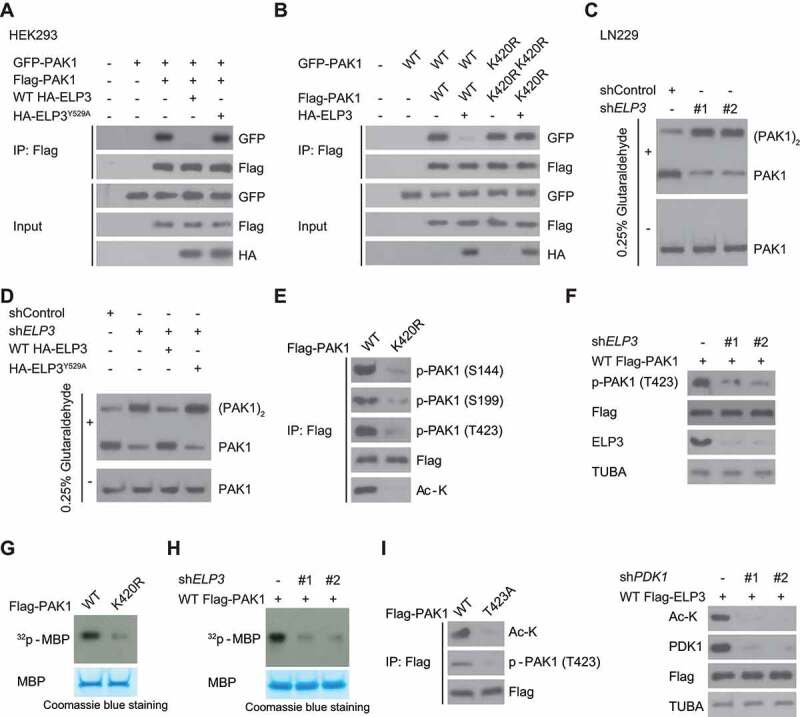
ELP3-mediated K420 acetylation activates PAK1 by decreasing PAK1 dimerization and promoting T423 phosphorylation. (A) WT ELP3, but not its inactive Y529A mutant, suppressed the association of differently tagged PAK1 subunits. WT HA-ELP3 or its catalytic-inactive mutant Y529A was co-expressed with GFP- and Flag-PAK1 in HEK293 cells. Western blot was used to determine the interaction between Flag- and GFP-PAK1. (B) ELP3 co-expression in U87 cells decreased the association of differently tagged WT-PAK1 but not the K420R mutant. Flag- and GFP-tagged PAK1 (WT or K420 R mutant) were co-expressed with or without HA-tagged ELP3. Western blot was used to determine the interaction between Flag- and GFP-PAK1. (C) ELP3 was stably knocked down in LN229 cells using two independent shRNAs. Then these cells were subjected to 0.025% glutaraldehyde treatment. The endogenous PAK1 was immunoprecipitated from LN229 cells, and western blots were used to analyze the levels of monomeric and dimeric PAK1. (D) ELP3 was stably knocked down in LN229 cells. Then these cells were reintroduced with WT-ELP3, or its Y529A mutant and subjected to 0.025% glutaraldehyde treatment. The endogenous PAK1 was immunoprecipitated from LN229 cells, and western blots were used to analyze the levels of monomeric and dimeric PAK1. (E) U87 cells were transfected with WT Flag-PAK1 or PAK1K420R and then subjected to hypoxia. Western blots were performed using indicated antibodies. (F) U87 cells were transfected with ELP3 shRNA and then subjected to hypoxia. Western blots were performed to analyze the T423 phosphorylation of Flag-PAK1. (G and H) In vitro phosphorylation assay. Flag-PAK1 was immunoprecipitated with an anti-Flag antibody from cell extracts in (E and F). Then myelin basic protein (MBP) was used to examine the kinase activity of PAK1 as a phosphorylation substrate. (I) the acetylation levels of K420 of WT Flag-PAK1 or PAK1T423A were determined using immunoblots in hypoxia-treated U87 cells or LN229 cells with or without PDK1 knockdown
It has also been shown that T423 phosphorylation of PAK1 is required for its activity, which is catalyzed by PDK1 (pyruvate dehydrogenase kinase 1) in a GTPase-independent manner [19]. Given that the K420 was very close to T423 residue, we hypothesized that ELP3-mediated K420 acetylation might affect the T423 phosphorylation of PAK1. As expected, PAK1K420 R mutation or ELP3 knockdown not only inhibited phosphorylation of T423 residue in U87 cells (Figure 9E,F) but also reduced PAK1 kinase activity (Figure 9G,H). Unexpectedly, PAK1T423A mutation or PDK1 knockdown also significantly inhibited hypoxia-induced K420 acetylation in LN229 cells (Figure 9I), suggesting crosstalk between K420 acetylation and T423 phosphorylation in maintaining PAK1 activation.
Since the autophosphorylation of several specific sites such as S144 and S199 increased PAK1 activity [20], we examined whether K420 acetylation affects these residues’ phosphorylation of PAK1. Figure 9E indicated that the phosphorylation of these residues was impaired by PAK1K420R mutation, suggesting that ELP3-mediated K420 acetylation is necessary for PAK1 activity.
Together, these data demonstrate that ELP3-mediated K420 acetylation activates PAK1 through suppressing its dimerization and promoting T423 phosphorylation.
SIRT1 deacetylated PAK1 at K420 and suppressed autophagy in GBM cells
Since BioID2 screening identified SIRT1 as an interactor of PAK1 in U87 cells (Figure 4A), we wondered whether SIRT1 mediated the deacetylation of PAK1. As expected, overexpression of WT SIRT1 abolished hypoxia-induced the acetylation of PAK1 in LN229 cells, while a deacetylase-defective SIRT1-363A mutant did not (Figure 10A). Conversely, silencing SIRT1 significantly increased PAK1 acetylation (Figure 10B). In vitro, WT SIRT1 deacetylated PAK1 while the SIRT1-363A mutant did not (Figure 10C). Moreover, overexpression of WT SIRT1 significantly impaired PAK1-K420-Ac in hypoxia-treated LN229 cells while SIRT1-363A mutant did not (Figure 10D). Consistently, nicotinamide (NAM), a SIRT (sirtuin) inhibitor, significantly enhanced the levels of PAK1-K420-Ac in hypoxia-treated U87 cells (Figure 10E). Therefore, we propose that SIRT1 removes the K420 acetylation of PAK1.
Figure 10.
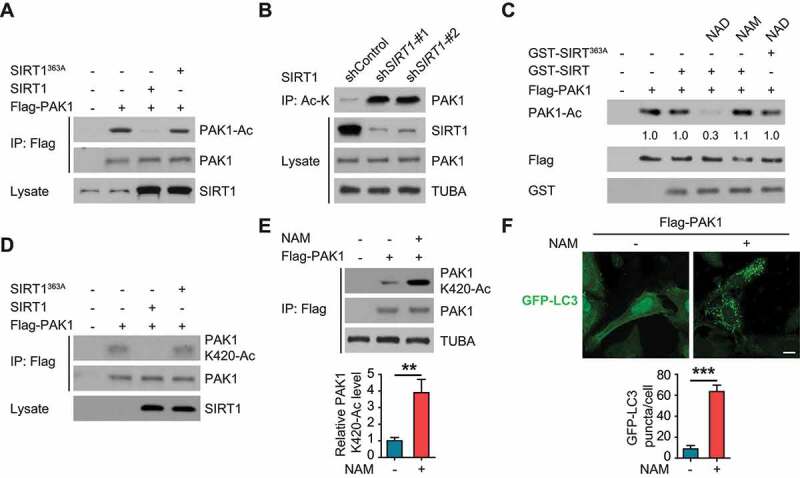
SIRT1 deacetylated PAK1 at K420 and suppressed autophagy in GBM cells. (A) The indicated constructs were transfected into U87 cells which then were treated with hypoxia. The lysates of U87 cells were incubated and immunoprecipitated with Flag beads. Anti-acetyl-lysine (Ac-K) antibody was probed to detect the acetylation of PAK1. (B) Anti-Ac-K antibody was used to perform immunoprecipitation in LN229 cells with or without SIRT1 knockdown. Western blot with anti-PAK1 antibody was performed to detect PAK1 acetylation. (C) Flag beads were used to perform the immunoprecipitation in hypoxia-treated U87 cells with Flag-PAK1 overexpression. Purified WT GST-SIRT1 or GST-SIRT1363A protein then was mixed with the immunoprecipitated complex at 4°C for 4 h, which was subjected to the treatment of nicotinamide (NAM, 200 μM) or nicotinamide adenine dinucleotide (NAD, 50 μM). Then samples were analyzed with immunoblotting to determine the relative levels of PAK1 acetylation. (D) Indicated constructs were overexpressed in U87 cells which then were subjected to hypoxia. U87 cells were lysed and the relative PAK1 (K420) acetylation levels were determined with a special PAK1-K420-Ac antibody. (E) U87 cells were treated with 200 μM NAM for 6 h. Hypoxia-treated U87 cells were lysed and the relative PAK1 (K420) acetylation levels were determined with a special PAK1-K420-Ac antibody. Then the relative expression ratio of PAK1-K420-Ac and PAK1 was quantified as indicated. (F) U87 cells were treated by indicated compound and plasmid, autophagy was examined. Scale bar: 0.01 mm
Consistent with the above data, treatment of NAM upregulated autophagy in U87 cells (Figure 10F).
PAK1-mediated ATG5 phosphorylation at T101 promotes GBM development and relates to a poor prognosis
Next, we examined the effects of PAK1-mediated ATG5 phosphorylation at T101 on GBM development. As expected, the reintroduction of WT ATG5 reverted decrease in the proliferation of LN229 cells with endogenous ATG5 deficiency, and ATG5T101A overexpression did not rescue this inhibition (Figure 11A, left panel). We also observed a similar result when WT PAK1, but not when we reintroduced PAK1K420R into LN229 cells with endogenous PAK1 deficiency (Figure 11A, right panel).
Figure 11.
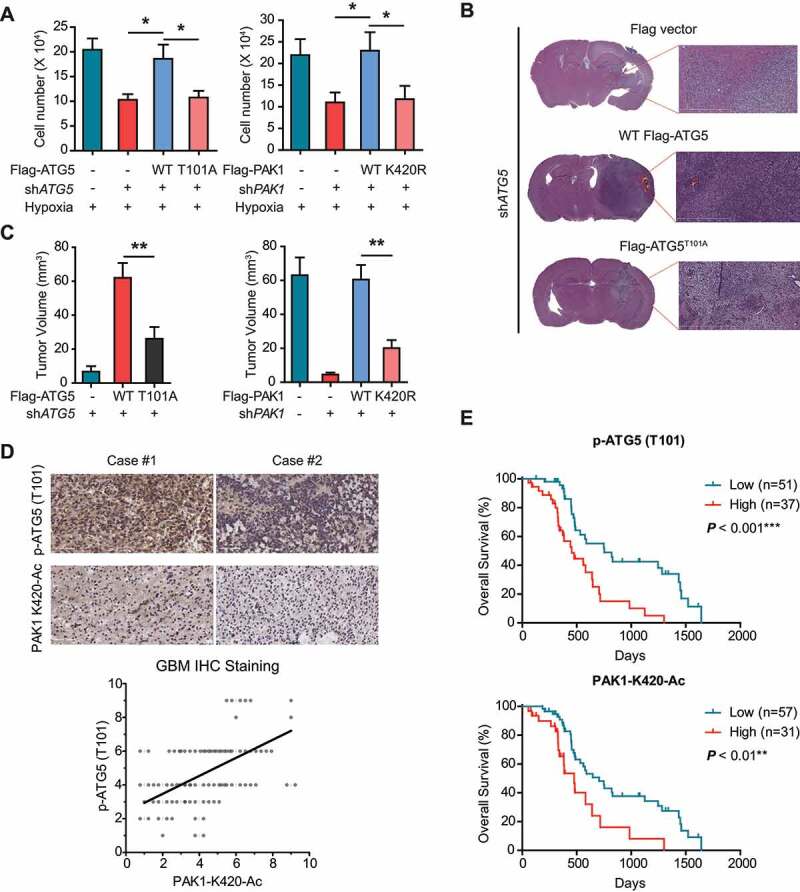
PAK1-mediated ATG5 phosphorylation at T101 promotes GBM development and relates to a poor prognosis. (A) The effects of PAK1 or ATG5 knockdown and reconstituted expression of the indicated plasmids on the proliferation of LN229 cells cultured in hypoxia condition for 3 d using MTT assay. (B and C) The effects of PAK1 or ATG5 knockdown with or without reintroduction of indicated plasmids on GBM growth after LN229 cells were injected into intracranially nude mice (n = 10 per group). And representative images (scale bar, 100 μm) of H&E and tumor volumes were shown. (D) IHC staining of human GBM samples. Scatterplot depicting the indicated levels of PAK1-K420-Ac and p-ATG5 (T101) protein in human GBM (n = 88) by IHC (bottom). Pearson’s correlation coefficient was determined. (E) GBM patients were stratified by ATG5 (T101) phosphorylation (top) or PAK1 (K420) acetylation (bottom). And OS was determined using Kaplan-Meier plots
Consistent with in vitro data, WT ATG5 or WT PAK1 restored GBM growth in vivo which was inhibited by endogenous ATG5 or PAK1 knockdown, respectively (Figure 11B,C). On the contrary, ATG5T101A or PAK1K420R overexpression did not make a difference (Figure 11B,C). Our data strongly indicate that PAK1-phosphorylated ATG5 at T101 is necessary for the development of GBM.
Clinically, it was observed that the phosphorylation levels of ATG5 (T101) were significantly associated with the acetylation levels of PAK1 (K420) in 88 human primary GBM specimens (Figure 11D and Table S2, S3 and S4). And high PAK1 (K420) acetylation or ATG5 (T101) phosphorylation indicated a poor prognosis based on Kaplan-Meier analysis (Figure 11E). These results reveal the important role of PAK1 (K420) acetylation and ATG5 (T101) phosphorylation in the development of human GBM.
Interestingly, we checked the level of p-ATG5 (T101) and acetylated PAK1 in LN229 cells under HBSS treatment. We found that HBSS treatment significantly induced both ATG5 (T101) phosphorylation and PAK1 acetylation (Fig. S7A and B). We also checked the level of p-ATG5 (T101) and acetylated PAK1 in a hepatocellular carcinoma cell line (MHCC97 H cells) under hypoxia treatment. We found a similar change (Fig. S7 C and D). These findings might indicate a general observation.
Discussion
The primary findings in this study are that: (i) PAK1 is significantly upregulated and promotes the development of GBM, (ii) Analysis of CGGA and TCGA data indicates that the oncogenic role of PAK1 in GBM is associated substantially with autophagy, (iii) hypoxia promotes of ELP3-mediated acetylation of PAK1 at K420, which suppresses the dimerization of PAK1 and enhances its activity, thereby leading to subsequent PAK1-mediated ATG5 phosphorylation at T101, (iv) ATG5-T101 phosphorylation protects ATG5 from ubiquitination-dependent degradation and significantly increases the affinity between ATG12–ATG5 complex and ATG16L1, (v) ELP3-dependent PAK1 acetylation at K420 and PAK1-mediated ATG5 (T101) phosphorylation are required for hypoxia-induced autophagy and brain tumorigenesis by promoting autophagosome formation, (vi), under normoxia, PAK1 is deacetylated at K420 by SIRT1, (vii) Silencing PAK1 with shRNA or small molecular inhibitor FRAX597 potently blocked autophagy and GBM growth, (viii) Clinically, the levels of PAK1 (K420) acetylation significantly correlate with ATG5 (T101) phosphorylation, and both of them were two markers predictive of poor clinical outcomes in patients with GBM. Together, these findings propose that PAK1 is an essential regulator in the autophagy pathway in GBM, suggesting novel potential therapeutic targets for this disease treatment.
It is well-known that post-translational modifications regulate almost all ATGs. For example, we recently reported that SMURF1 ubiquitinated UVRAG at lysine residues 517 and 559 [21]. We also reported that balanced methylation and phosphorylation of ATG16L1 protein was critical for autophagy maintenance in hypoxia-treated cardiomyocytes [2]. Herein, we reported a new regulatory mechanism for another critical autophagy related protein, ATG5, to control the autophagic process in response to hypoxia. Although we cannot exclude the potential participation of other protein kinases, herein, our data identified PAK1 as an ATG5 (T101) phosphorylation-responsible kinase. It has been proposed that ATG5 has many putative phosphorylation sites based on previously individual mass-spectrometry analyses, and another study previously reported phosphorylation of ATG5 at T75 [12]. Given that extensive hypoxic regions in GBM contribute to the highly malignant phenotype of this tumor, we explored the effect of hypoxia on PAK1 and ATG5 post-translational modifications. We found that under hypoxia, ATG5 (T75) phosphorylation was not affected; however, ATG5 (T101) phosphorylation and PAK1 (K420) acetylation became upregulated. For the first time, these findings suggest a selective and spatial regulation of ATG5 activity that is background-dependent.
Furthermore, different from mitogen-activated protein kinase MAPK14 (p38α)-mediated ATG5 (T75) phosphorylation, which impairs autophagosome-lysosome fusion and thus autophagy [12], PAK1-mediated ATG5 (T101) phosphorylation enhanced autophagosome formation but not inhibited the later phase of autophagy induction. Notably, our MS/MS also found an additional six phosphorylation sites of ATG5 except T101 (Table S5). Although possible ATG5 phosphorylation at these sites did not show an apparent role in the autophagic process, they might participate in the regulation of other ATG5 functions. This hypothesis awaits substantiation in future studies, which may lead to critical new insights into the ATG5 signaling network in both normal and cancer cells.
The ATG12–ATG5-ATG16L1 complex has been shown to drive the insertion of lipidated LC3 into the double-membrane phagophore, which is a hallmark of macroautophagy [22]. Although we previously reported that balanced methylation and phosphorylation of ATG16L1 protein was critical for the ATG12–ATG5-ATG16L1 complex [2], other factors dictating ATG16L1 recruitment to phagophores is still completely unknown. Given that the N-terminal domain of ATG16L1 contains an N-terminal domain associated with ATG5 [23], we, therefore, investigated the possibility that ATG5 phosphorylation at T101 regulates the ATG12–ATG5-ATG16L1 complex. For the first time, we found that ATG5 phosphorylation at T101 enhanced the affinity of this complex, providing novel insights into the underlying molecular mechanisms about autophagy regulation.
So far, the role of autophagy in cancer is thought of as having two faces, a “Janus”-like duality [24]. Autophagy, in the early phases of cancer development, plays a role as a tumor suppressor [25]. At later stages, autophagy supports the proliferation of tumor cells by supplying much-needed energy to adapt to metabolic stresses such as hypoxia or nutrient deprivation [26]. Then what could be the physiological role for autophagy regulation by PAK1 in GBM? Our data indicate that upon PAK1 acetylation and activation, hypoxia-induced autophagosome numbers significantly increase and are necessary for GBM development. At first glance, this finding is surprising because this result stands in contrast with the previous report: PAK1 activation in breast cancer inhibits autophagy by activating the PI3K-AKT-MTOR pathway, which has been known to inhibit autophagy [27]. How to explain this difference? This situation is reminiscent of another kinase, PGK1 (phosphoglycerate kinase 1). Although PGK1 activates the AKT-MTOR Pathway, it promotes autophagy in GBM [28]. Interestingly, similar to PAK1, PGK1 also can be acetylated by EP300/p300 in GBM, which leads to autophagy increase by phosphorylating BECN1/Beclin1 at S30 [29]. Therefore, we propose that the different effects of PAK1 on the autophagy in breast cancer and GBM indicates that its function might be background-dependent. Thus, our work provides first insights into a unique role of PAK1 in GBM, especially showing a selective and spatial regulation of ATG5 activity through ELP3-mediated PAK1 activation.
It is also well-known that two major events dictate PAK1 activation: 1) a PAK1 dimer conversion to a monomer, relieving an autoinhibition [18]; and 2) phosphorylation at specific residue such as T423 phosphorylation for full activation of PAK1 [20]. A previous study indicated that casein kinase 2 (CSNK2)-mediated S223 phosphorylation of PAK1 promoted the activation of PAK1 by promoting AKT-mediated phosphorylation of T423, which bypasses the requirement for GTPases [18]. Herein, our study uncovered another novel regulatory step for PAK1 activation. Based on our observations, we surmised that ELP3-mediated PAK1 acetylation at K420 could promote PAK1 activation by priming T423 phosphorylation and inhibiting its dimerization. We anticipate that the exact role of K420 acetylation in PAK1 activation will be elucidated after a structural analysis is performed.
Notably, by analyzing the public Oncomine database, we found that the genomic DNA of PAK1 is also frequently amplified in the colorectal, colon, and pancreatic cancers (Fig. S7). Based on our findings in GBM, it is tempting to speculate that PAK1-mediated autophagic pathway by phosphorylating ATG5 might similarly be involved in CRC and GC carcinogenesis. If this is the case, these results will support the notion that PAK1 does not selectively promote GBM only and may have a universal effect on the cancers from the digestive system. Future studies are required to explore the potential therapeutic benefit of targeting PAK1 in diverse tumor types.
In summary, we define that ELP3-dependent PAK1 acetylation and PAK1-mediated phosphorylation of ATG5 (T101) is necessary for the initiation of autophagy and GBM development. This novel link between the PAK1 and ATG5-mediated autophagy provides the foundation for the application of PAK1 and autophagic inhibitors as a therapeutic strategy for GBM in the future.
Material and methods
Human GBM samples and RNA-sequencing data
Clinical information of GBM patients and corresponding mRNA microarray data were retrospectively from the database of Chinese Glioma Genome Atlas (CGGA) openly available from www.cgga.org.cn. RNA-seq data and messenger RNA microarray data downloaded from The Cancer Genome Atlas (TCGA) were obtained for validation. In this study, tissue samples of all GBM patients and corresponding non-tumor samples were collected from 2012 to 2017 at Tiantan Hospital, Capital Medical University and Guilin Medical University. The ethics of this project were passed by the Capital Medical University and affiliated Hospital, Guilin Medical University Institute Research Ethics Committee. Each participant signed informed consent. All glioma tissues from affiliated Hospitals were histopathologically confirmed to be glioblastomas (GBM, WHO IV). The date of the last follow-up examination or initial diagnosis until death was used to calculate overall survival (OS) and correlation analysis.
Bioinformatics analysis
To explore the biological implication of PAK1 in GBM, PAK1-positively-associated genes were screened using the Pearson Correlation algorithm. Genes with Coefficient larger than 0.4 and P value less than 0.05 were selected for GO analysis. DAVID analysis (http://david.abcc. ncifcrf.gov/home.jsp) was performed for gene ontology (GO) assays to get functional annotation of the genes, which were upregulated in high-risk patients. Cytoscape and Revigo were performed to visualize significant biological process networks.
In vivo ubiquitination
Indicated constructs were transfected into indicated cells for 48 h. Before collecting these cells, 5 μg/ml MG132 (Selleckchem, S2619) was added and incubating about 4 h. Then cells were lysed in denaturing buffer containing 0.1 M NaH2PO4, Na2HPO4, 6 M guanidine-HCl, 10 mM imidazole, 400 mM Tris-HCl, pH 8.0. These lysates were mixed with nickel beads (Qiagen, 30,210) for 3 h in the cold room. Finally, immunoblotting was performed with the indicated antibodies.
Recombinant protein expression, purification, and GST affinity-isolation assay
As previously described [30], Escherichia coli was used to express GST-fusion proteins such as GST-tagged ATG16L1 from pOPTG (provided by Dr. HW Song from Shanghai Jiaotong University). Then IPTG (1 mM, 6 h) induced their expression. Glutathione-Sepharose 4B beads purchased from GE Healthcare (17,075,601) were used to purify proteins. PAK1 purification was reported before [31]. GST-tagged proteins (approximately 10 μg) were cross-linked by dimethyl pimelimidate dihydrochloride (Sigma-Aldrich, D8388) to glutathione-Sepharose in reaction buffer, pH 8.0. After elution with sample buffer, Coomassie Brilliant Blue staining and western blot were used to analyze the samples.
The ATG12–ATG5 conjugate was produced in E. coli Rosetta pLySS (Novagen, 70,956–3) by co-expression of hexahistidine-tagged ATG5 and ATG12 cloned on pETDuet-1 (Novagen, 71,146–3) with ATG7 and ATG10 cloned on pCOLADuet-1 (Novagen, 71,406–3), which resulted in the formation of the Atg12–Atg5 conjugate in E. coli. As previously reported [2,32], E. coli Rosetta pLySS was grown. Then 1 mM IPTG (Sigma-Aldrich, I6758) was added to induce E. coli growth for 4 h at 37°C to an OD600 = 0.8. Then cells were resuspended bacteria in resuspension buffer (50 mM HEPES [Sigma-Aldrich, H3375], 10 mM imidazole [Sigma-Aldrich, CI2399], 300 mM NaCl, pH 7.5, 1 mM MgCl2, 2.5 mM Pefablock [Roth, 11,429,868,001], 2 mM 2-mercaptoethanol [Sigma-Aldrich, M6250], 5 µg/ml DNase [Sigma-Aldrich, D5025]). Then one step-wise imidazole gradient (0–250 mM) and a HisTrap column (GE Healthcare, 17-5247-01) were employed to elute proteins. Finally, a 16/60 S200 size exclusion column (GE Healthcare, 17-1069-01) and Amicon Ultra centrifugal filter (MM cutoff 30 kDa; Sigma-Aldrich, Z717185) were used to concentrate and purify the proteins.
Identifying PAK1-binding proteins, acetylation, and phosphorylation sites by mass spectrometry
BioID2-Based Screening was used to identifying PAK1-binding proteins as described previously [9]. Briefly, myc-BioID2-PAK1 or myc-BioID2 was stably transfected into U87 cells (American Type Culture Collection, HTB-14). 50 mM biotin (Pierce, 29,129) was added into the medium of these cells for 2 d. Then proteins were extracted by spinning and keeping supernatant. Biotinylated proteins were purified by using AssayMap streptavidin cartridges (Agilent, G5496-60,010). Finally, the LC-MS/MS analysis was carried out. The sites of ATG5 phosphorylation and PAK1 acetylation were identified as described previously [30].
In vitro kinase assay
Recombinant PAK1 protein (1 μg) and purified WT-ATG5 or its mutant proteins were mixed with a 1x reaction buffer containing 0.2 mM Na3VO4, and 10 μCi γ-32P ATP (PerkinElmer, NEG002A100UC). And the reaction proceeded for 15 min at 30°C. Then the mixtures were separated and incorporated [γ-32P] radioisotope was detected by imaging plate-autoradiography system .
Co-immunoprecipitation
As described [33], the indicated antibodies were added to the 500 μg of pre-cleared samples and were rotated at 4°C for about 8 h. Then A&G beads (Santa Cruz Biotechnology, sc-2003) were mixed with samples for 3 h. Finally, the immunoprecipitation complexes were subjected to blot analysis.
Western blot
Samples were collected using lysis buffer RIPA, as previously described [34]. BCA protein reagent (Pierce) was used to measure protein concentration. Denaturing 10% SDS-polyacrylamide gel (RPI Corp, 151-21-3) electrophoresis separated all samples which were then transferred to the PVDF (Roche, 3010040001) membrane. After blocked using TBST containing 5% milk (Bio-Rad, 1706404) for 1 h, indicated primary antibody was added on PVDF membranes in cold room overnight. Then adding secondary antibody and using enhanced chemiluminescence (Thermo Fisher Scientific, 32106) to visualize blots. Finally, the blots were scanned and the densities of immunoreactive bands were quantified using Image Lab software (Bio-Rad). Quantitative data were first normalized with internal control and then analyzed using linear regression of protein amount.
GFP-LC3 puncta
As described previously, briefly, GFP-LC3 plasmid (Addgene, 11546; deposited by Karla Kirkegaard) was transfected into indicated cells for 24 h. After fixation in 3.7% paraformaldehyde, a laser-scanning confocal microscope from LEICA TCS SP2 was utilized to count GFP-LC3 puncta number.
Cell culture, reagents, and antibodies
HEK293 T and brain tumor cell lines (HA, H4, U87, U251, U118, LN229, A172, and SNB19) were provided by American Type Culture Collection (CRL-1573, HTB-148, HTB-14, HTB-15, CRL-2611, CRL-1620, CRL-2219), or as a gift from Dr. Bing Wang at Rutgers University. DAPI (D9542-1 MG) and 3-MA (M9281-100 MG) were purchased from Sigma. Fetal bovine serum (FBS) and mediums for cell culture were from Sigma and Invitrogen, respectively (Sigma-Aldrich, F7524 and Invitrogen, 11,965–084). Protease inhibitor cocktail was obtained from Santa Cruz Biotechnology (sc-29,130). Lipofectamine 2000, PBS, and antibiotics were purchased from Invitrogen (11,668,019, 10,010,023, 15,140,163), while Sigma provided Tween 20 (P9416) and X-ray films. Site-Directed Mutagenesis Kit (Agilent, 200,523) was QuikChange II. The antibodies were as follows: anti-ATG12–ATG5 (Creative Biomart, CPBT-66438RA), anti-LC3B (Sigma-Aldrich, SAB4200361), anti-MYC (Roche Applied Science, 11,667,149,001), anti-PAK1 (Cell Signaling Technology, 2602), anti-glutathione S-transferase (GST) antibody (Abcam, ab19256), anti-ATG5 (Proteintech Group, 10,181-2-AP), anti-Flag M2-conjugated agarose was from Sigma (F2426), anti-ATG5 (Santa Cruz Biotechnology, sc-133,158), anti-His (Abcam, ab18184), anti- SQSTM1 (Proteintech Group, 18,420-1-AP), anti-GAPDH (Abcam, ab9485), MYC/c-Myc (Abcam, ab39688), phosphoserine (Abcam, ab9332), anti-ATG16L1 (Cell Signaling Technology, 8089), antibody against p-PAK1 (T423) (Cell Signaling Technology, 2601), anti-TUBA (Abcam, ab6046), anti-phosphothreonine (Abcam, ab9337), anti-phosphotyrosine (Abcam, ab10321), anti-phosphoserine/threonine (Abcam, ab17464), anti-pan-acetyllysine antibody (Abcam, ab61257), secondary antibodies (Bio-Rad, 1,706,515 and 1,706,516), anti-Ac-K (MyBioSource, MBS2542018), p-ATG5 (T101) specific antibodies were made by this lab using the similar methods as described previously [14]. To generate acetyl-lysine 420 specific antibody of PAK1, synthetic peptide FGFCAQITPEQSK was coupled to KLH as an antigen to immunize rabbit as described previously [35].
Transfection, constructs, shRNA, and siRNA
For shRNA transfection, 6-well plates were used to culture LN229 and U251 cells overnight prior to transfection (about 2 × 10⁵ cells/well). As previously reported [33], they were transduced with two different shRNAs or shcontrol with lentiviruses particles at a multiplicity of infection (MOI) about 1. About two weeks of puromycin selection later, stable polyclonal GBM cell lines were established. Oligofectamine (12,252–011) was purchased from Invitrogen Life Technologies for siELP3, siATG5, or scramble negative control (Invitrogen) transfection following the protocol. Immunoblots were used to determine the efficiency of knockdown at 2 d after transfection. pLV-H1-puro vector was purchased from biosettia (SORT-B19), then designed shRNA oligos were cloned into this vector. We chose two different shRNAs (#1 and #2) against each target gene (PAK1, ATG5, ELP3), in which #2 was designed to target 3ʹ-UTR so that target gene can be reintroduced later. ShPAK1-#1: 5′- GGATTCTGTGCACAGATAA-3′; shPAK1-#2: 5′- GCCTCTGCAGCACAAATTTC-3′; shATG5-#1: 5′- GCCATCAATCGGAAACTCATGGAATATCC-3′; shATG5-#2: 5′- GCCTGTCAAATCATAGTAT-3′; shELP3-#1: 5′- GGGAAACATTCTTGTCATA-3′; shELP3-#2: 5′- GGAGCGCAAGTTAGGAAAA-3′; shcontrol: 5′- CCGGGCGCGATAGCGCTAATAATTTCT-3′. Two siELP3 were purchased from SignalChem (K318-911-05) and Dharmacon (E-015940-00-0005), respectively. siATG5 were purchased from ABM Inc (i001535); Scramble: 5ʹ- GTCCCGGATACCTAATAAA-3ʹ. WT-PAK1, PAK1T423E, ATG5, and ATG16L1 plasmids were from Addgene: WT-PAK1 and PAK1T423E (Addgene, 12,209 and 12,208; deposited by Jonathan Chernoff), ATG5 (Addgene, 22,948; deposited by Noboru Mizushima), FLAG-ATG16L1 constructs (Addgene, 24302; deposited by Noboru Mizushima). ELP3 constructs were purchased from Origene (RG201491). Mutants or truncated fragments from different genes were constructed as described previously [14]. And sequencing was used to verify the resulting mutants.
Polymerase chain reaction
TRIzol (Thermo Fisher Scientific, 15596026) was purchased to purify indicated RNA from GC cells or GC tissues. Then, random primers and a Reverse Transcription Kit (Invitrogen, K1691) were purchased to reversely transcribed total RNA into the complementary DNA (cDNA). Subsequently, RT-PCR was finished by Applied Biosystems. Invitrogen synthesized primers for the respective genes. The relative levels of indicated proteins were analyzed through the 2− ΔΔCt method. The endogenous control is GAPDH. All primer sequences are: PAK1, 5ʹ- 5ʹCCCCTCCGATGAGAAACACC3ʹ-3ʹ and 5ʹ-CTGGCATCCCCGTAAACTCC3 − 3ʹ; ATG5, 5′- TTTGCATCACCTCTGCTTTC −3′ and 5′ -TAGGCCAAAGGTTTCAGCTT-3′; ELP3, 5ʹ- TACCTGAGGATTACAGAGAC-3ʹ and 5ʹ- CTCTCTCCAGTCCCATGTT-3ʹ; GAPDH, 5′-GCCCAATACGACCAAATCC-3′ and 5′-CACCACATCGCTCAGACAC-3′.
In vitro acetylation assays
As described previously [36], GST-PAK1 beads were incubated with 0.2 μg of ELP3 and 0.25 μCi [3 H]acetyl coenzyme A (CoA) (PerkinElmer, NET290050UC) in 30 μl buffer (pH 8.0) including 0.1 mM EDTA (Thermo Scientific, AM9262), 1 mM PMSF (Thermo Scientific, 36,978), 5% glycerol, 1 mM DTT, 50 mM Tris, 10 mM sodium butyrate, and 50 mM KCl at 30°C. 30 min later, the samples were analyzed by immunoblotting and acetylation activity was observed by autoradiography.
CCK-8 assay
The CCK-8 kit (BOSTER, AR1160) was purchased to measure the viability of GBM cells by following the manufacturer’s instructions. LN229 cells were plated and transfected with indicated plasmid in 96-well plates. Then, at different time points, adding 10 μl of CCK-8 reagent into the medium. After incubation at 37°C for 3 h, an EnSpire TM 2300 Multilabel Reader was used to measure cell viability at 450 nm according to the instruction from Perkin Elmer. At least using six replicates for each condition.
MTT assay
Briefly, about 1 × 10⁴ cells were cultured in the 12-well plates. The indicated construct was transfected for 3 d. Then at 37°C, 1 ml of MTT (Sigma-Aldrich, M5655) was used to treat indicated GBM cells for 30 min, as described previously [37]. And 1 ml acidic isopropanol was added. At 595 nm, the absorbance was analyzed with background subtraction at 650 nm.
Mice xenograft experiments
Following NIH guidelines and the universities’ policies made by the Institutional Animal Committee, mice experiments were performed. Animal protocols were approved. As described before [38], for in vivo brain tumor growth experiments, 5 μl indicated GBM cells (1 × 10⁶ per mice) were intracranially injected into nude mice (n = 10 per group). All mice were imaged with a small animal MR scanner (General Electric). After 28 d, the tumor was collected and analyzed as indicated.
Statistics
The results from the two groups were measured and analyzed utilizing Student’s t-test. As comparing data from the groups greater than two, we used one-way ANOVA. To analyze the growth curves, we used Two-way ANOVA. Pearson correlation analysis was used to elucidate the correlation of two proteins. Program for GraphPad Prism5, R software package (version 3.0.0), and Social Sciences software 20.0 (SPSS) were used. Determining Kaplan-Meier data needed the log-rank test. Data were reported through mean ± SD, at least carried out in triplicate. *P < 0.05 was thought as significant statistically. **P < 0.01 and ***P < 0.001 represented very significant. # marked no significance.
Supplementary Material
Acknowledgments
This work was supported by grants from National Natural Science Foundation of China (81560582, and 81702387), Natural Science Foundation of Guangxi (2016GXNSFAA380324), The Science and Technology Foundation of Shenzhen (JCYJ20170412155231633, JCYJ20180305164128430), the Shenzhen Economic and Information Committee “Innovation Chain and Industry Chain” integration special support plan project (20180225112449943), the Shenzhen Public Service Platform on Tumor Precision Medicine and Molecular Diagnosis, the Shenzhen Cell Therapy Public Service Platform. Shanghai Research Project(18ZR1432400), Shanghai University of Medicine&Health Sciences Seed Fund (SFP-18-21-16-001, SFP-18-20-16-006).
Disclosure Statement
The authors declare no competing financial interests.
Supplementary Material
Supplemental data for this article can be accessed here.
References
- [1].Xie Y, Kang R, Sun X, et al. Posttranslational modification of autophagy-related proteins in macroautophagy. Autophagy. 2015;11(1):28–45. [DOI] [PMC free article] [PubMed] [Google Scholar]
- [2].Song H, Feng X, Zhang M, et al. Crosstalk between lysine methylation and phosphorylation of ATG16L1 dictates the apoptosis of hypoxia/reoxygenation-induced cardiomyocytes. Autophagy. 2018;14(5):825–844. [DOI] [PMC free article] [PubMed] [Google Scholar]
- [3].Hurley JH, Young LN.. Mechanisms of autophagy initiation. Annu Rev Biochem. 2017;86:225–244. [DOI] [PMC free article] [PubMed] [Google Scholar]
- [4].Wesselborg S, Stork B. Autophagy signal transduction by ATG proteins: from hierarchies to networks. Cell Mol Life Sci. 2015;72(24):4721–4757. [DOI] [PMC free article] [PubMed] [Google Scholar]
- [5].Shin YJ, Kim EH, Roy A, et al. Evidence for a novel mechanism of the PAK1 interaction with the Rho-GTPases Cdc42 and Rac. PLoS One. 2013;8(8):e71495. [DOI] [PMC free article] [PubMed] [Google Scholar]
- [6].Parvathy M, Sreeja S, Kumar R, et al. Potential role of p21 activated Kinase 1 (PAK1) in the invasion and motility of oral cancer cells. BMC Cancer. 2016;16(1):293. [DOI] [PMC free article] [PubMed] [Google Scholar]
- [7].Bhat KP, Balasubramaniyan V, Vaillant B, et al. Mesenchymal differentiation mediated by NF-κB promotes radiation resistance in glioblastoma. Cancer Cell. 2013;24(3):331–346. [DOI] [PMC free article] [PubMed] [Google Scholar]
- [8].Kumar D, Nath L, Kamal MA, et al. Genome-wide analysis of the host intracellular network that regulates survival of Mycobacterium tuberculosis. Cell. 2010;140(5):731–743. [DOI] [PubMed] [Google Scholar]
- [9].Le Sage V, Cinti A, Mouland AJ. Proximity‐dependent biotinylation for identification of interacting proteins. Curr Protoc Cell Biol. 2016;73(1):17.19. 1–17.19. 12. [DOI] [PubMed] [Google Scholar]
- [10].Coles LC, Shaw PE. PAK1 primes MEK1 for phosphorylation by Raf-1 kinase during cross-cascade activation of the ERK pathway. Oncogene. 2002;21(14):2236. [DOI] [PubMed] [Google Scholar]
- [11].Licciulli S, Maksimoska J, Zhou C, et al. FRAX597, a small molecule inhibitor of the p21-activated kinases, inhibits tumorigenesis of neurofibromatosis type 2 (NF2)-associated Schwannomas. J Biol Chem. 2013;288(40):29105–29114. [DOI] [PMC free article] [PubMed] [Google Scholar]
- [12].Keil E, Höcker R, Schuster M, et al. Phosphorylation of Atg5 by the Gadd45β–MEKK4-p38 pathway inhibits autophagy. Cell Death Differ. 2013;20(2):321. [DOI] [PMC free article] [PubMed] [Google Scholar]
- [13].Otomo C, Metlagel Z, Takaesu G, et al. Structure of the human ATG12~ ATG5 conjugate required for LC3 lipidation in autophagy. Nat Struct Mol Biol. 2013;20(1):59. [DOI] [PMC free article] [PubMed] [Google Scholar]
- [14].Song H, Pu J, Wang L, et al. ATG16L1 phosphorylation is oppositely regulated by CSNK2/casein kinase 2 and PPP1/protein phosphatase 1 which determines the fate of cardiomyocytes during hypoxia/reoxygenation. Autophagy. 2015;11(8):1308–1325. [DOI] [PMC free article] [PubMed] [Google Scholar]
- [15].Hong X, Song R, Song H, et al. PTEN antagonises Tcl1/hnRNPK-mediated G6PD pre-mRNA splicing which contributes to hepatocarcinogenesis. Gut. 2014;63(10):1635–1647. [DOI] [PubMed] [Google Scholar]
- [16].Stilger KL, Sullivan WJ. Elongator protein 3 (Elp3) lysine acetyltransferase is a tail-anchored mitochondrial protein in Toxoplasma gondii. J Biol Chem. 2013;288(35):25318–25329. [DOI] [PMC free article] [PubMed] [Google Scholar]
- [17].Poux AN, Marmorstein R. Molecular basis for Gcn5/PCAF histone acetyltransferase selectivity for histone and nonhistone substrates. Biochemistry. 2003;42(49):14366–14374. [DOI] [PubMed] [Google Scholar]
- [18].Shin YJ, Kim Y-B, Kim J-H. Protein kinase CK2 phosphorylates and activates p21-activated kinase 1. Mol Biol Cell. 2013;24(18):2990–2999. [DOI] [PMC free article] [PubMed] [Google Scholar]
- [19].Jacobs T, Causeret F, Nishimura YV, et al. Localized activation of p21-activated kinase controls neuronal polarity and morphology. J Neurosci. 2007;27(32):8604–8615. [DOI] [PMC free article] [PubMed] [Google Scholar]
- [20].Mayhew MW, Jeffery ED, Sherman NE, et al. Identification of phosphorylation sites in βPIX and PAK1. J Cell Sci. 2007;120(22):3911–3918. [DOI] [PMC free article] [PubMed] [Google Scholar]
- [21].Feng X, Jia Y, Zhang Y, et al. Ubiquitination of UVRAG by SMURF1 promotes autophagosome maturation and inhibits hepatocellular carcinoma growth. Autophagy. 2019;15(7):1130–1149. [DOI] [PMC free article] [PubMed] [Google Scholar]
- [22].Fletcher K, Ulferts R, Jacquin E, et al. The WD40 domain of ATG16L1 is required for its non‐canonical role in lipidation of LC3 at single membranes. Embo J. 2018;37(4):e97840. [DOI] [PMC free article] [PubMed] [Google Scholar]
- [23].Rai S, Arasteh M, Jefferson M, et al. The ATG5-binding and coiled coil domains of ATG16L1 maintain autophagy and tissue homeostasis in mice independently of the WD domain required for LC3-associated phagocytosis. Autophagy. 2019;15(4):599–612. [DOI] [PMC free article] [PubMed] [Google Scholar]
- [24].Ouyang L, Shi Z, Zhao S, et al. Programmed cell death pathways in cancer: a review of apoptosis, autophagy and programmed necrosis. Cell Prolif. 2012;45(6):487–498. [DOI] [PMC free article] [PubMed] [Google Scholar]
- [25].Mathew R, Karantza-Wadsworth V, White E. Role of autophagy in cancer. Nat Rev Cancer. 2007;7(12):961. [DOI] [PMC free article] [PubMed] [Google Scholar]
- [26].Sun K, Deng W, Zhang S, et al. Paradoxical roles of autophagy in different stages of tumorigenesis: protector for normal or cancer cells. Cell Biosci. 2013;3(1):35. [DOI] [PMC free article] [PubMed] [Google Scholar]
- [27].Dou Q, Chen H-N, Wang K, et al. Ivermectin induces cytostatic autophagy by blocking the PAK1/Akt axis in breast cancer. Cancer Res. 2016;76(15):4457–4469. [DOI] [PubMed] [Google Scholar]
- [28].Zhang Y, Yu G, Chu H, et al. Macrophage-associated PGK1 phosphorylation promotes aerobic glycolysis and tumorigenesis. Mol Cell. 2018;71(2):201–215. e7. [DOI] [PubMed] [Google Scholar]
- [29].Qian X, Li X, Cai Q, et al. Phosphoglycerate kinase 1 phosphorylates Beclin1 to induce autophagy. Mol Cell. 2017;65(5):917–931. e6. [DOI] [PMC free article] [PubMed] [Google Scholar]
- [30].Qu C, He D, Lu X, et al. Salt-inducible Kinase (SIK1) regulates HCC progression and WNT/β-catenin activation. J Hepatol. 2016;64(5):1076–1089. [DOI] [PubMed] [Google Scholar]
- [31].Papakonstanti EA, Stournaras C. Association of PI-3 kinase with PAK1 leads to actin phosphorylation and cytoskeletal reorganization. Mol Biol Cell. 2002;13(8):2946–2962. [DOI] [PMC free article] [PubMed] [Google Scholar]
- [32].Romanov J, Walczak M, Ibiricu I, et al. Mechanism and functions of membrane binding by the Atg5–Atg12/Atg16 complex during autophagosome formation. Embo J. 2012;31(22):4304–4317. [DOI] [PMC free article] [PubMed] [Google Scholar]
- [33].Hong X, Huang H, Qiu X, et al. Targeting posttranslational modifications of RIOK1 inhibits the progression of colorectal and gastric cancers. Elife. 2018;7:e29511. [DOI] [PMC free article] [PubMed] [Google Scholar] [Retracted]
- [34].Zhu Y, Qu C, Hong X, et al. Trabid inhibits hepatocellular carcinoma growth and metastasis by cleaving RNF8-induced K63 ubiquitination of Twist1. Cell Death Differ. 2019;26(2):306–320. [DOI] [PMC free article] [PubMed] [Google Scholar]
- [35].Guan K-L, Yu W, Lin Y, et al. Generation of acetyllysine antibodies and affinity enrichment of acetylated peptides. Nat Protoc. 2010;5(9):1583. [DOI] [PMC free article] [PubMed] [Google Scholar]
- [36].Köenig A, Linhart T, Schlengemann K, et al. NFAT-induced histone acetylation relay switch promotes c-Myc-dependent growth in pancreatic cancer cells. Gastroenterology. 2010;138(3):1189–1199. e2. [DOI] [PMC free article] [PubMed] [Google Scholar]
- [37].Jacquin S, Rincheval V, Mignotte B, et al. Inactivation of p53 is sufficient to induce development of pulmonary hypertension in rats. PLoS One. 2015;10(6):e0131940. [DOI] [PMC free article] [PubMed] [Google Scholar]
- [38].Xiao A, Brenneman B, Floyd D, et al. Statins affect human glioblastoma and other cancers through TGF-β inhibition. Oncotarget. 2019;10(18):1716. [DOI] [PMC free article] [PubMed] [Google Scholar]
Associated Data
This section collects any data citations, data availability statements, or supplementary materials included in this article.


