

ABSTRACT
Nucleophagy, the mechanism for autophagic degradation of nuclear material, occurs in both a macro- and micronucleophagic manner. Upon nitrogen deprivation, we observed, in an in-depth fluorescence microscopy study, the formation of micronuclei: small parts of superfluous nuclear components surrounded by perinuclear ER. We identified two types of micronuclei associated with a corresponding autophagic mode. Our results showed that macronucleophagy degraded these smaller micronuclei. Engulfed in Atg8-positive phagophores and containing cargo receptor Atg39, macronucleophagic structures revealed finger-like extensions when observed in 3-dimensional reconstitutions of fluorescence microscopy images, suggesting directional growth. Interestingly, in the late stages of phagophore elongation, the adjacent vacuolar membrane showed a reduction of integral membrane protein Pho8. This change in membrane composition could indicate the formation of a specialized vacuolar domain, required for autophagosomal fusion. Significantly larger micronuclei formed at nucleus vacuole junctions and were identified as a substrate of piecemeal microautophagy of the nucleus (PMN), by the presence of the integral membrane protein Nvj1. Micronuclei sequestered by vacuolar invaginations also contained Atg39. A detailed investigation revealed that both Atg39 and Atg8 accumulated between the vacuolar tips. These findings suggest a role for Atg39 in micronucleophagy. Indeed, following the degradation of Nvj1, an exclusive substrate of PMN, in immunoblots, we could confirm the essential role of Atg39 for PMN. Our study thus details the involvement of Atg8 in both macronucleophagy and PMN and identifies Atg39 as the general cargo receptor for nucleophagic processes.
Abbreviations: DIC: Differential interference contrast, FWHM: Full width at half maximum, IQR: Interquartile range, MIPA: Micropexophagy-specific membrane apparatus, NLS: Nuclear localization signal, NVJ: Nucleus vacuole junction, PMN: Piecemeal microautophagy of the nucleus, pnER: Perinuclear ER.
KEYWORDS: Atg39, Atg8, autophagosome formation, ER-phagy, microautophagy, nucleophagy, nucleus vacuole junction, organellar contact sites
Introduction
As a process designated to the degradation and recycling of cellular constituents, consequently facilitating cellular homeostasis, autophagy occurs by two morphologically distinct modes: macroautophagy, often referred to as autophagy and microautophagy. Both target a variety of intracellular substrates, including organelles. Macroautophagy involves de novo formation of double membraned autophagosomes, which fuse with the vacuole for delivery of cargo to the vacuolar lumen. Microautophagy engages in the engulfment of cargo by the vacuole, forming invaginations of the vacuolar membrane, which ultimately releases the cargo into the vacuolar lumen. Both processes rely on a subset of autophagic proteins, the core autophagic machinery, that are involved in cargo recruitment and autophagosome formation. Their roles in microautophagy remained, in comparison, poorly understood. Nucleophagy, the selective subtype of autophagy mediating degradation of nuclear material and parts of the nuclear envelope, has recently emerged as a highly relevant topic [1,2] in particular for its proposed involvement in various diseases. Nucleophagy is involved in neurodegenerative disorders, autoimmune diseases, and cancer [3–6]. In Saccharomyces cerevisiae, there are 2 variants of nucleophagy. The first uncovered microautophagic process termed piecemeal microautophagy of the nucleus (PMN) [7–9], followed by the identification of Atg39 as a nucleophagic cargo receptor, which leads to the proposition of macronucleophagy [10]. As a transmembrane protein of the perinuclear endoplasmic reticulum (pnER), Atg39 colocalizes with perivacuolar, Atg8-positive puncta.
Both macronucleophagy and PMN target nuclear material without causing cellular decay [7,10], suggesting the implementation of a highly regulated system that prevents degradation of vital components. The absence of DNA from nucleophagic cargo was previously shown and recently suggested to be facilitated by the CLIP/cohibin system, which efficiently retracts rDNA upon nucleophagic degradation of nucleolar material [11]. Both processes degrade nuclear cargo alongside pnER, which is representative of the inner and outer nuclear membrane. Additionally, the nucleolar constituent Nop1, a ribosome biogenesis factor, and FBL (fibrillarin) homolog is a substrate of both macronucleophagy and PMN [10,12]. Both subtypes of nucleophagy also share a reliance on the core autophagic machinery, with an additional requirement for selective cargo receptor adaptor Atg11 [8,10].
In contrast to macroautophagy, microautophagy involves uptake of the vacuolar membrane into the vacuolar lumen. PMN is restricted to the nucleus vacuole junction (NVJ), a contact site of pnER and the vacuole [7,13], while the NVJ is principally formed by the interaction of Nvj1, an integral membrane protein in the pnER, and Vac8 in the vacuolar membrane [14]. Nvj1 also recruits additional proteins involved in lipid metabolism, such as Tsc13, catalyzing the last step in very long-chain fatty acid synthesis [15,16] and the sterol transporter Osh1 [17]. Independent of Nvj1, another sterol transporter, Lam6/Ltc1 [18,19] is recruited to the NVJ, and ER-vacuole tether Mdm1 is involved in recruitment of lipid droplets (LDs) to the contact site [20–22], inferring a highly relevant role for the NVJ in lipid metabolism and in turn, suggesting PMN as a potential mechanism for its regulation.
To better understand the molecular mechanism and the relations between macro- and micronucleophagy, we here focused on fluorescence microscopy. In S. cerevisiae cells starved for nitrogen, we analyzed micronuclei, small portions of nuclear material which budded off from the nucleus and could identify two distinct types. One located away from the NVJ, surrounded by Atg39, and engulfed in Atg8-positive phagophores, indicating the occurrence of macronucleophagy. The other type was significantly larger in diameter, formed within or at the edges of the NVJ, and sequestered by vacuolar invaginations, typical for PMN. Remarkably, Atg39 was also detected surrounding these micronuclei and additionally accumulated between the vacuolar tips, colocalizing with Atg8. Using Nvj1, as a substrate exclusively degraded by PMN, we confirmed the essential role of Atg39 for PMN, identifying it as the general cargo receptor for nucleophagy. The 3-dimensional reconstitution of microscopic images with GFP-Atg8 as an autophagosomal marker revealed directed growth of the phagophore during macronucleophagy. At the late stages of autophagosome formation, a change in vacuolar membrane composition occurred. During micronucleophagy we detected a cork-like GFP-Atg8-positive structure between the tips of the vacuolar invaginations, reminiscent of the micropexophagy-specific membrane apparatus (MIPA) [23].
Results
Micro- and macronucleophagy occur in parallel, but Nvj1 is degraded only by micronucleophagy
To unambiguously differentiate macro- from micronucleophagy, we chose a microscopy approach, and further aimed at identifying a cargo degraded exclusively by PMN. As a resident of the NVJ, Nvj1 was investigated by fluorescence microscopy for potential exclusivity to the PMN process. For this purpose, Nvj1-yEGFP was expressed under its endogenous promoter, to prevent leakage into the pnER [14] and observed alongside the nuclear localization signal (NLS) of Nab2 fused with mCherry, for identification of nuclear cargo. We visualized the vacuolar membrane by the integral membrane protein Pho8, labeled with 3× mTagBFP. Then, we identified macro- and micronucleophagy as such, by detecting the absence or presence of 3× mTagBFP-Pho8 signal surrounding NLSNab2-mCherry positive micronuclei, respectively. We chose fluorescent proteins mTagBFP and mCherry to allow for efficient separation of fluorescence emission signals from yEGFP/GFP labeled constructs while retaining levels of brightness, comparable to GFP. We performed fluorescence microscopy of nucleophagy using cells grown to stationary phase (OD600 = 8) and subjected to 2 h of nitrogen starvation in SD-N medium. Despite low nucleophagic rates, these conditions were chosen, due to progressive accumulation of 3× mTagBFP in the vacuolar lumen for longer periods of nitrogen starvation, impeding visualization of the vacuolar membrane.
Two types of micronuclei were distinguishable. One localized outside the NVJs and was not surrounded by the vacuolar membrane, suggesting the occurrence of macronucleophagy (Figure 1(A), upper series). The other appeared within or at the edges of NVJs and always contained within the Pho8-positive vacuolar membrane (Figure 1(A), lower series). In line with expectations, Nvj1-yEGFP was highly present surrounding these micronucleophagic structures, both in situations of budding and also for intravacuolar micronucleophagic bodies (Figure 1(A), lower series). In contrast, observations made for macronucleophagy – neither micronuclei nor intravacuolar bodies (Figure 1(A), upper series) colocalized with Nvj1-yEGFP signals. Nvj1-yEGFP was therefore considered a viable cargo for monitoring micronucleophagic turnover.
Figure 1.
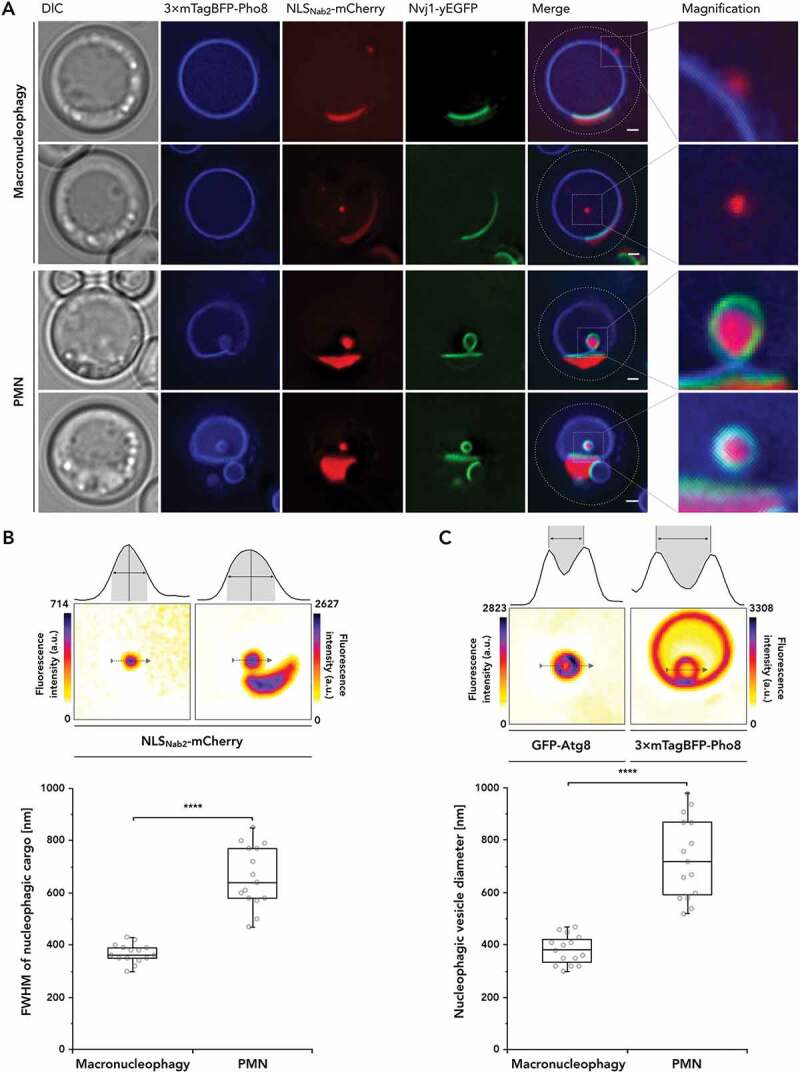
Macro- and micronucleophagy differ in cargo composition and size. (A) Nucleophagic cargo was recorded via fluorescence microscopy, labeling vacuolar membrane with 3× mTagBFP-Pho8, alongside nucleoplasm with NLSNab2-mCherry and the nucleus vacuole junction (NVJ) using Nvj1-yEGFP. Fluorescence microscopy images are depicted alongside differential interference contrast (DIC) and merged images of the fluorescent channels, additionally detailed as magnified (×4) versions. Cells were starved for 2 h prior to imaging in synthetic deplete medium lacking nitrogen (SD-N). (B and C) Cargo size differences for the modes of nucleophagy were observed in fluorescence microscopy and subsequently evaluated by (B) determining NLSNab2-mCherry cargo diameter at full width at half maximum (FWHM) of the signal. (C) Determination of vesicle diameter by quantifying the maximum difference between signal peaks of the outermost vesicular membranes, represented by GFP-Atg8 and 3× mTagBFP-Pho8 signals for macronucleophagy and piecemeal microautophagy of the nucleus (PMN) respectively. Datasets are depicted in a box-and-whisker plot, with the box defined as the interquartile range (IQR), containing the median represented by the line within the box and the whiskers, extending to the last value still within 1.5 × of the IQR. The experimental evaluations are representative of n = 15 measurements. Scale bars: 1 µm
Cargo sizes differ significantly between the modes of nucleophagy
Upon investigating macro- and micronucleophagic characteristics in fluorescence microscopy, a difference in cargo size became apparent. We measured cargo diameter by applying two methods. We performed a determination of the full width at half maximum (FWHM) of NLSNab2-mCherry signals (Figure 1(B)) to assess whether micro- and macronucleophagy could be identified, independent of vacuolar membrane signals surrounding the cargo. Whereas we observed for macronucleophagic cargo, the FWHM ranged between 350–390 nm, a much broader, yet distinct range of 580–770 nm was observed for micronucleophagy. This highly significant size difference in cargo diameter allowed for efficient identification of the corresponding nucleophagic mode.
To enable reference with previous observations regarding vesicular structures of autophagic processes, the outermost membranes, represented by GFP-Atg8 for macronucleophagy and 3× mTagBFP-Pho8 for PMN (Figure 1(C)), were analyzed. Determination of maximum peak distances reaffirmed highly significant differences in vesicle diameter between macro- and micronucleophagy (Figure 1(C)). The median observed diameter of macronucleophagic autophagosomes with 380 nm is higher than that of cytoplasm to vacuole targeting (Cvt) vesicles with 140–160 nm but within the range of published autophagosomal diameters between 300–900 nm [24]. Stronger variations in cargo diameter for PMN imply a higher tolerance for different cargo volumes and suggest a more restrictive mechanism regarding macronucleophagy. Indeed, impairment of autophagosome formation coincides with excess cargo sizes [25].
Atg39 is required for PMN and localizes to PMN structures
The proposed cargo receptor Atg39 locates in the pnER [10]. Since the pnER is enclosed in PMN vesicles, we investigated Atg39-yEGFP localization for both nucleophagic modes. Consistent with electron microscopic data [10], we detected ring-shaped Atg39-yEGFP signals, representative of pnER, surrounding macronucleophagic cargo in fluorescence microscopy (Figure 2(A)). Observation of ring-shaped pnER as cargo also hints at a coordinated budding process, involving initial fission of nuclear blebs during micronuclei formation, similar to the mechanism reported for PMN [9]. Colocalization of Atg39 with Atg8 showed continuous envelopment of cargo in Atg39, alongside varying stages (punctate and phagophore extension) of autophagic membrane growth represented by Atg8 (Figure 2(B)). 3-dimensional representations of the Atg39-yEGFP signal highlighted its presence around both macronucleophagic cargo and the entire nucleus, including the NVJ (Figure 2(C)). Fluorescence microscopy revealed an increase in fluorescence intensity of Atg39-yEGFP around macronucleophagic micronuclei when compared with signal intensities surrounding the nucleus (Figure 2(E)). This effect was significant (Figure 2(D)), suggesting the accumulation of Atg39 to be of functional relevance to macronucleophagy.
Figure 2.
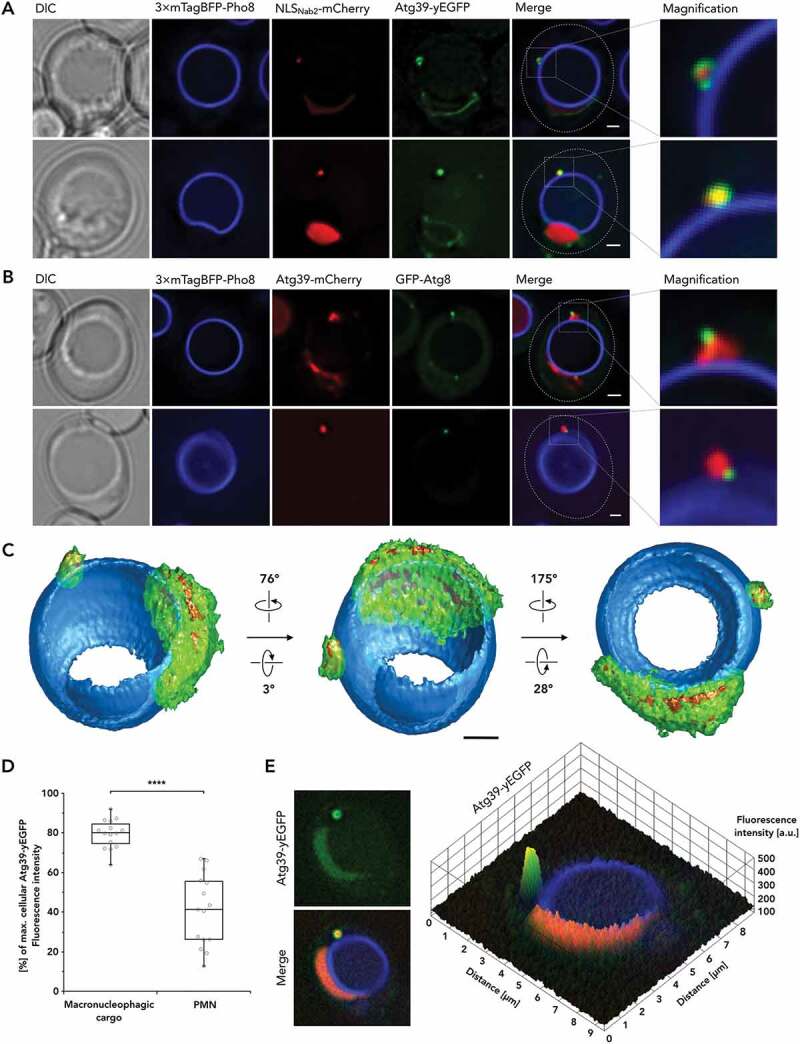
Atg39 is present throughout the nuclear envelope and accumulates significantly when surrounding macronucleophagic cargo. (A) Atg39-yEGFP is depicted in macronucleophagic context, together with 3× mTagBFP-Pho8 visualizing vacuolar membrane and NLSNab2-mCherry labeling nucleoplasm, alongside DIC and merged images of the fluorescent channels, additionally detailed as magnified (×4) versions. (B) Atg39-mCherry in relation to macroautophagic membrane marker GFP-Atg8 and 3× mTagBFP-Pho8 alongside DIC and merged images of the fluorescent channels, additionally detailed as magnified (×4) versions. (C) A 3-dimensional reconstruction of Atg39-yEGFP in macronucleophagic context was obtained from 24 images, collected as individual z-stacks, each 200 nm apart, by processing with Huygens Professional. (D) Median Atg39-yEGFP fluorescence intensities surrounding macronucleophagic cargo and the main nucleus were comparatively evaluated. Fluorescence microscopy data was normalized using the max. cellular Atg39-yEGFP fluorescence intensity value as a 100% reference. Datasets are depicted in a box-and-whisker plot, with the box defined as the IQR, containing the median represented by the line within the box and the whiskers, extending to the last value still within ×1.5 of the IQR. The experimental evaluation is representative of n = 15 measurements. (E) A 3-dimensional surface plot highlighting differences of relative Atg39-yEGFP fluorescence intensity between the nucleus and macronucleophagic cargo. Atg39-yEGFP signal intensities (left upper image) are projected onto a merged version of the image, which includes Atg39-yEGFP alongside 3× mTagBFP-Pho8 and NLSNab2-mCherry. Scale bars: 1 µm
Atg39-yEGFP was also detected within PMN cargo structures, maintaining fluorescence intensities comparable to those surrounding the nucleus (Figure 3(A)). The presence of Atg39-yEGFP within micro- and macronucleophagic structures also infer its subsequent degradation, rendering Atg39 unsuitable for the distinction of the nucleophagic modes. Atg39 thus represents a general nucleophagic substrate.
Figure 3.
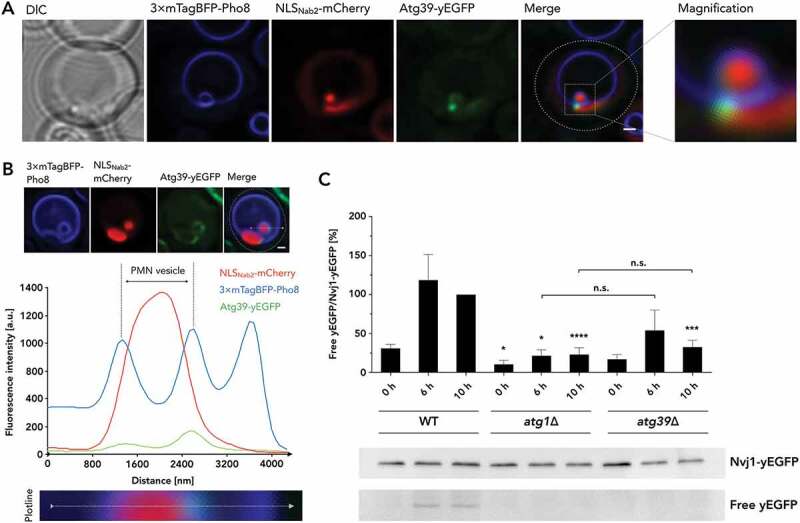
Cargo receptor Atg39 is involved in micronucleophagy. (A) Atg39-yEGFP is depicted in the PMN context, together with 3× mTagBFP-Pho8 visualizing vacuolar membrane and NLSNab2-mCherry labeling nucleoplasm, alongside DIC and merged images of the fluorescent channels, additionally detailed as magnified (×4) versions. (B) Fluorescence profile of Atg39-yEGFP in PMN context and for reference 3× mTagBFP-Pho8 and NLSNab2-mCherry, corresponding to the microscopic image series depicted above the graph was generated, with the applied plotline depicted in detail below. Fluorescence intensities are depicted in arbitrary units (a.u.) and plotted against line distance in nm. (C) Determination of autophagic Nvj1-yEGFP turnover in atg39∆ cells. Expression of Nvj1-yEGFP was performed under its endogenous promotor, in atg39∆ cells, referenced by the respective wild-type (WT) and an atg1∆ strain, as a representative for autophagic deficiency. Degradation of Nvj1-yEGFP by the PMN, results in the accumulation of relatively protease-resistant free yEGFP in the vacuole and is quantifiable in relation to the Nvj1-yEGFP fusion protein. Whole-cell extracts were analyzed 0 h, 6 h, and 10 h after exposure to starvation conditions. Signal intensities are depicted in relation to the 10 h WT value, which was set to represent 100%. The experimental evaluation is representative of n = 8 individual experiments. Scale bars: 1 µm
Remarkably, during micronucleophagy, a singular, punctate signal was further observed for Atg39-yEGFP between the tips of vacuolar invaginations (Figure 3(A,B)). Fluorescence profiling (Figure 3(B)) demonstrated that Atg39-yEGFP is present in higher amounts at these puncta compared with its abundance in the remaining pnER. This result suggested a functional relevance of Atg39 for micronucleophagy, analogous to the accumulation of Atg39-yEGFP observed for macronucleophagy.
We quantified PMN-dependent autophagic turnover upon the deletion of Atg39 to confirm the involvement of Atg39 in PMN. To this end, we expressed Nvj1-yEGFP under its endogenous promotor, which was exclusively degraded by PMN in Figure 1(A). Then, we analyzed the degradation of Nvj1-yEGFP in an atg39∆ strain. Upon delivery of Nvj1-yEGFP to the vacuole, it is degraded by vacuolar proteases, while the resistant structure of GFP and its derivatives enables determination of autophagic turnover by quantification of cellular fusion protein levels versus levels of free yEGFP [26]. Indeed, Nvj1-yEGFP degradation, induced by nitrogen depletion in SD-N medium, resulted in significantly reduced levels of degradation in the atg39∆ strain after 10 h when referenced with wild-type (WT) levels, while showing comparable levels to atg1∆ cells (Figure 3(C)). The results demonstrate the involvement of Atg39 in PMN and support a role for Atg39 as the overall nucleophagic cargo receptor.
PMN involves a microautophagic membrane structure
As a cargo receptor, Atg39 functionally depends on interaction with Atg8. Therefore, we investigated the Atg8 localization. Interestingly, fluorescence microscopy of GFP-Atg8 showed single puncta between the tips of the vacuolar invaginations during PMN (Figures 4(A) and S1) that colocalized with Atg39 in microautophagic context (Figure 4(B)). To clarify, whether the micronucleus maintains connections to the main nucleus, we projected z-stacks into 3-dimensional representations (Figure 5(A); Video Figure S1). This was not the case, but our observations reaffirmed the singular nature of the punctate signal within the spherical vacuolar membrane bulge. In addition to 3-dimensional projection, we analyzed the signal in the corresponding fluorescence profile (Figure 5(B)). A comparison of the GFP-Atg8 fluorescence profile with that of Atg39 (Figure 3(B)) highlights that the weaker, secondary peak is absent for GFP-Atg8. This result implies that lower levels of Atg39 present in the pnER, engulfed in the vacuolar membrane, do not elicit detectable Atg8 recruitment. Instead, the GFP-Atg8 structure appears to coincide with the site of heightened Atg39 accumulation (Figures 3(A,B) and 4(A,B)). A decrease in detectability for Atg39-mCherry in comparison to Atg39-yEGFP (both under endogenous Atg39 promotors) prevented the recording of pnER presence for Atg39 in microautophagic context. Though we showed Atg39 presence in macroautophagic context (Figure 2(B), upper row), lower exposure times required for detection of highly mobile microautophagic structures limited Atg39 detection in the pnER (Figure 4(B)).
Figure 4.
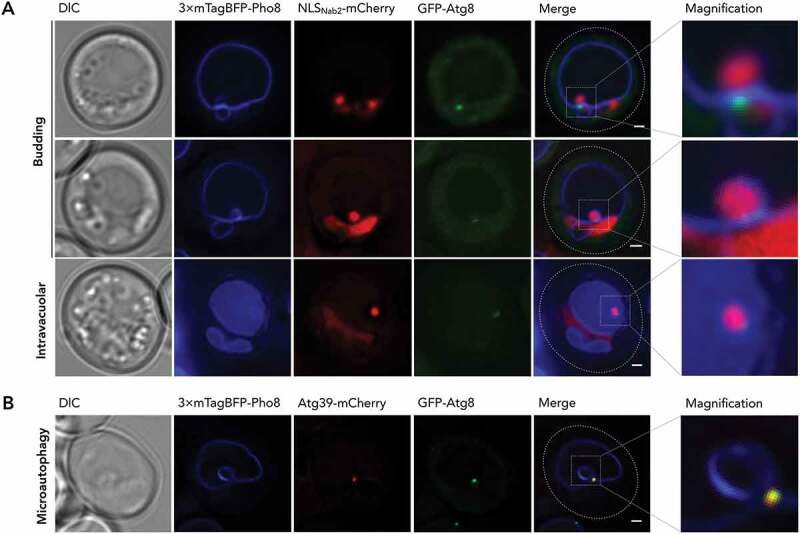
An Atg8-positive autophagic structure is involved in PMN. (A) GFP-Atg8 in the budding PMN vesicle (upper series) and released, intravacuolar vesicle (lower series) is depicted with 3× mTagBFP-Pho8 visualizing vacuolar membrane and NLSNab2-mCherry labeling the cell nucleoplasm, alongside DIC and merged images of the fluorescent channels, additionally detailed as magnified (×4) versions. (B) For determination of Atg8 and Atg39 colocalization, GFP-Atg8 was recorded, in microautophagic context, alongside Atg39-mCherry and 3× mTagBFP-Pho8 alongside DIC and a merged image of the fluorescent channels, additionally detailed as a magnified (×4) version. Scale bars: 1 µm
Figure 5.
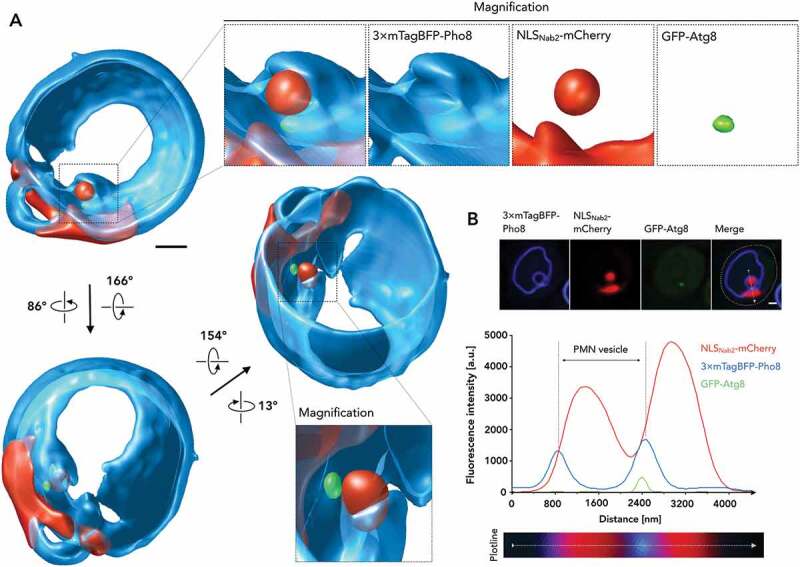
Analysis of the Atg8-positive autophagic PMN structure. (A) A 3-dimensional reconstruction of GFP-Atg8 in PMN context was obtained from 24 images, collected as individual z-stacks, each 200 nm apart, by processing with Huygens Professional. Partial lack of the 3× mTagBFP-Pho8 signal around the micronucleus is most likely due to mobility of the microautophagic structure and to bleaching during acquisition of the 72 (3 × 24) images. (B) A fluorescence profile of GFP-Atg8 in the PMN context and for reference 3× mTagBFP-Pho8 and NLSNab2-mCherry, corresponding to the microscopic image series depicted above the graph was calculated, with the applied plotline depicted in detail below. Fluorescence intensities are depicted in a.u. plotted against the line distance in nm. Scale bars: 1 µm
We attempted fluorescence microscopy of intravacuolar PMN vesicles to determine whether the punctate structure transferred to the vacuolar lumen upon release of the PMN vesicle. High mobility of intravacuolar vesicles complicated recordings in multi-channel, fluorescence microscopy and resulted in the visible blurring of the signals. Despite the smearing of the GFP-Atg8 signal at the intravacuolar PMN vesicle, GFP-Atg8 was clearly restricted to a portion of the circular 3× mTagBFP-Pho8 signal. Atg8, therefore, at least partially remains associated with the vesicle upon transfer into the vacuolar lumen.
The presence of a GFP-Atg8 structure between the tips of the vacuolar invagination is highly reminiscent of observations made for micropexophagy in Komagataella phaffii (former Pichia pastoris) [27,28]. A previous report shows that micropexophagy does involve the MIPA, a curved membrane structure [23], that links the vacuolar arms and contains KpAtg8, which in turn interacts with the pexophagy cargo receptor KpAtg30 [29].
Atg11 shows a distinct localization for macro- and micronucleophagy
Alongside Atg8, Atg39 interacts with the selective cargo receptor adaptor protein Atg11, which is involved in selective types of autophagy and required for both macronucleophagy and PMN [8,10]. Microscopic investigations showed that Atg11 localized to the vacuolar membrane surrounding macronucleophagic cargo (Figure 6(A)), supporting a role for Atg11 in transient recruitment of autophagic cargo, which could then be succeeded by Atg8 binding and engulfment into the autophagosome. In the PMN context, Atg11 appears to localize to the tips of the vacuolar invagination but seems to be absent from the microautophagic membrane (Figure 6(A)). 3-dimensional projection of the structure (Figure 6(B)) supports the corresponding fluorescence profile, depicting two separate yEGFP-Atg11 signal peaks within the vacuolar membrane bulge, localized proximal to the nucleus (Figure 6(C)). We investigated the distinct localization of Atg11 further by reference of mCherry-Atg11 relative to GFP-Atg8 (Figure 6(D)). In the macroautophagy context, Atg11 localized to the vacuolar portion of the growing autophagic membrane confirming macronucleophagic observations. In the microautophagy context, we detected an expanded, generally larger localization, distinct from Atg8 signals.
Figure 6.
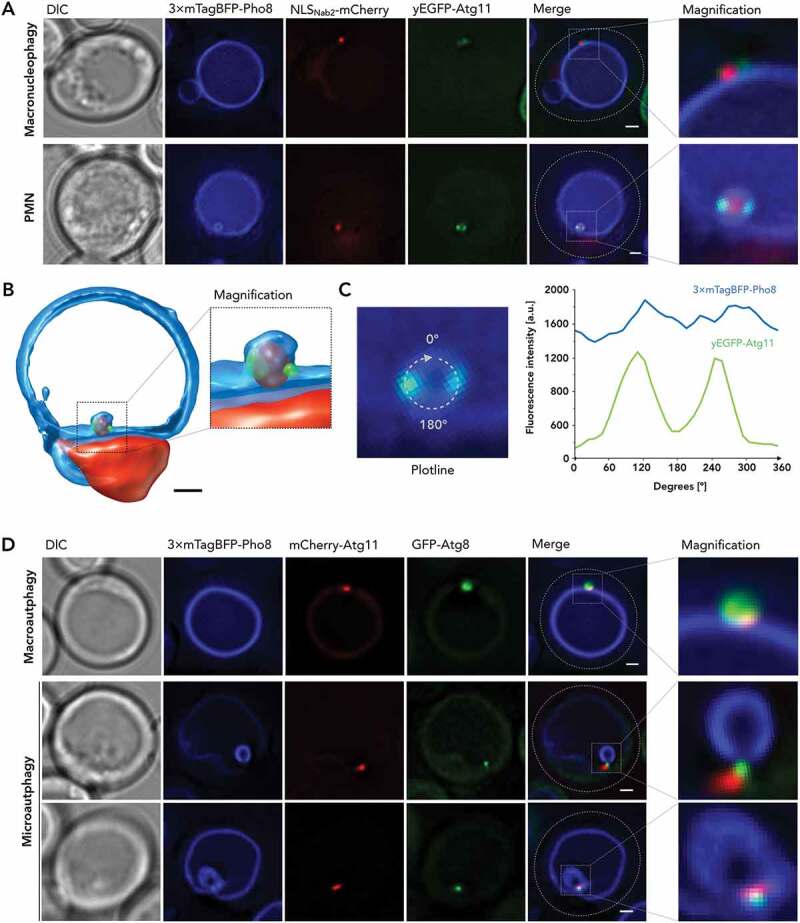
Cargo receptor adaptor Atg11 is detected at the tips of the vacuolar invagination in PMN. (A) yEGFP-Atg11 in macronucleophagic context (upper series) and PMN context (lower series) is depicted with 3× mTagBFP-Pho8 visualizing vacuolar membrane and NLSNab2-mCherry labeling the cell nucleoplasm, alongside DIC and merged images of the fluorescent channels, additionally detailed as magnified (×4) versions. Cells were imaged after 2 h of nitrogen starvation in SD-N medium. (B) A 3-dimensional reconstruction of yEGFP-Atg11 in PMN context was obtained from 24 images, collected as individual z-stacks, each 200 nm apart, by processing with Huygens Professional. (C) A fluorescence profile of yEGFP-Atg11 in PMN context and for reference 3× mTagBFP-Pho8 and NLSNab2-mCherry, corresponding to the microscopic image series depicted in (A), was calculated, with the applied circular plotline depicted in detail. Fluorescence intensities are depicted in a.u. and plotted against the circular line distance from 0°-360°. (D) For reference with Atg8-positive autophagic membranes, mCherry-Atg11 was recorded in macro- (upper series) and microautophagic (lower series) context with GFP-Atg8, 3× mTagBFP-Pho8, alongside DIC and merged images of the fluorescent channels, additionally detailed as magnified (×4) versions. Scale bars: 1 µm
Late stages of macronucleophagy coincide with a distinct vacuolar membrane composition
Distinct stages of autophagosome biogenesis were previously resolved by fluorescence microscopy, applying synthetic conditions that produce an unnatural increase in cargo size [25]. As shown in Figures 1 and 2, macronucleophagic cargo could be distinguished from the autophagic machinery and its cargo receptor beyond colocalization. This result suggested that a detailed distinction of the autophagosome formation process is possible when observing macronucleophagy in fluorescence microscopy. Its presence in all stages of autophagosome formation established Atg8 as a marker protein for microscopic fluorescence investigations into the morphologically distinct steps of macroautophagy. As expected, 3-dimensional reconstitution of microscopic images documented GFP-Atg8 positive signals engulfing micronuclei, detailing a corresponding cavity at the site of cargo presence (Figure 7; Video Figure S2). Remarkably, further visualizations depicted phagophores with finger-like protrusions, suggesting multiple growth trajectories extending around the cargo, suggesting more than a single site for autophagosomal membrane growth (Figures S2 and S3; Video Figure S3).
Figure 7.
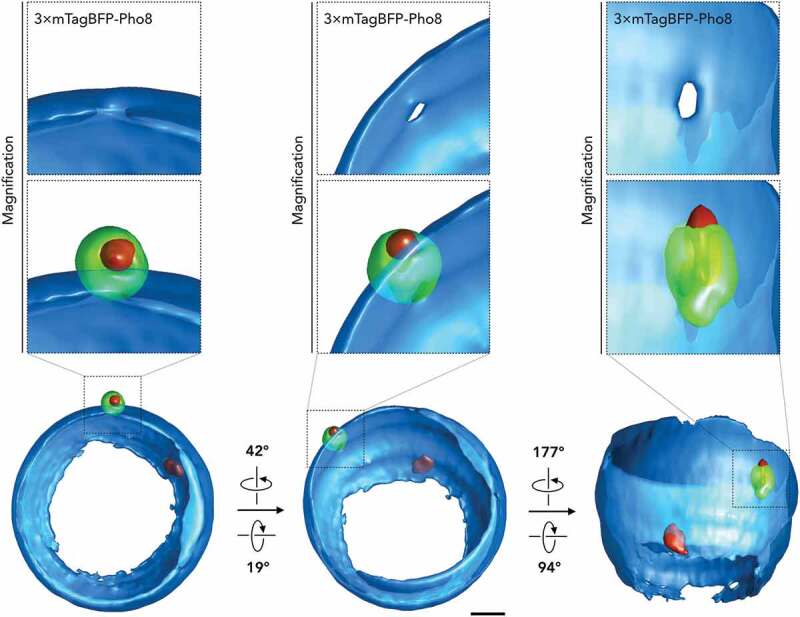
A 3-dimensional reconstruction of the image further analyzed in Figure 8 A-D was obtained from 24 images collected as individual z-stacks, each 200 nm apart, subsequently generated with Huygens Professional. Only a small portion of the main nucleus is visible in the 3-dimensional reconstruction, due to the limited recording carried out along the z-axis. Scale bars: 1 µm
Detailed investigation of the vacuolar membrane signal, represented by 3× mTagBFP-Pho8, also revealed that the presence of GFP-Atg8 in circular autophagic structures frequently coincided with a reduction in 3× mTagBFP-Pho8 fluorescence intensity (Figures 7 and 8(A–D)). 3-dimensional projections revealed the signal reduction to be circular, and we observed the strongest effect at the site of closest contact with the autophagosome. This signal reduction also frequently demarcated the only site of signal reduction within the vacuolar membrane, at least to that extent. Additional analysis of the change in fluorescence intensity revealed that the effect was absent for the lipophilic vacuolar membrane dye FM™ 4–64, indicating the formation of a vacuolar membrane domain rather than membrane absence (Figure 8(E)). We further investigated this change in vacuolar membrane composition by the application of ergosterol synthesis inhibitor fenpropimorph (Figure 8(F)). Sterol domain formation in vacuoles was previously investigated and shown to be efficiently inhibited by the application of fenpropimorph [30]. We observed GFP-Atg8 degradation for its heightened presence in macroautophagy cargo (including macroautophagic bodies), in comparison to its microautophagic involvement, due to the lack of a substrate exclusive to macronucleophagy. Indeed, fenpropimorph application results in a decrease in GFP-Atg8 turnover, indicating a dependence of the macroautophagy system on sterol. We performed a 2-dimensional categorization of GFP-Atg8 signals into “punctate,” an extended membrane “phagophore,” curved membrane “crescent,” fully-formed “autophagosome,” and transfer of autophagosomal structures as “fusion.” This result correlates with the observed membrane changes with the progression of phagophore elongation (Figure 9). While early stages, up until the “crescent” stage, showed little or no reduction of 3× mTagBFP-Pho8 signal in the adjacent vacuolar membrane, fully formed autophagosomes frequently showed a reduction and all observed occurrences of autophagic fusion coincided with the signal decrease.
Figure 8.
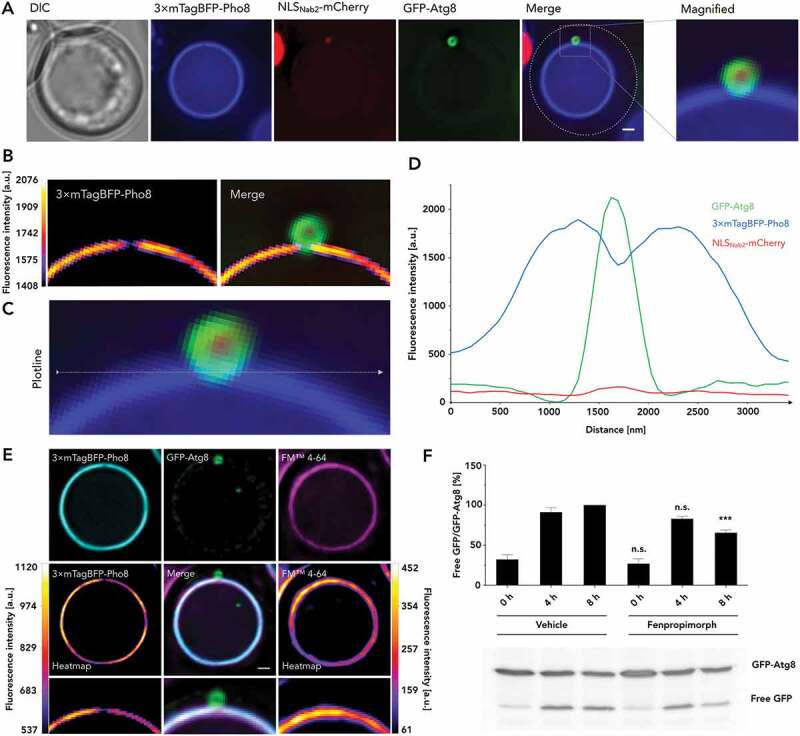
Late stages of autophagosome formation coincide with a reduction of Pho8 in the vacuolar membrane. (A) Analyses of circular GFP-Atg8 signals in macronucleophagic context were carried out alongside 3× mTagBFP-Pho8 visualizing the vacuolar membrane and NLSNab2-mCherry labeling the cell nucleoplasm alongside DIC and merged images of the fluorescent channels, additionally detailed as magnified (×4) versions. (B) Signal intensities recorded for 3× mTagBFP-Pho8 of the data shown in (A) are depicted in heatmap fashion, both individually and for reference, merged with the GFP-Atg8 and NLSNab2-mCherry channels. (C) Depiction of the plotline, used for generation of the fluorescence profile of all relevant channels displayed in (D) plotting fluorescence intensity in a.u. against the measured distance in nm. (E) Analyses of a change in vacuolar membrane composition were carried out by reference of 3× mTagBFP-Pho8 (cyan) absence, in the presence of circular GFP-Atg8 signals, with FM™ 4–64 (magenta). 3× mTagBFP-Pho8 and FM™ 4–64 are additionally depicted in heatmap fashion displayed alongside a merged version of all channels with magnified versions depicted underneath. (F) A potential requirement for sterol domain formation in macroautophagic context was investigated by the application of ergosterol biosynthesis inhibitor fenpropimorph. Cells (WT) expressing GFP-Atg8 were starved for 4–8 h by incubation in SD-N alongside either 5 µM fenpropimorph or vehicle dimethyl sulfoxide (DMSO). The experimental evaluation is representative of n = 5 measurements. Scale bars: 1 µm
Figure 9.
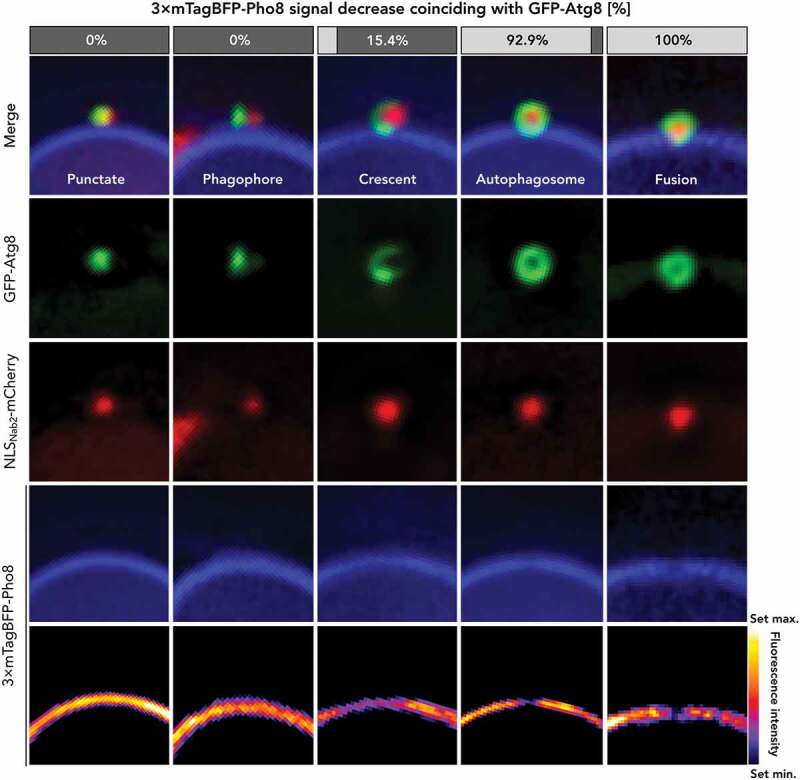
Analysis of the stages of phagophore elongation during macronucleophagy. Visually distinct stages of phagophore elongation during macronucleophagy were sorted into five classes. Signals of GFP-Atg8 colocalizing with NLSNab2-mCherry-positive micronuclei were counted as “punctate”, expanding linear signals as “phagophore”, curved, semi-circular to crescent structures as “crescent”, fully circular as “autophagosome” and circular structures that contained a portion of the GFP-signal inside the vacuole as “fusion”. The various stages of autophagosome formation were investigated for the correlation of GFP-Atg8 signal with a decrease in the 3× mTagBFP-Pho8 signal. Percentages of the occurrence are depicted above representative images. The dataset is representative of n ≥ 10 individual images for each class. During late stages of autophagosome formation, a vacuolar domain with reduced Pho8 levels was observed. Scale bars: 1 µm
Discussion
Our in-depth microscopic analyses underline the dependency of both macro- and micronucleophagy [8,10] on the autophagic machinery and uncover a general role for the selective autophagy cargo receptor Atg39 in both processes (Figures 2–4). Morphologically distinct and yet dependent on the same machinery, this work focused on elucidating differences of 2 autophagic systems seemingly targeting identical cargo.
The microautophagy-specific degradation of Nvj1 supports an exclusive role for PMN in the degradation of the NVJ, which in turn acts as a hub for various lipid metabolic processes. A screen for stress response elements locates the open reading frames (ORFs) of Atg39 and Nvj1 downstream of 2 stress response element repeats [31], which upregulate gene expression during stationary phase and nutrient deprivation. While cellular levels of Nvj1 directly correlate with the size of the NVJ [14], Nvj1 also at least partially determines the composition of the NVJ by the recruitment of additional components [7]. In this context, a co-expression of Nvj1 and Atg39 hints at a regulatory mechanism for the NVJ through PMN, which is in line with previous observations of heightened PMN rates coinciding with the overabundance of Nvj1 [32]. Tight clamping of the nuclear envelope by Nvj1 results in a reduction of inner to outer nuclear membrane distance from 18 nm, present in the overall nuclear envelope, to 9 nm within the NVJ [33]. This particularity potentially complicates a simple dissociation of the contact site and could, therefore, restrict its regulation to degradation by PMN. Designating PMN a regulatory functionality regarding the NVJ size might consequently reduce the inclusion of other nuclear PMN substrates to a mere side-effect of topological circumstance. This model supports a highly relevant additional role of macronucleophagy as a quality control mechanism for both the pnER and components of the nucleus. The enclosure of large portions of the NVJ allows for rapid adaption to environmental changes. Differences in cargo specificity could, therefore, also reflect the significantly larger size of micronucleophagic structures (Figure 1(B,C)). We expect that micro- and macronucleophagy exist in parallel, to independently allow for regulation of the NVJ size, while also providing a quality control mechanism for pnER and nucleus.
The initial identification of Atg39 as the cargo receptor for pnER [10] coincided with observations regarding its involvement in microlipophagy, describing it as Esm1 (ER-stress-induced microlipophagy gene 1) [34]. Furthermore, LD accumulation at the edges of the NVJ might be mediated by NVJ resident protein Mdm1, facilitating lipid transport from the ER [20,21]. Since our identification of Atg39 as the cargo receptor for PMN implies its regulatory influence on the NVJ, it could, in turn, modulate both LD synthesis and consumption.
Increased levels of Atg39 around macronucleophagic cargo (Figure 2) support a functional relevance for macronucleophagy. Recently, the curvature inducing reticulon homology domain of cortical ER receptor RETREG1/FAM134B was shown to be required for ER-phagy [35]. While Atg39 does not show homology to RETREG1 (as opposed to cortical ER receptor Atg40) and lacks the reticulon homology domain, tandem recruitment of curvature inducing factors by Atg39 might present a mechanism for the initiation of macronucleophagy.
Detection of an Atg8-positive, phagophore-like structure between the tips of the vacuolar invagination during PMN (Figures 4 and 10) is reminiscent of the MIPA, observed in micropexophagy [23]. Its presence seems to be a conserved feature within the microautophagic system, rather than a specific aspect of micropexophagy in K. phaffii. It explains, at least in part, a need for the core autophagic machinery in microautophagy. The microautophagic membrane in PMN is a significantly smaller structure when compared with the MIPA. This could be due to the overabundance of peroxisomes when inducing pexophagy [27], forcing elongation of the microautophagic membrane. While PMN requires some proteins distinct from pexophagy in K. phaffii, morphological classification identifies it as type 2 microautophagy according to [36].
Figure 10.
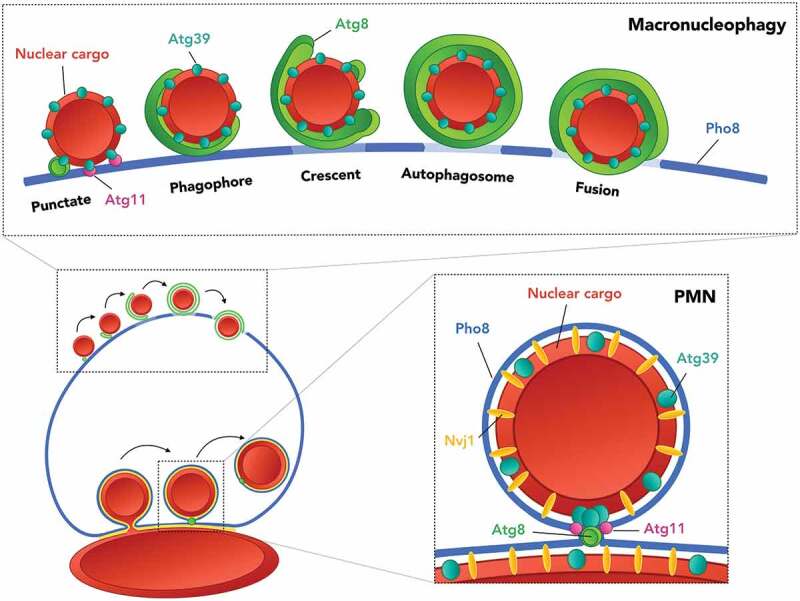
Proposed model for the modes of nucleophagy. Macronucleophagy involves the initial recruitment of Atg39 containing nuclear cargo to the vacuole at an Atg11-positive site. Atg8 represents subsequent recruitment of the autophagic machinery. First, as a punctate structure progressively growing, shaping the phagophore and further enveloping the cargo by expanding via multiple growth trajectories observed as crescent and circular structures. The process concludes by the formation of the autophagosome and its subsequent fusion with the vacuole, which coincides with a change in vacuolar membrane composition, indicated by a reduction of Pho8. PMN was shown to involve the accumulation of Atg39, which presumably coincides with the punctate signals of Atg8, bordered by dual signals of Atg11. Residual Atg39 is found in the perinuclear ER. Both the discrepancy in cargo diameter and the nuclear vacuolar junction, represented by Nvj1 are depicted as features distinguishing macro- from micronucleophagic processes
Regarding the purpose of the microautophagic membrane, which appears as a cork-like structure, we speculate that it fuses with the vacuolar tips, thus leading to the release of a microautophagic body into the vacuole (Figure 10). Indeed, we could detect GFP-Atg8 restricted to one site at intravacuolar bodies (Figure 4(A)). This result could hint at a role that allows access for vacuolar hydrolases to microautophagic bodies since the outermost membrane of micronucleophagic bodies derives from the vacuolar membrane, which is resistant to vacuolar hydrolases.
Expanded signals of Atg11 in close proximity to, but distinct from the Atg8-positive microautophagic membrane suggest interaction of the autophagic machinery with the tips of the vacuolar invagination, and potential involvement in the tethering process analogous to tethers identified for macroautophagy, while at the same time presenting a potential strategy for defining the extent of the NVJ, degraded by PMN and potentially microautophagy in general.
The ability to directly visualize macronucleophagy provided novel insights regarding autophagosome biogenesis without using artificially enlarged cargoes. In the macronucleophagy context, Atg11 appears to mediate transient contact of cargo with the vacuolar membrane, facilitating recruitment for further processing by the macroautophagy machinery (Figures 6 and 10). Observations of distinct vacuolar membrane composition, indicated by the exclusion of Pho8 while maintaining membrane presence (Figures 7 and 8(A–E)) at the late stages of autophagosome formation (Figure 9), might be a requirement for the autophagic fusion process. Another interesting finding is the multiple growth trajectories extending from the phagophore during macronucleophagy (Figures S2 and S3; Video Figure S3). Further studies must clarify which mechanisms are fine-tuning phagophore elongation.
Materials and methods
Strains, media and growth conditions
Yeast strains listed in Table 1 are derived from the WT strain WCG4a MATα ura3 his3-11,15 leu2-3112 [37]. Deletion strains were generated applying the method described by [38] and subsequently verified by PCR of target genomic DNA. Cells were grown at 30°C in YPD medium containing 1% (w:v) yeast extract (Becton Dickinson, 212720), 2% (w:v) peptone (Becton Dickinson, 211820) and 2% (w:v) glucose (Roth, 6780.2). For auxotrophic selection, complete minimal medium containing 0.67% (w:v) yeast nitrogen base w/o amino acids (Becton Dickinson, 291920), 2% (w:v) glucose set to pH 5.6 and supplemented with the appropriate amino acids, was used. To induce autophagy, cells were grown to stationary phase and then incubated in SD-N medium containing 0.17% (w:v) yeast nitrogen base w/o amino acids and ammonium sulfate (Becton Dickinson, 233520), and 2% (w:v) glucose.
Table 1.
S. cerevisiae strains used in this study
| Strain | Genotype | Reference |
|---|---|---|
| WCG4a | MATα his2-11,15 leu2-3,112 ura3 | [37] |
| atg1∆ | atg1::natNT2 | This work |
| atg39∆ | atg39::natNT2 | This work |
Plasmids
Plasmids used are listed in Table 2. For expression of Atg39-yEGFP, yEGFP-Atg11, Atg39-mCherry, mCherry-Atg11 and Nvj1-yEGFP plasmid constructs were generated. The ORFs of Atg39 and Nvj1 were amplified including their upstream promoter region and lacking the native stop codon, bracketed by XbaI and XmaI or BamHI and HindIII restriction sites for the Atg39-yEGFP and Nvj1-yEGFP constructs, respectively. Amplification products were digested alongside the CEN/ARS, pRS316 (ATCC, 77145) and pRS313 (ATCC, 77142) plasmid backbones and subsequently ligated using the Instant Sticky-end Ligase Master Mix kit (New England Biolabs, M0370). For the yEGFP-Atg11 construct, its ORF was bracketed by BamHI and XhoI, digested alongside its target pUG36 and pUG34 backbones and ligated into the vector, which includes an N-terminally-located yEGFP sequence and a MET17 promoter. For the mCherry-Atg11 constructs yEGFP was replaced with amplified mCherry sequences. Amplicons of all target inserts were obtained from genomic WT WCG4a DNA. Tag sequences of yEGFP and mCherry were amplified from pUG36 and the NLSNab2-mCherry plasmids respectively (Table 2).
Table 2.
Plasmids used in this study
| Strain | Genotype | Reference |
|---|---|---|
| Atg39-yEGFP | pRS316 PATG39-Atg39-yEGFP-TCYC1 | This work |
| Atg39-mCherry | pRS313 PATG39-Atg39-mCherry-TCYC1 | This work |
| GFP-Atg8 | pRS316 PATG8-GFP-Atg8-TATG8 | [40] |
| NLSNab2-mCherry | pRS413 PTEF1-NLSNab2-mCherry | Michael Rout (Rockefeller University, New York, New York, USA) |
| Nvj1-yEGFP | pRS316 PNVJ1-Nvj1-yEGFP-TCYC1 | This work |
| PPGK1-3× mTagBFP-Pho8 | pRS305 PPGK1-3× mTagBFP-Pho8 | [41] |
| yEGFP-Atg11 | pUG36 PMET17-yEGFP-Atg11-TCYC1 | This work |
| mCherry-Atg11 | pUG34 PMET17-mCherry-Atg11-TCYC1 | This work |
| pRS305 | AmpR ori lacZ’ LEU2 | [42] |
| pRS313 | CEN/ARS AmpR ori lacZ’ HIS3 | [42] |
| pRS316 | CEN/ARS AmpR ori lacZ’ URA3 | [42] |
| pRS413 | CEN/ARS AmpR ori lacZ’ HIS3 | [42] |
| pUG36 | CEN/ARS AmpR ori URA3 PMET17-yEGFP-lacZ’- TCYC1 | [43] |
| pUG34 | CEN/ARS AmpR ori HIS3 PMET17-yEGFP-lacZ’- TCYC1 | [43] |
Quantification of autophagic degradation
Autophagic turnover was determined quantifying non-starved versus starved cells and additionally for the application of fenpropimorph (Merck, 36772) and dimethyl sulfoxide (Merck, D8418). Cells were harvested and treated on ice, with lysis buffer containing 1.85 M NaOH (Roth, 6771.2) and 7.5% (v:v) 2-mercaptoethanol (Roth, 4228.1) for 1 min. 15% (v:v) trichloroacetic acid (Roth, 8789.2) was added and the samples were incubated for 20 min and subsequently centrifuged at 15,000 × g for 5 min. After removal of the supernatant, samples were washed twice with −20°C acetone, dried at room temperature and ultimately resuspended in SDS sample buffer containing 100 mM Tris (Roth, 5429.2), 2% (w:v) SDS (Roth, CN30.3), 20 mM dithiothreitol (Roth, 6908.2), and 10% (v:v) glycerol (Roth, 3783.2) set to pH 7.5 and resolved by SDS-PAGE. Gels were subjected to immunoblotting applying a primary anti-GFP antibody (Roche, 11814460001) and a secondary anti-mouse antibody (Dianova, 115-035-166).
Fluorescence microscopy
Fluorescence microscopy was realized using the DeltaVision® Core setup, based on an inverted IX71 microscope (Olympus), equipped with the UPlanSApo ×100, 1.4 numerical aperture, oil immersion objective (Olympus) and a CoolSNAPHQ2™ couple-charged device camera (Roper Scientific). Built-in filter sets were used for detection of mTagBFP (applying excitation of 390 nm with 18 nm bandpass and detecting emission at 435 nm with 48 nm bandpass), GFP/yEGFP (applying excitation of 475 nm with 28 nm bandpass and detecting emission at 525/50 nm bandpass) and FM™ 4–64 (ThermoFisher Scientific, T3166) as well as mCherry (applying excitation of 575 nm with 25 nm bandpass and detecting emission at 632 nm with 69 nm bandpass). Images of focal planes along the z-axis, separated by 0.2 µm were obtained to ascertain separation of nucleus and micronuclei. The DeltaVision® Core setup was operated using softWoRx® (Applied Precision) which was also applied for image deconvolution. Further processing was performed using Fiji [39] and Huygens Professional (Scientific Volume Imaging). Chromatic aberration of the microscopic setup was corrected by reference with TetraSpeck™ Microspheres, 0.2 µm (ThermoFisher Scientific, T7280), recorded and processed in the same fashion as cell samples, using Huygens Professional.
Statistical analysis
All data were analyzed using Prism 7.0d for Mac OSX (GraphPad Software). Statistical evaluations of Nvj1-yEGFP versus free yEGFP as well as GFP-Atg8 versus free GFP, were performed applying a one-sample Student’s t-test using the ratio of 10 h WT (for Nvj1-yEGFP) and 8 h vehicle (for GFP-Atg8) as a 100% reference. To determine significant differences between two datasets, an unpaired, two-sided t-test was applied. Asterisks are representative of the p‑values: not significant (n.s.) = P ≥ 0.05 * = P < 0.05; ** = P < 0.01; *** = P < 0.001; **** = P < 0.0001. All error bars are representative of the standard error of the mean.
Supplementary Material
Funding Statement
This work was supported by the Deutsche Forschungsgemeinschaft (DFG) within the [SFB 1190, P06].
Disclosure statement
No potential conflict of interest was reported by the authors.
Supplementary material
Supplemental data for this article can be accessed here.
References
- [1].Wilkinson S. ER-phagy: shaping up and destressing the endoplasmic reticulum. FEBS J. 2019. May 22;21(15):596. [DOI] [PMC free article] [PubMed] [Google Scholar]
- [2].Dikic I. Open questions: why should we care about ER-phagy and ER remodelling? BMC Biol. 2018. November 1;16(1):131. [DOI] [PMC free article] [PubMed] [Google Scholar]
- [3].Baron O, Boudi A, Dias C, et al. Stall in canonical autophagy-lysosome pathways prompts nucleophagy-based nuclear breakdown in neurodegeneration. Curr Biol. 2017. December 4;27(23):3626–3642.e6. [DOI] [PMC free article] [PubMed] [Google Scholar]
- [4].Akinduro O, Sully K, Patel A, et al. Constitutive autophagy and nucleophagy during epidermal differentiation. J Invest Dermatol. 2016. March;136(7):1460–1470. [DOI] [PubMed] [Google Scholar]
- [5].Luzhna L, Kathiria P, Kovalchuk O. Micronuclei in genotoxicity assessment: from genetics to epigenetics and beyond. Front Genet. 2013;4:131. [DOI] [PMC free article] [PubMed] [Google Scholar]
- [6].Erenpreisa J, Huna A, Salmina K, et al. Macroautophagy-aided elimination of chromatin: sorting of waste, sorting of fate? Autophagy. 2012. December;8(12):1877–1881. [DOI] [PMC free article] [PubMed] [Google Scholar]
- [7].Roberts P, Moshitch-Moshkovitz S, Kvam E, et al. Piecemeal microautophagy of nucleus in Saccharomyces cerevisiae. Mol Biol Cell. 2003;14(1):129–141. [DOI] [PMC free article] [PubMed] [Google Scholar]
- [8].Krick R, Muehe Y, Prick T, et al. Piecemeal microautophagy of the nucleus requires the core macroautophagy genes. Mol Biol Cell. 2008. October;19(10):4492–4505. [DOI] [PMC free article] [PubMed] [Google Scholar]
- [9].Krick R, Mühe Y, Prick T, et al. Piecemeal microautophagy of the nucleus: genetic and morphological traits. Autophagy. 2009. February;5(2):270–272. [DOI] [PubMed] [Google Scholar]
- [10].Mochida K, Oikawa Y, Kimura Y, et al. Receptor-mediated selective autophagy degrades the endoplasmic reticulum and the nucleus. Nature. 2015. June 18;522(7556):359–362. [DOI] [PubMed] [Google Scholar]
- [11].Mostofa MG, Rahman MA, Koike N, et al. CLIP and cohibin separate rDNA from nucleolar proteins destined for degradation by nucleophagy. J Cell Biol. 2018;217:2675–2690. [DOI] [PMC free article] [PubMed] [Google Scholar]
- [12].Dawaliby R, Mayer A. Microautophagy of the nucleus coincides with a vacuolar diffusion barrier at nuclear-vacuolar junctions. Mol Biol Cell. 2010. December;21(23):4173–4183. [DOI] [PMC free article] [PubMed] [Google Scholar]
- [13].Kvam E, Goldfarb D. Nucleus-vacuole junctions and piecemeal microautophagy of the nucleus in S. cerevisiae. Autophagy. 2007. March 1;3(2):85–92. [DOI] [PubMed] [Google Scholar]
- [14].Pan X, Roberts P, Chen Y, et al. Nucleus-vacuole junctions in Saccharomyces cerevisiae are formed through the direct interaction of Vac8p with Nvj1p. Mol Biol Cell. 2000. July;11(7):2445–2457. [DOI] [PMC free article] [PubMed] [Google Scholar]
- [15].Kvam E, Gable K, Dunn TM, et al. Targeting of Tsc13p to nucleus-vacuole junctions: a role for very-long-chain fatty acids in the biogenesis of microautophagic vesicles. Mol Biol Cell. 2005. September;16(9):3987–3998. [DOI] [PMC free article] [PubMed] [Google Scholar]
- [16].Schneiter R, Kohlwein SD. Organelle structure, function, and inheritance in yeast: a role for fatty acid synthesis? Cell. 1997. February 21;88(4):431–434. [DOI] [PubMed] [Google Scholar]
- [17].Kvam E, Goldfarb DS. Nvj1p is the outer-nuclear-membrane receptor for oxysterol-binding protein homolog Osh1p in Saccharomyces cerevisiae. J Cell Sci. 2004. October 1;117(Pt 21):4959–4968. [DOI] [PubMed] [Google Scholar]
- [18].Murley A, Sarsam RD, Toulmay A, et al. Ltc1 is an ER-localized sterol transporter and a component of ER-mitochondria and ER-vacuole contacts. J Cell Biol. 2015. May 25;209(4):539–548. [DOI] [PMC free article] [PubMed] [Google Scholar]
- [19].Elbaz-Alon Y, Eisenberg-Bord M, Shinder V, et al. Lam6 regulates the extent of contacts between organelles. Cell Rep. 2015. July 7;12(1):7–14. [DOI] [PMC free article] [PubMed] [Google Scholar]
- [20].Hariri H, Rogers S, Ugrankar R, et al. Lipid droplet biogenesis is spatially coordinated at ER-vacuole contacts under nutritional stress. EMBO Rep. 2018. January;19(1):57–72. [DOI] [PMC free article] [PubMed] [Google Scholar]
- [21].Hariri H, Speer N, Bowerman J, et al. Mdm1 maintains endoplasmic reticulum homeostasis by spatially regulating lipid droplet biogenesis. J Cell Biol. 2019. April 1;218(4):1319–1334. [DOI] [PMC free article] [PubMed] [Google Scholar]
- [22].Eisenberg-Bord M, Mari M, Weill U, et al. Identification of seipin-linked factors that act as determinants of a lipid droplet subpopulation. J Cell Biol. 2018. January 2;217(1):269–282. [DOI] [PMC free article] [PubMed] [Google Scholar]
- [23].Yamashita S-I, Oku M, Wasada Y, et al. PI4P-signaling pathway for the synthesis of a nascent membrane structure in selective autophagy. J Cell Biol. 2006. June 5;173(5):709–717. [DOI] [PMC free article] [PubMed] [Google Scholar]
- [24].Baba M, Osumi M, Scott SV, et al. Two distinct pathways for targeting proteins from the cytoplasm to the vacuole/lysosome. J Cell Biol. 1997. December;139(7):1687–1695. [DOI] [PMC free article] [PubMed] [Google Scholar]
- [25].Suzuki K, Akioka M, Kondo-Kakuta C, et al. Fine mapping of autophagy-related proteins during autophagosome formation in Saccharomyces cerevisiae. J Cell Sci. 2013. June 1;126(Pt 11):2534–2544. [DOI] [PubMed] [Google Scholar]
- [26].Meiling-Wesse K, Barth H, Thumm M. Ccz1p/Aut11p/Cvt16p is essential for autophagy and the cvt pathway. FEBS Lett. 2002. August 28;526(1–3):71–76. [DOI] [PubMed] [Google Scholar]
- [27].Oku M, Warnecke D, Noda T, et al. Peroxisome degradation requires catalytically active sterol glucosyltransferase with a GRAM domain. Embo J. 2003. July 1;22(13):3231–3241. [DOI] [PMC free article] [PubMed] [Google Scholar]
- [28].Mukaiyama H, Baba M, Osumi M, et al. Modification of a ubiquitin-like protein Paz2 conducted micropexophagy through formation of a novel membrane structure. Mol Biol Cell. 2004. January;15(1):58–70. [DOI] [PMC free article] [PubMed] [Google Scholar]
- [29].Farré J-C, Manjithaya R, Mathewson RD, et al. PpAtg30 tags peroxisomes for turnover by selective autophagy. Dev Cell. 2008. March;14(3):365–376. [DOI] [PMC free article] [PubMed] [Google Scholar]
- [30].Toulmay A, Prinz WA. Direct imaging reveals stable, micrometer-scale lipid domains that segregate proteins in live cells. J Cell Biol. 2013. August;202(1):35–44. [DOI] [PMC free article] [PubMed] [Google Scholar]
- [31].Moskvina E, Schuller C, Maurer CT, et al. A search in the genome of Saccharomyces cerevisiae for genes regulated via stress response elements. Yeast. 1998. August;14(11):1041–1050. [DOI] [PubMed] [Google Scholar]
- [32].Millen JI, Krick R, Prick T, et al. Measuring piecemeal microautophagy of the nucleus in Saccharomyces cerevisiae. Autophagy. 2009. January;5(1):75–81. [DOI] [PubMed] [Google Scholar]
- [33].Millen JI, Pierson J, Kvam E, et al. The luminal N-terminus of yeast Nvj1 is an inner nuclear membrane anchor. Traffic. 2008. September;9(10):1653–1664. [DOI] [PMC free article] [PubMed] [Google Scholar]
- [34].Vevea JD, Garcia EJ, Chan RB, et al. Role for Lipid Droplet Biogenesis and Microlipophagy in Adaptation to Lipid Imbalance in Yeast. Dev Cell. 2015. December 7;35(5):584–599. [DOI] [PMC free article] [PubMed] [Google Scholar]
- [35].Bhaskara RM, Grumati P, Garcia-Pardo J, et al. Curvature induction and membrane remodeling by FAM134B reticulon homology domain assist selective ER-phagy. Nat Commun. 2019. May 30;10(1):2370. [DOI] [PMC free article] [PubMed] [Google Scholar]
- [36].Oku M, Sakai Y. Three distinct types of microautophagy based on membrane dynamics and molecular machineries. Bioessays. 2018. June;40(6):1800008. [DOI] [PubMed] [Google Scholar]
- [37].Thumm M, Egner R, Koch B, et al. Isolation of autophagocytosis mutants of Saccharomyces cerevisiae. FEBS Lett. 1994. August 1;349(2):275–280. [DOI] [PubMed] [Google Scholar]
- [38].Janke C, Magiera M, Rathfelder N, et al. A versatile toolbox for PCR-based tagging of yeast genes: new fluorescent proteins, more markers and promoter substitution cassettes. Yeast. 2004. August 1;21(11):947–962. [DOI] [PubMed] [Google Scholar]
- [39].Schindelin J, Arganda-Carreras I, Frise E, et al. Fiji: an open-source platform for biological-image analysis. Nat Methods. 2012. June 28;9(7):676–682. [DOI] [PMC free article] [PubMed] [Google Scholar]
- [40].Suzuki K, Kirisako T, Kamada Y, et al. The pre-autophagosomal structure organized by concerted functions of APG genes is essential for autophagosome formation. EMBO J. 2001. November 1;20(21):5971–5981. [DOI] [PMC free article] [PubMed] [Google Scholar]
- [41].Graef M, Friedman JR, Graham C, et al. ER exit sites are physical and functional core autophagosome biogenesis components. Mol Biol Cell. 2013. September;24(18):2918–2931. [DOI] [PMC free article] [PubMed] [Google Scholar]
- [42].Sikorski R, Hieter P. A system of shuttle vectors and yeast host strains designed for efficient manipulation of DNA in Saccharomyces cerevisiae. Genetics. 1989;122(1):19–27. [DOI] [PMC free article] [PubMed] [Google Scholar]
- [43].Niedenthal RK, Riles L, Johnston M, et al. Green fluorescent protein as a marker for gene expression and subcellular localization in budding yeast. Yeast. 1996. June;12(8):773–786. [DOI] [PubMed] [Google Scholar]
Associated Data
This section collects any data citations, data availability statements, or supplementary materials included in this article.