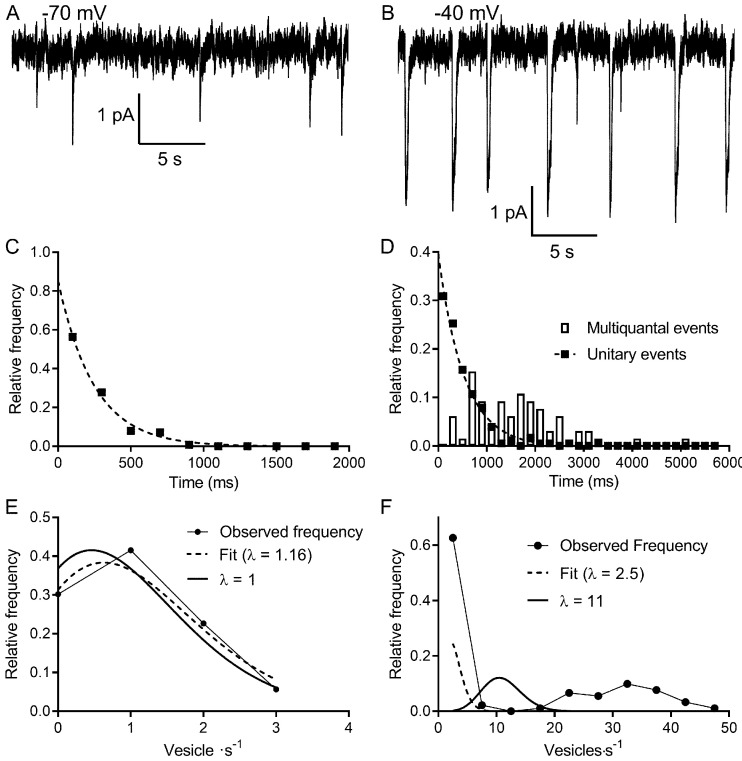
Figure 2. Multivesicular release events are not Poisson distributed in time.
(A, B) Lengthy recording segments illustrating the stochastic release of individual vesicles at −70 mV (A) with more regular multivesicular release events at −40 mV (B). (C) Plot of the interevent interval frequency distribution for unitary events measured at −70 mV. Consistent with a Poisson distribution, these data were well fit with a one-phase exponential decay (τ = 248 ms; R2 = 0.993). (D) Frequency histogram of intervals between both unitary (filled squares) and multivesicular (open bars) events. The distribution of intervals between unitary events was well described by a single exponential function (τ = 532 ms; R2 = 0.985), whereas the intervals between multivesicular events were poorly fit with a single exponential. (E) Graph of the relative frequency of individual vesicle release events measured at −70 mV occurring in 1 s bins measured over 90–180 s. Data were fit with the Poisson equation (Equation 6) constrained to the observed mean of λ = 1 event per s (dashed line, calculated, R2 = 0.88). We obtained an even better fit but with a similar value for λ when it was unconstrained (dashed line, fit λ = 1.16, R2 = 0.95). Data from the same cell shown in (C and D). (F) Graph of the relative frequency of quanta released in each 1 s bin. If we consider each of the quanta released in a multivesicular event as separate release events, then there were either 0 or ~35 quanta released per second. This distribution was not well described by Poisson statistics, whether λ was constrained to match the actual mean quantal rate of 10.98 (solid line, R2 = −0.39) or when λ was unconstrained (dashed line, best fit λ = 2.5, R2 = 0.46).

