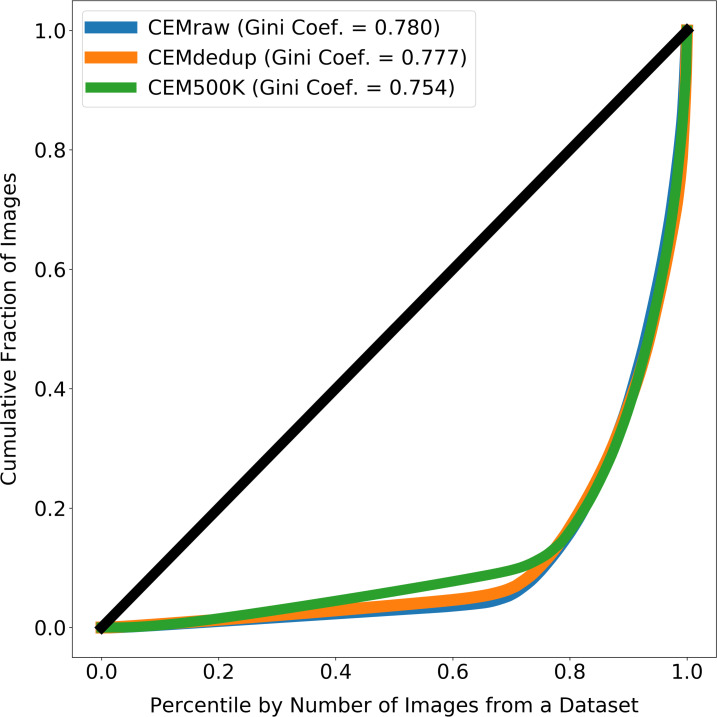
Appendix 1—figure 6. Images from source electron microscopy (EM) volumes are unequally represented in the subsets of CEM.
The line at 45° shows the expected curve for perfect equality between all source volumes (i.e. each volume would contribute the same number of images to CEMraw, CEMdedup, or CEM500K). Gini coefficients measure the area between the Lorenz Curves and the line of perfect equality, with 0 meaning perfect equality and 1 meaning perfect inequality. For each subset of cellular electron microscopy (CEM), approximately 20% of the source 3D volumes account for 80% of all the 2D patches.

