Abstract
Space and time are both essential features of episodic memory. However, while spatial tasks have been used effectively to study the behavioral relevance of place cells, the behavioral paradigms utilized for the study of time cells have not used time duration as a variable that animals need to be aware of to solve the task. In order to evaluate how time flow is coded into memory, time duration needs to be a variable that animals use to solve the behavioral task. This protocol describes a novel behavioral paradigm, the time duration discrimination (TDD) task, which is designed to directly investigate the neurological mechanisms that underlie temporal processing. During the TDD task, rats navigate around a Figure-8 Maze, which contains a rectangular track with a central arm and a delay box at the end of the central arm. While confined to the delay box, rats experience a 10- or 20-second time delay, during which a tone will play for the duration of the 10- or 20-second delay. When the delay box opens, the rat will choose whether to turn left or right out of the delay box and receive a reward for the correct choice (e.g., 10 seconds = left turn; 20 seconds = right turn). By directly manipulating elapsed time, we can better explore the behavioral relevance of hippocampal time cells and whether the time-dependent activity seen in physiological recordings of hippocampal neurons reflects a neuronal representation of time flow that can be used by the animal for learning and storing memories.
Graphic abstract:
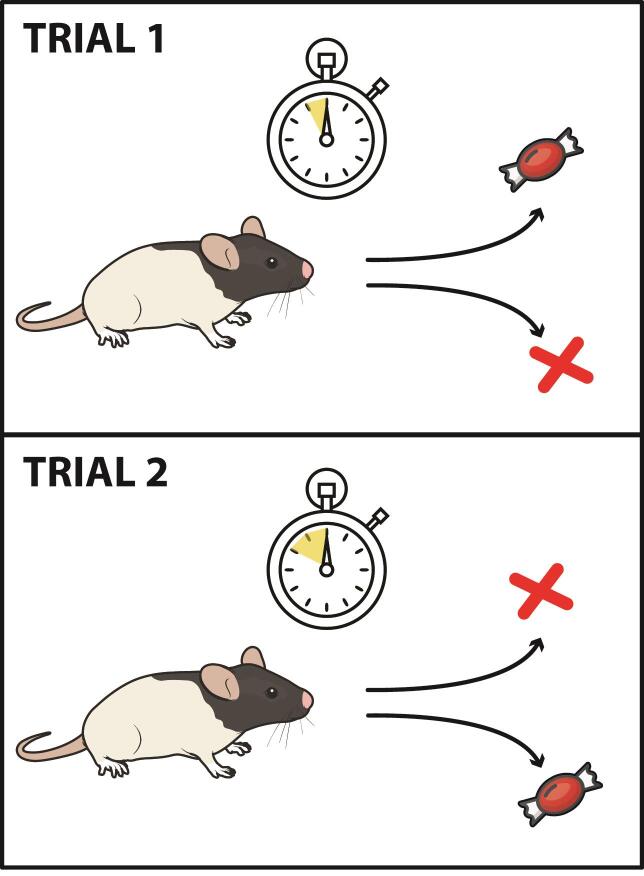
Elapsed time duration discrimination in rats
Keywords: Rat, Behavior, Temporal processing, Time cells, Episodic memory, Time duration discrimination
Background
Episodic memory formation features the organization of events in both a temporal and spatial context. Previous research has identified place cells that fire at specific locations and time cells that fire sequentially during an experience, providing evidence that this contextualizing and organization occurs in the hippocampus ( MacDonald et al., 2011 ; Eichenbaum, 2014). Sequential neuronal firing has also been recently identified in the medial entorhinal cortex (MEC) that projects to the hippocampus, suggesting that the MEC may provide temporal input to the hippocampal cells ( Kraus et al., 2015 ; Schlesiger et al., 2015 ; Heys and Dombeck, 2018). However, in studies that have examined the firing patterns of these temporally selective cells, what was evaluated and measured was whether events were remembered (for example using an alternation or delayed matching-to-sample task), which does not require animals to discriminate elapsed time intervals. Therefore, the awareness of elapsing time, or the neuronal firing of time cells as a reflection of this awareness, remains largely an assumption. In order to evaluate that time flow is coded into memory, duration must be a relevant variable that animals need to process in order to correctly perform the task. The novel time duration discrimination (TDD) task described here required animals to discriminate between delay intervals in order to receive a reward for correctly completing the task. This task was utilized in a recent study to demonstrate that hippocampal function is required for the discrimination of elapsed time intervals ( Sabariego et al., 2021 ). The protocol presented provides a method in which to study the ability of animals to associate specific intervals of elapsed time with certain outcomes and can be utilized as a tool for monitoring behavior. In addition, this task could be used to examine whether time cell sequences would distinguish time duration when the task requires animals to pay attention to elapsed time, which could shed light on the neural mechanisms of time perception and episodic memory.
Materials and Reagents
Paper towels
Pencil
Eraser
Nitrile Gloves (e.g., Genesee Scientific, X-GEN Nitrile Gloves, catalog number: 44-100)
Source of dim light (i.e., desk lamp)
Food rewards (i.e., Cocoa PebblesTM)
Weigh boats (e.g., Fisher Scientific, Hexagonal Weighing Dishes, catalog number: 02-202-102)
Data recording sheets (see Appendix 1)
Experimentally naive, male Long-Evan rats weighing between 300 g-400 g (approximately 3-4 months old); ordered from Charles River
Water
Ethanol 70% (e.g., Fisher Scientific, Decon Laboratories, catalog number: 04-355-223)
Note: Materials listed in this section are based on what has been successfully used in the experiment using the protocol provided; however, usage of different rat strains/weights/sex, and food rewards could also be successful.
Equipment
-
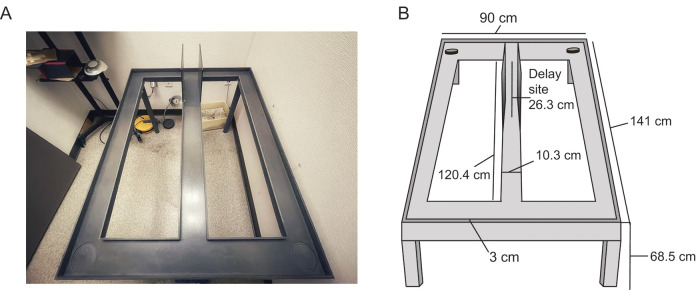
Figure-8-Maze (Figure 1)
The maze was constructed from sanded gray hard polyvinyl chloride.
Dimensions: Runways were constructed measuring 10.3 cm wide with 3 cm tall walls on each side. The center stem of the maze was measured to be 120.4 cm with cross pieces at the end of the central stem measuring 90 cm in length. The maze was put on top of five legs measured to be 68.5 cm each. Two moveable barriers were placed 26.3 cm apart at one end of the central stem. The side walls between the two movable doors were 24.5 cm high and created the delay area. The two circles at the ends of the top cross piece are the reward sites (the locations where the rewards are placed at the end of the delay periods).
Weighing Scale (e.g., Fisher Scientific, catalog number: 20031)
PVC barriers: Dimensions: 10.3 cm wide to fit the runway width
Stopwatch (e.g., Fisher Scientific, catalog number: 14-649-8)
Laptop Computer
Infrared camera (ZOSI 1080P HD 1920TVL, model: 1AC-2317A-B)
White noise generator (e.g., Portale White Noise Sound Machine from HoMedics Sound Spa; 2,000 Hz, 70dB)
Figure 1. Figure-8 maze used for behavioral testing.
A. Photograph of the figure-8 maze. Delay site is located within the side barriers on the far end of the center stem. B. Illustration of the maze with measurement specifications of each section. Circles identify the reward sites.
Software
The software listed below pertains to what has been used successfully based on the protocol provided; thus, using an alternative software for scoring could also be successful.
Microsoft Excel
Online tone generator ( https://onlinetonegenerator.com/ )
Statistical package for data analysis (i.e., GraphPad prism, SPSS, R)
Procedure
-
General Information
Rats should be housed individually.
-
Keep rats on a 12 h light/dark cycle with behavioral testing carried out during the light cycle.
Note: Behavioral testing during the dark phase could also be successful.
Before behavioral training, rats should gradually be food deprived until reaching 80%-85% of their ad libitum weight, and they should be maintained at this weight throughout the experiment.
Water should always be kept available.
The animals should be receiving Cocoa PebblesTM in their home cages for at least 4 days before the habituation day.
During those 4 days, the animals should be handled by all experimenters (~5 min per experimenter with each animal).
Rats should be weighed daily, right before the behavioral session.
Rats should be fed within 30 min after each behavioral session ends.
The experiment should always be carried out at approximately the same time of the day and in total silence, except for constant white noise produced by the white noise generator at low volume.
Each rat should be carried to the experimental room and back to the vivarium individually.
Any kind of unnecessary interference should be avoided.
Odor cues should be provided to prevent the rat from making its decision based on the smell of the reward. Weigh boats filled with Cocoa PebblesTM can be taped below the maze under the two reward areas to balance any olfactory cues.
Experimenters should not wear cologne/perfume or strong scented deodorant.
Salient visual cues (e.g., wall posters of different sizes and images) should be available in the room, and they should be kept constant.
-
Habituation
Each rat will be individually allowed to explore the maze freely and familiarize itself with the room and the maze for 10 min on two consecutive days. Cocoa PebblesTM should be spread all over the maze.
At the end of every 10 min session, take the rat back in its home cage and clean the maze with a 70% ethanol solution. Make sure the maze is dry before the next rat is placed on the maze.
Make sure the homecage bedding is kept clean to avoid rats from consuming their waste. This could interfere with the food deprivation procedure/weight loss.
Feed all the rats within 30 min after the end of the behavioral session according to their weights, so that subjects are maintained at the ~80%-85% of their ad libitum weight.
Throughout habituation, add pieces of the food reward into the animal’s homecage to avoid neophobia.
-
Training phase
-
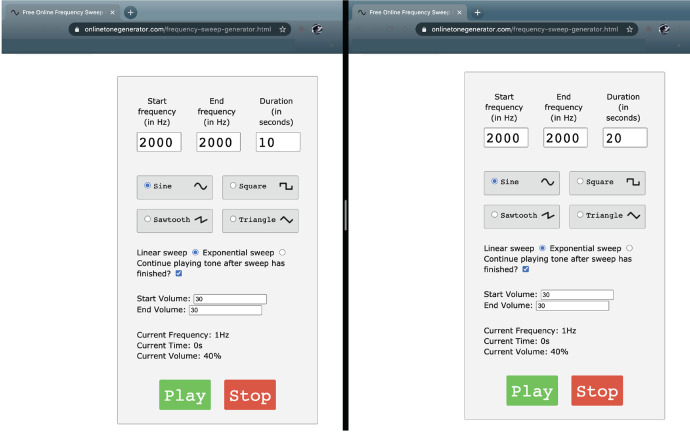
Open the online tone generator ( https://onlinetonegenerator.com/ ) in two separate windows (Figure 2).
Set one window to play a 10-s 2,000 Hz tone at a volume of 70 dB
Set another window to play a 20-s 2,000 Hz tone at a volume of 70 dB
On day seven, weigh the animal and place it at the base of the central stem of the apparatus, facing the delay area. Every trial should start from this position.
Once the animal is placed in the delay area, close the barriers and play either a 10-s or 20-s tone using the previously set online tone generator.
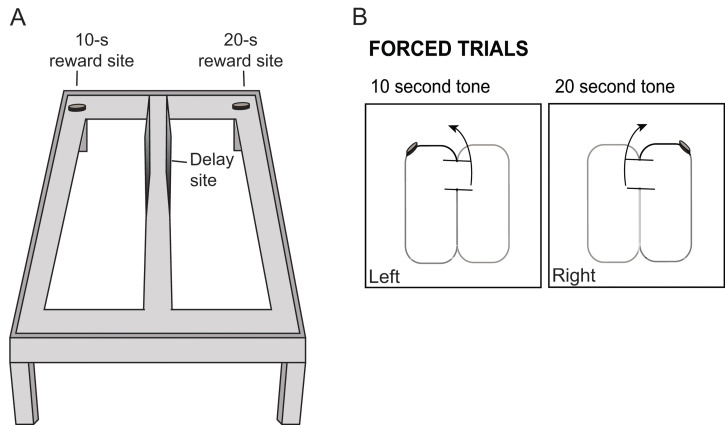
When the tone ends, lift the delay area barrier and with a movable barrier force the animal to turn to the left if the delay time is 10-s or to the right if the delay time is 20-s. The arm (left/right) and delay (10-s/20-s) could be counterbalanced between animals (so that some animals are trained to turn left after a 10-s delay and other animals are trained to turn right after such delay) and between trials (so that the trial order changes from session to session). There should always be a reward at the end of the choice arm. See Figure 3 for an illustration of the training phase.
After consuming the reward, the rat must return back to the delay area. It is crucial to prevent the rats from turning around and retracing their own routes.
Each session should last 30 min or consist of 40 trials, whichever comes first, and the number of 10-s and 20-s trials should be equal.
-
Repeat this procedure, using the movable barriers to guide the animal, until the animals navigate the maze consistently and correctly and eat the reward on every trial during 2 consecutive days.
Note: In our studies, rats required anywhere from 7-25 days to reach this criterion.
Clean the maze with a 70% ethanol solution after each session and make sure it is dry before starting the next animal.
Feed the rats within 30 min after the end of the behavioral session according to their weights.
-
-
Test phase
Weigh the subject, and place it at the base of the central stem of the apparatus, facing the delay area. Every trial should start from this position.
The use of barriers to force the animals to turn to the left or the right should be phased out. After the 10- or 20-s tone is played during the delay, the barrier is lifted and the rat will be able to freely enter either choice arm.
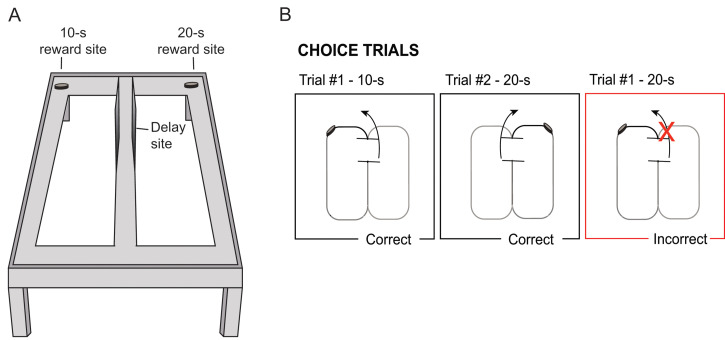
The animal is rewarded only for choosing the arm paired with the discriminative stimulus (e.g., 10-s delay=reward on the left; 20-s delay=reward on the right). See Figure 4 for an illustration of the testing phase.
Even though the rats are allowed to run with no barriers, the experimenter should be sure to prevent rats from retracing their steps at any point by holding a barrier in their way if they turn around.
Each session should last 30 min or consist of 40 trials, whichever comes first, and the number of 10-s and 20-s trials should be equal.
For each trial, score the chosen arm as either correct or incorrect (see Appendix 1 for sample score sheet).
Feed each animal according to its weight within 30 min after the end of the behavioral session.
Clean the maze with a 70% ethanol solution after each session.
Repeat the test phase daily until the animal performs the task at 90% of correct responses for 2 out of 3 days.
-
When rats reach a criterion performance of at least (90%) correct trials on 2 out of 3 consecutive days, a manipulation like a lesion surgery could be performed.
Note: In our studies, rats required anywhere from 5-25 weeks to reach this criterion.
In the postoperative phase, repeat the procedure to test whether the performed manipulation caused a behavioral or a physiological impairment.
Figure 5 illustrates a sample testing timeline adapted from Sabariego et al. (2021) .
Figure 2. Online tone generator set-up configuration.
Example of the window arrangement used on the laptop computer to deliver the corresponding tones during behavioral testing.
Figure 3. Illustration of the training phase.
A. Illustration of figure-8 maze with reward sites for each of the delay intervals. B. Schematic of corresponding tone and turn directions in order to receive a reward. Animals are trained prior to testing by being forced to turn left after a ten second tone is played, and right after a twenty second tone is played.
Figure 4. Illustration of the testing phase.
A. Illustration of figure-8 maze with reward sites for each of the delay intervals. B. Schematic of correct and incorrect trials. After each delay, rats are able to choose to turn left or right; rewards are received for a left turn after a ten second delay or for a right turn after a twenty second delay.
Figure 5. Example testing timeline for a lesion experiment in the TDD task.
Sample experimental timeline (adapted from Sabariego et al., 2021 ).
Data analysis
Note: Use Microsoft Excel or similar software to record the behavioral data for each stage of the experiment.
-
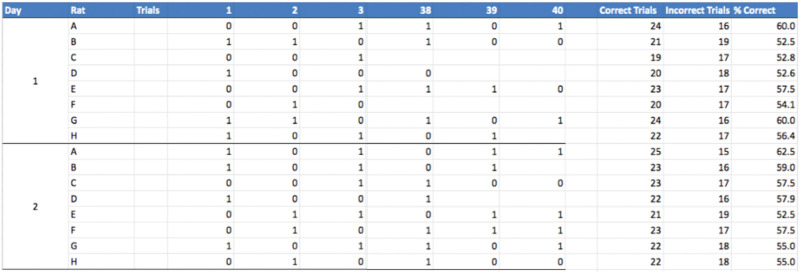
For the testing phase, enter data into an Excel spreadsheet with the following columns (Figure 6)
Day of Testing (e.g., day 1, day 2, day 3)
Rat Number/Letter
Number of trials (1-40)
Correct Trials
Incorrect Trials
% Correct
For each correct trial the rat completes, enter 1, otherwise 0.
The columns for Correct Trials and Incorrect Trials should be a calculated sum of the correct/incorrect trials, and % Correct column should be a calculated percentage of correct trials.
-
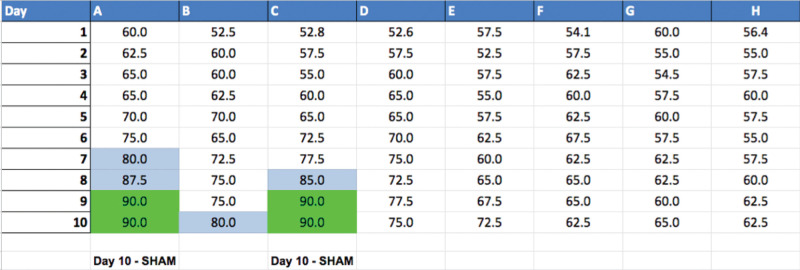
Throughout the testing phase, enter data into a separate table to keep track of when each rat reaches criterion performance with the following columns (see Figure 7).
Day of testing (e.g., day 1, day 2, day 3)
-
Separate column for each rat.
Record the percentage correct for each rat on each day.
Highlight anything over 80%.
Highlight anything 90% + in a different color.
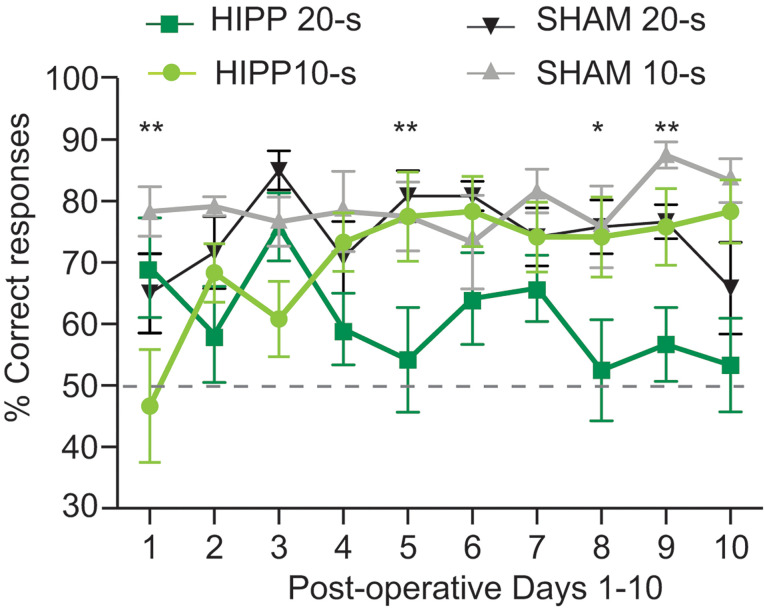
Use a statistical package (i.e., SPSS, GraphPad Prism, R) to perform two-way anova inferences to analyze the differences between the animal groups and the types of delays. Figure 8 illustrates representative data adapted from Sabariego et al. (2021) . Multiple comparisons of the significant interactions can be analyzed using a post hoc test.
Figure 6. Excel spreadsheet showing recorded data for the second stage, and summary table (right side) of the results with the sum of the correct trials, sum of the incorrect trials, and percentage of correct trials.
Column 1 represents the session (day) for each rat. There are a total of 40 trials per session (day): all trials are used for analyses, but the trials shown in this figure are limited to trials 1, 2, 3, 38, 39, and 40. There are 8 rats: A-D are the sham rats and E-H are the lesioned rats.
Figure 7. Excel spreadsheet showing the percentage correct for each rat on each day of testing. Boxes highlighted in blue are sessions in which the rat scored 80%-89% and boxes highlighted in green are session in which the rat reached the 90% criterion.
Rats that have reached the criterion performance for two out of three consecutive days have completed testing. These rats are assigned their surgery type, and their last day of testing is recorded at the bottom of their column.
Figure 8. Example representative data plotted from a lesion experiment in the TDD task.
Percent correct responses separated by delay length for hippocampus- (HIPP) and sham-lesioned rats across the first 10 days of postoperative testing for each rat. Three-factor analysis of variance of the percentage of correct responses obtained during the TDD task found significant interactions between days x delay x lesion and between days x delay, and a main effect of lesion, *P < 0.05, **P <0 .01 (adapted from Sabariego et al., 2021 ).
Acknowledgments
This protocol was adapted from Sabariego et al.(2021 ). This work was supported by the University of San Diego, College of Arts and Sciences and Mount Holyoke College. The authors would like to thank Scidraw.io (doi: 10.5281/zenodo.3926042.) for providing free drawings that helped the creation of the graphical abstract.
Competing interests
The authors have no conflicts of interest.
Ethics
All experimental procedures were approved by the Institutional Animal Care and Use Committee at the University of San Diego (IACUC approval numbers 0416-01 and 0319-01) and at Mount Holyoke College (IACUC approval number NR-01-0620).
Citation
Readers should cite both the Bio-protocol article and the original research article where this protocol was used.
Supplementary Data.
References
- 1. Eichenbaum H.(2014). Time cells in the hippocampus: a new dimension for mapping memories. Nat Rev Neurosci 15(11): 732-744. [DOI] [PMC free article] [PubMed] [Google Scholar]
- 2. Heys J. G. and Dombeck D. A.(2018). Evidence for a subcircuit in medial entorhinal cortex representing elapsed time during immobility. Nat Neurosci 21(11): 1574-1582. [DOI] [PMC free article] [PubMed] [Google Scholar]
- 3. Kraus B. J., Brandon M. P., Robinson R. J., 2nd, Connerney M. A., Hasselmo M. E. and Eichenbaum H.(2015). During Running in Place, Grid Cells Integrate Elapsed Time and Distance Run. Neuron 88(3): 578-589. [DOI] [PMC free article] [PubMed] [Google Scholar]
- 4. MacDonald C. J., Lepage K. Q., Eden U. T. and Eichenbaum H.(2011). Hippocampal"time cells" bridge the gap in memory for discontiguous events. Neuron 71(4): 737-749. [DOI] [PMC free article] [PubMed] [Google Scholar]
- 5. Sabariego M., Tabrizi N. S., Marshall G. J., McLagan A. N., Jawad S. and Hales J. B.(2021). In the temporal organization of episodic memory, the hippocampus supports the experience of elapsed time. Hippocampus 31(1): 46-55. [DOI] [PubMed] [Google Scholar]
- 6. Schlesiger M. I., Cannova C. C., Boublil B. L., Hales J. B., Mankin E. A., Brandon M. P., Leutgeb J. K., Leibold C. and Leutgeb S.(2015). The medial entorhinal cortex is necessary for temporal organization of hippocampal neuronal activity. Nat Neurosci 18(8): 1123-1132. [DOI] [PMC free article] [PubMed] [Google Scholar]
Associated Data
This section collects any data citations, data availability statements, or supplementary materials included in this article.


