

Abstract
Background:
Hepatocellular carcinoma (HCC) is a major health concern in many countries including Egypt. The alteration in DNA methylation that was observed in HCC patients suggests a possible role of DNA methyltransferases (DNMTs) in the disease pathogenesis in addition to potential role as a disease biomarker. Aim: To study the change in DNMTs expression in chronic HCV infected patients as potential non- invasive biomarker for diagnosis of hepatocellular carcinoma.
Methods:
26 patients with HCC, 45 patients with liver cirrhosis, 20 chronic HCV patients and 20 apparently healthy individuals as a control group were enrolled in this study. Real-Time Quantitative Reverse Transcription PCR (qRT-PCR) was performed for all study participants.
Results:
A significant difference in DNMTs expression was observed among the studied groups. Receiver operating characteristics (ROC) curve analysis revealed that with a cutoff value of 3.16 for DNMT 3A expression, sensitivity and specificity were 80.8 and 95.6% respectively and area under curve (AUC) was 0.958, p< 0.001 for discriminating hepatocellular carcinoma among post hepatitis C cirrhotic patients. Besides DNMT 3B relative expression cutoff value of 3.10 showed 84.6% sensitivity and 77.8% specificity and AUC was 0.888, p< 0.001. On the other hand, cutoff value 0.65 for DNMT1 relative expression showed 92.3% sensitivity and 44.4% specificity and AUC was 0.72, p= 0.002. DNMT1, DNMT 3A and DNMT 3B have significant positive correlation with the level of AFP (p-value = 0.003, 0.004 and 0.008 respectively). The relative expression of DNMT3B was significantly correlated to focal lesion size (p-value = 0.015). High DNMTs expression was significantly associated with the presence of multiple focal lesions but not with the Child Pugh grade (p> 0.05).
Conclusion:
The mRNA levels of DNMTs could be a potential biomarker for early detection of HCC development.
Key Words: Hepatocellular carcinoma, DNA methlyltransferase, epigenetics, DNA methylation, HCV
Introduction
Hepatocellular carcinoma (HCC) is a universal health problem representing the sixth common cancer (Forner et al., 2018). It represents sixth most common cancer in women and second most common cancer in men in Egypt (Naguib et al., 2020). Increased incidence of HCC in Egypt is due to the high prevalence and complications of the hepatitis C virus (HCV) (Abudeif, 2019).
Although generally there is decrease in the prevalence of chronic hepatitis C infection, its complications are increasing due to progression of liver fibrosis and aging of the infected population (Schanzer et al., 2014). Hence, there is crucial need for studying different pathways to help in recognizing new biomarkers for prediction of HCC among chronic liver disease patients and development of new therapeutic approaches (De Stefano et al., 2018).
DNA aberrant methylation is one of the most important epigenetic factors that plays an important role in cancer development. HCC is characterized by large scale genomic DNA hypomethylation associated with locus-specific hypermethylation. Hypermethylation of promotor CpG leads to gene silencing of tumor suppressor genes (Pogribny and Rusyn, 2014). Silencing of these genes plays important role in molecular pathways of carcinogenesis such as cell adhesion or DNA repair, apoptosis, and cell cycle regulation (Wahid et al., 2017).
In addition, changes in DNA methylation influence not only cancer cells but also the tumor microenvironment which include the stromal cells and the immune cells. DNA methylation of stromal cells participates in carcinogenesis through altering intercellular interactions with altered tissue architecture and cell signaling. DNA methylation of immune cells impairs their response and lead to immune evasion of tumor (Zhang et al., 2017).
DNA methylation is mediated by a group of enzymes including the DNA methyltransferases (DNMTs) family. DNMT3A and DNMT3B mediate de novo methylation and act on both unmethylated and hemi- methylated DNA, while the DNMT1 show preference to hemi- methylated DNA thus function mainly to preserve preexisting methylations and is responsible for heritability of methylation during mitosis (Meng et al., 2015).
Numerous researches evaluated DNA methylation and DNMTs role in HCC, however they were conducting their studies on liver tissues. Thus, in the current study, we aimed to evaluate the expression of DNMT1, DNMTs 3A and 3B in the peripheral blood as non- invasive diagnostic markers for discrimination of HCC among patients with chronic hepatitis C virus (HCV) infection. In addition, this could provide helpful data about potential therapeutic efficacy of DNMT inhibitors on HCC in the future.
Materials and Methods
Studied subjects
The current case control study was conducted at hepatology and gastroenterology department, National Liver Institute, Menoufia University. Adult chronic HCV patients were entitled in the study. Cirrhosis was established by clinical findings, radiological investigations. HCC was diagnosed by detecting focal lesion in the liver on abdominal ultrasound examination and/or elevated alfa fetoprotein more than 200 ng per ml. It was confirmed by characteristic vascular enhancement pattern detected by multislice triphasic spiral CT scan or MRI (EASL guidelines, 2018). In addition, 20 apparently healthy individuals were enrolled as control group.
Patients coinfected with other viruses as HBV or HIV, patients with liver tumors other than HCC or tumors metastasizing in the liver were excluded from the study. The study was conformed to the ethical guidelines of the 1975 Declaration of Helsinki. Ethical committee of National Liver Institute approved the protocol of this study and informed consents were taken from all participants.
Routine investigations
All participants were subjected to history taking, clinical examination radiological evaluation and laboratory investigations including complete blood count (Sysmex xp-300AM; Sysmex Corporation, Kobe, Japan), liver and kidney functions tests and AFP (Cobas 6000; Roche Diagnostics, Mannheim, Germany), prothrombin concentration assay (Sysmex CS- 1600; Sysmex Europe GmbH, Norderstedt, Germany). Child Pugh score was assessed for determining the severity of liver cirrhosis (Pugh et al., 1973).
Assessment of relative levels of expressed DNA methyltransferases enzymes through Real-Time Quantitative Reverse Transcription PCR (qRT-PCR)
EDTA anticoagulated whole blood samples were used and RNA extraction was performed using QIAamp RNA Blood Mini Kits (Catalog number: 52304, Qiagen, Hilden, Germany). The cDNA was obtained using the High-Capacity cDNA Reverse Transcription Kit (Catalog number: 4368814, Thermo Fisher Scientific, MA, USA). Quantitative real-time PCR was performed using Rotor-Gene Q System Real-Time PCR System (Qiagen GmbH, Hilden, Germany) through 25 μl total volume amplification mixture; 12.5 μl of Maxima SYBR Green qPCR Master Mix (2X) (Catalog number: K0251, Thermo Fisher Scientific, MA, USA), 1 μl of each primer, 3 μl of cDNA and 7.5 μl ddH2O. The primer sequences were designed as described previously (Tao et al., 2008) as the following:
DNMT1: F:5’AACCAAGCAAGAAGTGAAGCCC-3’, R 5’-GCAAAATGAGATGTGATGGTGG-3’; DNMT3A: F 5’-GGAGGAATGTGCCAAAACTG-3’, R 5’-GCAGTTGTTGTTTCCGCAC-3’; DNMT3B: F 5’-AACAGCATCGGCAGGAAC-3’, R: 5’-ATCTTTCCCCACACGAGG-3’; Beta-actin: F 5’-GGCACCCAGCACAATGAAG-3’, R: 5’-CGTCATACTCCTGCTTGCTG-3’
The PCR cycling conditions started with initial denaturation step (95°C for 10 min) followed by 45 cycles of three-steps (95°C for 15 s, 59°C for 30 s and 72°C for 30 s). Expression levels of DNMTs were normalized to that of the internal control Beta-actin and the fold change was calculated by 2-ΔΔCt method.
Statistical analysis
Results were statistically analyzed by using statistical package of social sciences (SPSS 22.0, IBM/SPSS Inc., Chicago, IL). For summarizing continuous skewed data, median and interquartile range (IQR). Categorical data was expressed as frequency and percentage. For continuous normally distributed variables, ANOVA test was used when normality and homogeneity assumptions were verified by Shapiro-Wilk test, instead Kruskal-Wallis tests was applied as assumptions were violated. Mann-Whitney or student t-test was used as appropriate for comparing two groups. The Pearson Chi-square (χ2) test or Fisher’s Exact test as appropriate was used to compare categorical variables. Multiple pairwise comparisons were adjusted using Bonferroni Post Hoc test after significant Kruskal-Wallis. Spearman correlation coefficient (rs) was calculated to indicate the strength of association between not normally distributed numerical variables. Receiver operating characteristic (ROC) analysis was used to assess the diagnostic performance of methyl transferases for HCC detection within cirrhotic patients. In all applied tests, the significance level was set at less than 0.05.
Results
Characteristics of the studied subjects
The current study recruited 91 patients. They were divided into chronic HCV infected patients with liver cirrhosis (n= 45) and chronic HCV infected patients without cirrhosis (n= 20), HCV related HCC patients (n= 26). In addition to twenty control subjects, there was no significant difference as regards age and gender among all groups (p= 0.06 and 0.295 respectively). Main clinical, laboratory and radiological findings of participating subjects are summarized in Table 1.
Table 1.
Comparisons between Control, HCV, Cirrhosis, and HCC Groups Regarding Age, Gender Distribution Biochemical Parameters and Radiological Findings
| Parameters | Control (n=20) |
HCV (n=20) |
Cirrhosis (n=45) |
HCC (n=26) |
P-value | Multiple comparisons | |
|---|---|---|---|---|---|---|---|
| Age (years) | 0.060 a | - | - | ||||
| Mean ± SD | 54.15 ± 3.51 | 54.75 ± 4.14 | 55.80 ± 4.15 | 57.27 ± 4.51 | |||
| Range (Min-Max) | 46.00 - 60.00 | 45.00 - 65.00 | 44.00 - 65.00 | 50.00 - 66.00 | |||
| Gender [n (%)] | 0.295 b | - | - | ||||
| Female | 8 (40.0) | 6 (30.0) | 9 (20.0) | 5 (19.2) | |||
| Male | 12 (60.0) | 14 (70.0) | 36 (80.0) | 21 (80.8) | |||
| Platelets (103 cell/µL) | < 0.001 b | P1=0.115 | P4<0.001 | ||||
| Median (IQR) | 321.50 (27.00) | 208.50 (19.00) | 135.00 (45.00) | 114.00 (78.25) | P2<0.001 | P5<0.001 | |
| Range (Min-Max) | 310.00 - 350.00 | 173.00 - 228.00 | 56.00 - 203.00 | 50.00 - 216.00 | P3<0.001 | P6=1.000 | |
| ALT (U/L) | 0.008 b | P1=0.019 | P4=1.000 | ||||
| Median (IQR) | 25.50 (4.00) | 45.00 (21.00) | 34.00 (40.00) | 36.00 (52.50) | P2=0.023 | P5=1.000 | |
| Range (Min-Max) | 22.00 - 32.00 | 19.00 - 59.00 | 11.00 - 110.00 | 16.00 - 156.00 | P3=0.021 | P6=1.000 | |
| AST (U/L) | < 0.001 b | P1=0.657 | P4=0.006 | ||||
| Median (IQR) | 24.00 (3.00) | 38.00 (19.00) | 72.00 (53.00) | 75.50 (121.25) | P2<0.001 | P5<0.001 | |
| Range (Min-Max) | 21.00 - 27.00 | 19.00 - 49.00 | 19.00 - 167.00 | 23.00 - 253.00 | P3<0.001 | P6=0.822 | |
| Total bilirubin (mg/dL) | < 0.001 b | P1=1.000 | P4<0.001 | ||||
| Median (IQR) | 0.61 (0.15) | 0.83 (0.14) | 1.70 (1.80) | 2.90 (4.71) | P2<0.001 | P5<0.001 | |
| Range (Min-Max) | 0.50 - 0.90 | 0.50 - 1.00 | 0.40 - 4.20 | 0.70 - 8.10 | P3<0.001 | P6=0.663 | |
| Albumin (g/dL) | < 0.001 b | P1=1.000 | P4<0.001 | ||||
| Median (IQR) | 4.60 (0.30) | 4.10 (0.26) | 2.60 (0.50) | 2.70 (0.70) | P2<0.001 | P5<0.001 | |
| Range (Min-Max) | 4.30 - 4.80 | 3.90 - 4.30 | 1.70 - 3.20 | 1.60 - 3.40 | P3<0.001 | P6=0.353 | |
| INR | < 0.001 b | P1=0.020 | P4=0.002 | ||||
| Median (IQR) | 1.03 (0.06) | 1.21 (0.07) | 1.35 (0.30) | 1.36 (0.37) | P2<0.001 | P5=0.001 | |
| Range (Min-Max) | 1.00 - 1.10 | 1.13 - 1.30 | 1.16 - 2.10 | 1.13 - 2.70 | P3<0.001 | P6=1.000 | |
| Creatinine (mg/dL) | 0.005 b | P1=1.000 | P4=1.000 | ||||
| Median (IQR) | 0.77 (0.11) | 0.82 (0.11) | 0.98 (0.75) | 1.03 (0.61) | P2=0.042 | P5=0.282 | |
| Range (Min-Max) | 0.68 - 0.90 | 0.76 - 0.90 | 0.60 - 2.00 | 0.47 - 3.44 | P3=0.004 | P6=1.000 | |
| AFP (ng/mL) | < 0.001 b | P1=0.505 | P4<0.001 | ||||
| Median (IQR) | 2.36 (0.65) | 4.30 (3.15) | 12.10 (13.46) | 99.00 (130.75) | P2<0.001 | P5<0.001 | |
| Range (Min-Max) | 1.81 - 3.05 | 0.80 - 10.00 | 4.73 - 60.50 | 1.10 - 602.00 | P3<0.001 | P6=0.027 | |
| Portal vein thrombosis [n (%)] | 0.001 b | ||||||
| Absent | – | – | 39 (86.7) | 13 (50.0) | |||
| Present | – | – | 6 (13.3) | 13(50.0) | |||
| Ascites [n (%)] | 0.091 d | ||||||
| Absent | – | – | 2 (4.4) | 2 (7.7) | |||
| Mild | – | – | 35 (77.8) | 14 (53.8) | |||
| Moderate | – | – | 8 (17.8) | 10 (38.5) | |||
ALT, Alanine aminotransferase; AST, Aspartate aminotransferase; INR, International normalized ratio; AFP, alfafetoprotein Significance level was at 0.05; IQR, Interquartile range (difference between 1st and 3rd quartiles); a, ANOVA test; b, Person Chi-square test; c, Kruskal-Wallis tests; d, Fisher’s Exact test; if significant, then multiple pairwise comparisons adjusted by Bonferroni post hoc test; P1, comparison between control and HCV groups; P2, comparison between control and cirrhosis groups; P3, comparison between control and HCC groups; P4, comparison between HCV and cirrhosis groups; P5, comparison between HCV and HCC groups; P6, comparison between cirrhosis and HCC groups.
Relative quantitative expression of DNMT 1, DNMT 3A and DNMT 3B
The relative expression of DNMT1, DNMT 3A and DNMT 3B was significantly higher in HCC (1.28, 8.28, 8.80 respectively) compared to control group (0.26, 0.42, 0.87 respectively) (p-value < 0.001). Also, expression of DNMT 3A and DNMT 3B in HCC was significantly elevated compared to chronic HCV patients (0.92 and 1.80 respectively) and cirrhotic patients (1.18 and 1.98 respectively) (p-value < 0.001). Besides, expression of DNMT 1 was significantly elevated in HCC group compared to chronic HCV patients (0.57, p= 0.002), however, there was no significant difference with cirrhotic patients (0.72, p= 0.051).
We detected significant difference in the expression level of DNMT1 and DNMT 3A and DNMT 3B between chronic HCV patients and control group (p= 0.042, 0.023 and 0.038 respectively). Also, cirrhotic patients group showed significantly higher levels of DNMT 1, DNMT 3A and DNMT 3B (0.72, 1.18 and 1.98 respectively) compared to control group (0.26; p < 0.001, 0.42; p= 0.001 and 0.87; p= 0.009 respectively), however, they showed no significant difference compared to chronic HCV patients (0.57; p= 0.609, 0.92; p= 1 and 1.80; p= 1 respectively) Table 2 and Figure 1.
Table 2.
Comparisons between Control, HCV, Cirrhosis, and HCC Regarding the Expression of DNMTs
| Parameters | Control (n=20) |
HCV (n=20) |
Cirrhosis (n=45) |
HCC (n=26) |
P-valuea | Multiple comparisons | |
|---|---|---|---|---|---|---|---|
| DNMT1 | <0.001 | P1=0.042 | P4=0.609 | ||||
| Median (IQR) | 0.26 (0.28) | 0.57 (0.73) | 0.72 (0.78) | 1.28 (1.11) | P2<0.001 | P5=0.002 | |
| Range (Min-Max) | 0.07 - 0.53 | 0.09 - 1.40 | 0.19 - 2.34 | 0.29 - 5.89 | P3<0.001 | P6=0.051 | |
| DNMT3A | <0.001 | P1=0.023 | P4=1.000 | ||||
| Median (IQR) | 0.42 (0.35) | 0.92 (2.24) | 1.18 (1.12) | 8.28 (16.65) | P2=0.001 | P5<0.001 | |
| Range (Min-Max) | 0.10 - 0.86 | 0.23 - 3.89 | 0.24 - 3.73 | 1.59 - 42.20 | P3<0.001 | P6<0.001 | |
| DNMT3B | <0.001 | P1=0.038 | P4=1.000 | ||||
| Median (IQR) | 0.87 (0.92) | 1.80 (2.14) | 1.98 (2.00) | 8.80 (26.27) | P2=0.009 | P5<0.001 | |
| Range (Min-Max) | 0.10 - 1.91 | 0.79 - 5.36 | 0.44 - 8.91 | 1.40 - 63.50 | P3<0.001 | P6<0.001 | |
Significance level was at level < 0.05; IQR, Interquartile range (difference between 1st and 3rd quartiles); a, Kruskal-Wallis test, if significant, then multiple pairwise comparisons adjusted by Bonferroni post hoc test, P1, comparison between control and HCV groups; P2, comparison between control and cirrhosis groups; P3, comparison between control and HCC groups; P4, comparison between HCV and cirrhosis groups; P5, comparison between HCV and HCC groups; P6, comparison between cirrhosis and HCC groups.
Figure 1A.
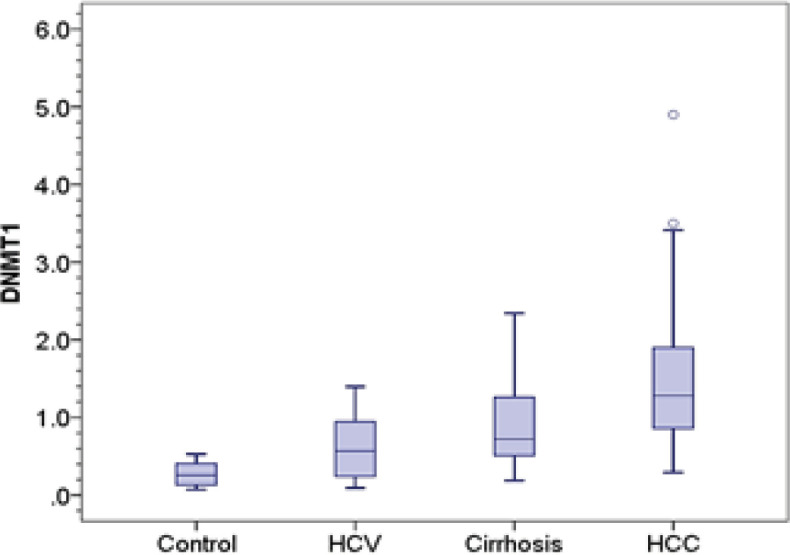
DNMT1 Distribution in Control, Chronic Hepatitis C, Cirrhosis and HCC Groups. Central line indicates median vlaue
DNA Methyltransferases as diagnostic markers for discrimination HCC among cirrhotic patients
We used the Receiver operating characteristics (ROC) curve analysis for distinguishing the best cutoff values of DNMT1, DNMT3A and DNMT3B mRNA relative levels for discriminating hepatocellular carcinoma among HCV cirrhotic patients. With a cutoff value of 3.16 for DNMT3A expression, sensitivity and specificity were 80.8 and 95.6% respectively and AUC was 0.958, p< 0.001. it is worth to be noted that DNMT3A cutoff value of 3.16 was the best diagnostic marker among other DNMTs. Besides DNMT3B relative expression cutoff value of 3.10 showed 84.6% sensitivity and 77.8% specificity and AUC was 0.888, p< 0.001. On the other hand, cutoff value 0.65 for DNMT1 relative expression showed 92.3% sensitivity and 44.4% specificity and area under the curve (AUC) was 0.72, p= 0.002 as shown in Table 3 and Figure 2.
Table 3.
Diagnostic Performance of DNA Methyl Transferases (DNMTs) for Discrimination between Cirrhosis and HCC Groups
| Test characteristics | HCC versus cirrhosis |
||
|---|---|---|---|
| DNMT1 | DNMT 3A | DNMT 3B | |
| Best cutoff value | 0.65 | 3.16 | 3.1 |
| AUC | 0.72 | 0.958 | 0.888 |
| p-value | 0.002 | <0.001 | <0.001 |
| Sensitivity % | 92.3 | 80.8 | 84.6 |
| Specificity % | 44.4 | 95.6 | 77.8 |
| PPV % | 49.0 | 91.3 | 68.8 |
| NPV % | 90.9 | 89.6 | 89.7 |
| Accuracy % | 68.4 | 88.2 | 81.2 |
PPV, Positive predictive value; NPV, Negative predictive value; Significance level was at level < 0.05.
Figure 2.

ROC Curves Analysis of DNMTs for Discrimination between Cirrhosis and HCC Groups
Correlation of relative levels of DNMTs with different clinical parameters in HCC patients
The expressions of DNMT1, DNMT3A and DNMT3B mRNA were significantly higher in HCC patients with multiple focal lesions than in those with single focal lesion (p-value = 0.045, 0.004 and 0.018 respectively) Table (4). However, no significant association was found with Child-Pugh score of HCC patients Table 5.
Table 4.
Relation between Foci Number and DNA Methyl Transferases (DNMTs) in HCC Group
| Parameters | Foci number subgroups |
p-value | |
|---|---|---|---|
| Single (n=14) |
Multiple (n=12) |
||
| DNMT1 | 0.045 b | ||
| Median (IQR) | 1.10 (0.96) | 1.85 (2.53) | |
| Range (Min-Max) | 0.29 - 1.90 | 0.77 - 5.89 | |
| DNMT3A | 0.004 b | ||
| Median (IQR) | 4.02 (5.68) | 18.22 (15.99) | |
| Range (Min-Max) | 1.59 - 30.53 | 3.36 - 42.20 | |
| DNMT3B | 0.018 b | ||
| Median (IQR) | 5.04 (11.64) | 26.53 (37.40) | |
| Range (Min-Max) | 1.40 - 39.95 | 2.00 - 63.50 | |
Significance level was at level < 0.05; IQR, Interquartile range (difference between 1st and 3rd quartiles); SD, standard deviation; b, Mann-Whitney test
Table 5.
Relation between Child-Pugh Score and DNA Methyl Transferases (DNMTs) in HCC Group
| Parameters | Child-Pugh score |
p-value | |
| Child B (n=16) |
Child C (n=10) |
||
| DNMT1 | 0.264 b | ||
| Median (IQR) | 1.08 (1.19) | 1.65 (0.88) | |
| Range (Min-Max) | 0.29 - 5.89 | 0.65 - 3.50 | |
| DNMT3A | 0.916 b | ||
| Median (IQR) | 8.81 (16.63) | 7.71 (17.62) | |
| Range (Min-Max) | 1.59 - 42.20 | 2.07 - 30.53 | |
| DNMT3B | 0.752 b | ||
| Median (IQR) | 14.81 (25.25) | 7.40 (30.26) | |
| Range (Min-Max) | 1.40 - 63.50 | 2.40 - 49.60 | |
Significance level was < 0.05; IQR, Interquartile range (difference between 1st and 3rd quartiles); b, Mann-Whitney test
Table 6 showed that there were significant positive correlations between the different DNMT mRNA levels (DNMT 1 vs. DNMT 3B also between DNMT 3A vs. DNMT 1 and DNMT 3B) in HCC patients. Also, DNMT1, DNMT3A and DNMT3B have significant positive correlation with the level of AFP (p-value = 0.003, 0.004 and 0.008 respectively). The relative expression of DNMT 3B was significantly correlated to focal lesion size (p-value = 0.015). On the other hand, no significant association was found between the DNMTs expression ALT and AST levels of HCC patients.
Table 6.
Correlation between DNA Methyl Transferases (DNMTs) and Various Parameters in HCC Patients
| Groups | Parameters | DNMT1 |
DNMT3a |
DNMT3b |
|||
|---|---|---|---|---|---|---|---|
| r s | p-value | r s | p-value | r s | p-value | ||
| HCC | DNMT1 | - | - | 0.6 | 0.001 | 0.41 | 0.039 |
| DNMT3A | 0.6 | 0.001 | - | - | 0.75 | <0.001 | |
| DNMT3B | 0.41 | 0.039 | 0.75 | <0.001 | - | - | |
| ALT (U/L) | -0.11 | 0.602 | -0.15 | 0.455 | -0.23 | 0.258 | |
| AST (U/L) | 0 | 0.992 | -0.03 | 0.872 | -0.12 | 0.559 | |
| AFP (ng/mL) | 0.56 | 0.003 | 0.55 | 0.004 | 0.51 | 0.008 | |
| Foci size (cm) | -0.01 | 0.949 | 0.11 | 0.598 | 0.47 | 0.015 | |
r s , Spearman correlation coefficient; Significance was set at level < 0.05
Figure 1B.

DNMT 3A Distribution in Control, Chronic Hepatitis C, Cirrhosis and HCC Groups. Central line indicates median vlaue
Figure 1C.

DNMT 3B Distribution in Control, Chronic Hepatitis C, Cirrhosis and HCC Groups. Central line indicates median vlaue
Discussion
The majority of patients with chronic HCV infection may develop fibrosis, cirrhosis and hepatocellular carcinoma which considered the third common cause of mortality related to cancer (Garawani et al., 2020). HCC is usually diagnosed at late stages and has poor prognosis (Dimitroulis et al., 2017). Hence, there is urgent need for recognizing reliable non- invasive biomarkers to better identify patients at high risk of HCC progression (Doycheva and Thuluvath, 2019), in addition, studying new systemic therapies that target different signaling mechanisms (Jindal et al., 2019).
Therefore, in the current study, we aimed to evaluate the expression of DNMT 1, DNMTs 3A and 3B enzymes, which may have role in methylation process, a major epigenetic procedure, as diagnostic marker for discrimination of HCC among chronic hepatitis C infected patients. To our knowledge, this is the first study evaluating expression of the three enzymes as non- invasive biomarkers for characterizing HCC.
We found that the expression levels of the three studied DNMTs (DNMT1, DNMT 3A and DNMT 3B) were significantly increased in HCC patients compared to control group and chronic HCV. These results were in good agreement with the previous studies conducted by (Nagai et al., 2003; Arora et al., 2008) who reported increased expression of DNA methyltransferase enzymes in liver tissues of HCC patients. Oh et al in 2007 further reported that increased expression of DNMT 3A and DNMT 3B correlated with shorter metastasis-free survival and poorer overall survival in HCC patients.
In the present study, chronic HCV patients and cirrhotic patients showed significantly higher levels of expressed DNMT 1, DNMT 3A and DNMT 3B compared to control group, indicating that DNA methylation is an early epigenetic effect that may have role as driving carcinogenic effect.
Benegiamo et al., (2012) and Charostad et al., (2019) stated that HCV core protein can induce upregulation of DNMTs in transcriptional and translational levels. In addition, Benegiamo et al., (2012) demonstrated that STAT3 pathway is involved in that provocation, however, they stated that this effect might be genotype related. Albrengues et al., (2015) revealed that activation of carcinoma associated fibroblasts is mediated by JAK1/STAT3 pathway through DNMT. This signifies the possible additional therapeutic effect of targeting DNMT and STAT3 pathways.
Also, Siddiqui et al., (2016) reported increased expression of DNMTs in cancerous tissue contrasted with normal fibrotic tissue. Yet, the expression of DNMTs differs with different HCV genotypes and subtypes suggesting the different roles played by HCV virus. This shows that further studies on DNMTs expression and DNMT inhibitor should be related to different HCV subtypes.
It is worth to be noted that, on the other hand, Chen et al., (2013) demonstrated the role of DNMT 1 and DNMT 3B expression in the infectivity of HCV virus. DNMT inhibitors could significantly suppress HCV infection, viral RNA replication and protein expression, which illustrates that DNMTs inhibitors might be potential targets for the HCV infection therapy.
Using ROC curves analysis, DNMTs were demonstrated to be non- invasive diagnostic marker discriminating between HCC and cirrhotic patients at cutoff values of 0.65, 3.16 and 3.10 for DNMT1, DNMT 3A and DNMT 3B enzymes respectively, with accuracy 68.4, 88.2 and 81.2 respectively. DNMT 3A was the best diagnostic marker among other DNMTs.
Also, El- Araby et al., (2020) verified the non- invasive diagnostic ability of DNMT1. The results of our study together with data from El- Araby et al., (2020) signified the value of DNMTs as potential biomarkers for discrimination between HCC and cirrhosis. Further evaluation on a large group of patients could pave the way for clinical application.
In the current study, we detected significant association between the mRNA levels of DNMT1, DNMT 3A and DNMT 3B and the presence of multiple focal lesions of HCC. Also, expression of DNMT 3B was significantly associated with large focal lesion. This shows that DNMTs levels could be used as additional marker in staging of HCC.
Moreover, we found that there were significant positive correlations between the DNMT mRNA levels (DNMT1 versus DNMT 3B also between DNMT 3A versus DNMT1 and DNMT 3B) in HCC patients. Also, Girault et al., (2003) noted that DNMT1, DNMT 3A, and DNMT 3B mRNA levels correlated positively with each other, suggesting a common regulatory pathway may exist for these three enzymes.
A significant correlation was found between the level of AFP and the mRNA level of DNMT1, DNMT 3A and DNMT 3B. This was similar to previous study done by Oh et al., (2007). In addition, Parpart et al., (2014) revealed that AFP was associated with increased expression of DNA methyltransferases, furthermore, increased methylation of many gene promoters. They noted that AFP transcriptionally inhibits miR-29a expression, which causes induction of DNMT 3A, suggesting that AFP drives epigenetic changes to promote tumorigenesis.
On the other hand, we could not detect significant association between the DNMTs expression and child-Pugh score, ALT or AST levels of HCC patients.
In conclusion, the mRNA levels of DNMTs could be a potential biomarker for early detection of HCC development. Aberrant DNMTs expression is suggested to have a major role in hepatocarcinogenesis in patients with chronic HCV infection. This justifies the promising role of DNA methyltransferase inhibitors in treatment of HCC patients. Ethics approval and consent to participate.
All subjects involved in this study agree for publication of data.
Acknowledgements
All authors are greatly indebted to members of all departments of National Liver Institute, Menoufia University, Egypt.
Availability of data and material
Data used to support the findings of this study are included within the article.
Funding
This research and the publication were completely funded by Research Unit of Menoufia University, Egypt.
Disclosure statement
Conflict of interest: No potential conflict of interest was reported by the authors.
References
- Abudeif A. Epidemiology and risk factors of Hepatocellular Carcinoma in Egypt. Sohag Med J. 2019;23:8–12. [Google Scholar]
- Albrengues J, Bertero T, Grasset E, et al. Epigenetic switch drives the conversion of fibroblasts into proinvasive cancer-associated fibroblasts. Nat Commun. 2015;6:10204. doi: 10.1038/ncomms10204. [DOI] [PMC free article] [PubMed] [Google Scholar]
- Arora P, Kim E, Jung J, Jang K. Hepatitis C virus core protein downregulates E-cadherin expression via activation of DNA methyltransferase 1 and 3b. Cancer Lett. 2008;261:244–52. doi: 10.1016/j.canlet.2007.11.033. [DOI] [PubMed] [Google Scholar]
- Benegiamo G, Vinciguerra M, Mazzoccoli G, et al. DNA methyltransferases 1 and 3b expression in Huh-7 cells expressing HCV core protein of different genotypes. Dig Dis Sci. 2012;57:1598–1603. doi: 10.1007/s10620-012-2160-1. [DOI] [PubMed] [Google Scholar]
- Charostad J, Astani A, Goudarzi H, Faghihloo E. DNA methyltransferases in virus-associated cancers. Rev Med Virol. 2019;29:e2022. doi: 10.1002/rmv.2022. [DOI] [PubMed] [Google Scholar]
- Chen C, Pan D, Deng A, et al. DNA methyltransferases 1 and 3B are required for hepatitis C virus infection in cell culture. Virology. 2013;441:57–65. doi: 10.1016/j.virol.2013.03.005. [DOI] [PubMed] [Google Scholar]
- De Stefano F, Chacon E, Turcios L, Marti F, Gedaly R. Novel biomarkers in hepatocellular carcinoma. Dig Liver Dis. 2018;50:1115–23. doi: 10.1016/j.dld.2018.08.019. [DOI] [PubMed] [Google Scholar]
- Dimitroulis D, Damaskos C, Valsami S, et al. From diagnosis to treatment of hepatocellular carcinoma: An epidemic problem for both developed and developing world. World J Gastroenterol. 2017;23:5282–94. doi: 10.3748/wjg.v23.i29.5282. [DOI] [PMC free article] [PubMed] [Google Scholar]
- Doycheva I, Thuluvath PJ. Systemic therapy for advanced hepatocellular carcinoma: An update of a rapidly evolving field. J Clin Exp Hepatol. 2019;9:588–96. doi: 10.1016/j.jceh.2019.07.012. [DOI] [PMC free article] [PubMed] [Google Scholar]
- EASL Clinical Practice Guidelines. Management of hepatocellular carcinoma. J Hepatol. 2018;69:182–236. doi: 10.1016/j.jhep.2018.03.019. [DOI] [PubMed] [Google Scholar]
- El-Araby RE, Khalifa MA, Zoheiry MM, et al. The interaction between microRNA-152 and DNA methyltransferase-1 as an epigenetic prognostic biomarker in HCV-induced liver cirrhosis and HCC patients. Cancer Gene Ther. 2020;27:486–97. doi: 10.1038/s41417-019-0123-9. [DOI] [PubMed] [Google Scholar]
- Forner A, Reig M, Bruix J. Hepatocellular carcinoma. Lancet. 2018;391:1301–14. doi: 10.1016/S0140-6736(18)30010-2. [DOI] [PubMed] [Google Scholar]
- Garawani I, El-Nabi SH, Gadallah M, Abdelsameea E. Association between IFN-λ 3 gene polymorphisms and outcome of treatment with direct acting antivirals in chronic HCV-infected Egyptian patients. Immunol Invest. 2020;5:1–11. doi: 10.1080/08820139.2020.1722158. [DOI] [PubMed] [Google Scholar]
- Girault I, Tozlu S, Lidereau R, Bièche I. Expression analysis of DNA methyltransferases 1, 3A, and 3B in sporadic breast carcinomas. Clin Cancer Res. 2003;9:4415–22. [PubMed] [Google Scholar]
- Jindal A, Thadi A, Shailubhai K. Hepatocellular carcinoma: etiology and current and future drugs. J Clin Exp Hepatol. 2019;9:221–32. doi: 10.1016/j.jceh.2019.01.004. [DOI] [PMC free article] [PubMed] [Google Scholar]
- Meng H, Cao Y, Qin J, et al. DNA methylation, its mediators and genome integrity. Int J Biol Sci. 2015;11:604–17. doi: 10.7150/ijbs.11218. [DOI] [PMC free article] [PubMed] [Google Scholar]
- Nagai M, Nakamura A, Makino R, Mitamura K. Expression of DNA (5-cytosin)- methyltransferases (DNMTs) in hepatocellular carcinomas. Hepatol Res. 2003;26:186–91. doi: 10.1016/s1386-6346(03)00091-3. [DOI] [PubMed] [Google Scholar]
- Naguib M, Helwa MM, Soliman MM, et al. XRCC1 gene polymorphism increases the risk of hepatocellular carcinoma in Egyptian population. Asian Pac J Cancer Prev. 2020;21:1031–37. doi: 10.31557/APJCP.2020.21.4.1031. [DOI] [PMC free article] [PubMed] [Google Scholar]
- Oh BK, Kim H, Park HJ, et al. DNA methyltransferase expression and DNA methylation in human hepatocellular carcinoma and their clinicopathological correlation. Int J Mol Med. 2007;20:65–73. [PubMed] [Google Scholar]
- Park HJ, Yu E, Shim YH. DNA methyltransferase expression and DNA hypermethylation in human hepatocellular carcinoma. Cancer Lett. 2006;233:271–78. doi: 10.1016/j.canlet.2005.03.017. [DOI] [PubMed] [Google Scholar]
- Parpart S, Roessler S, Dong F, et al. Modulation of miR-29 expression by α-fetoprotein is linked to the hepatocellular carcinoma epigenome. Hepatology. 2014;60:872–83. doi: 10.1002/hep.27200. [DOI] [PMC free article] [PubMed] [Google Scholar]
- Pogribny IP, Rusyn I. Role of epigenetic aberrations in the development and progression of human hepatocellular carcinoma. Cancer Lett. 2014;34:223–30. doi: 10.1016/j.canlet.2012.01.038. [DOI] [PMC free article] [PubMed] [Google Scholar]
- Pugh RN, Murray-Lyon IM, Dawson JL, et al. Transection of the oesophagus for bleeding oesoph- ageal varices. Br J Surg. 1973;60:646–49. doi: 10.1002/bjs.1800600817. [DOI] [PubMed] [Google Scholar]
- Schanzer DL, Paquette D, Lix LM. Historical trends and projected hospital admissions for chronic hepatitis C infection in Canada: a birth cohort analysis. CMAJ Open. 2014;2:139–44. doi: 10.9778/cmajo.20130087. [DOI] [PMC free article] [PubMed] [Google Scholar]
- Siddiqui NN, Haq AU, Siddiqui OA, Khan R. DNA methyltransferase 1, 3a, and 3b expression in hepatitis C associated human hepatocellular carcinoma and their clinicopathological association. Tumour Biol. 2016;37:10487–97. doi: 10.1007/s13277-016-4941-1. [DOI] [PubMed] [Google Scholar]
- Tao J, Yang M, Chen Z, et al. Decreased DNA methyltransferase 3A and 3B mRNA expression in peripheral blood mononuclear cells and increased plasma SAH concentration in adult patients with idiopathic thrombocytopenic purpura. J Clin Immunol. 2008;28:432–39. doi: 10.1007/s10875-008-9223-2. [DOI] [PubMed] [Google Scholar]
- Wahid B, Ali A, Rafique S, Idrees M. New insights into the epigenetics of hepatocellular carcinoma. Biomed Res Int. 2017;2017:1609575. doi: 10.1155/2017/1609575. [DOI] [PMC free article] [PubMed] [Google Scholar]
- Zhang MW, Fujiwara K, Che X, Zheng S, Zheng L. DNA methylation in the tumor microenvironment. J Zhejiang Univ Sci B. 2017;18:365–72. doi: 10.1631/jzus.B1600579. [DOI] [PMC free article] [PubMed] [Google Scholar]
Associated Data
This section collects any data citations, data availability statements, or supplementary materials included in this article.
Data Availability Statement
Data used to support the findings of this study are included within the article.