

Abstract
Aim:
Agreement in DNA methylation (DNAm) at the genome scale between blood leukocytes (BL) and bronchial epithelial cells (BEC) is unknown. We examine as to what extent DNAm in BL is comparable with that in BEC and serves as a surrogate for BEC.
Materials & methods:
Overall agreement (paired t-tests with false discovery rate adjusted p > 0.05) and consistency (Pearson’s correlation coefficients >0.5) between two tissues, at each of the 767,412 CpGs, were evaluated.
Results:
We identified 247,721 CpGs showing overall agreement and 47,371 CpGs showing consistency in DNAm. Identified CpGs are involved in certain immune pathways, indicating the potential of using blood as a biomarker for BEC at those CpGs in lower airway-related diseases.
Conclusion:
CpGs showing overall agreement and those without overall agreement are distributed differently on the genome.
Keywords: : blood leukocytes, bronchial epithelial cells, DNA methylation, Isle of Wight
Epigenetic modifications to DNA potentially mediate the effect of environment exposures on the risk of various health conditions. One of the most commonly studied epigenetic mechanisms is DNA methylation (DNAm), which refers to an addition of a methyl (CH3) group to DNA. This occurs primarily at the cytosine of cytosine-guanine dinucleotide (CpG) sites in mammalian cells [1].
DNAm in the lower airway tissues, such as bronchial epithelial cells (BEC), is regarded as an informative source to study the underlying epigenetic mechanisms of asthma and other respiratory diseases [2,3], such as chronic obstructive pulmonary disease. However, sampling of bronchial epithelium is relatively invasive compared with sampling of blood and generally not feasible in population-based studies [3]. As a result, a much larger number of studies have focused on associations for DNAm in blood leukocytes (BL) rather than in lower airway tissues when investigating respiratory diseases such as chronic obstructive pulmonary disease and asthma [4–11]. A recent systematic review of epigenome wide association studies demonstrated significant associations between asthma and DNAm at CpGs from cells in different tissues (blood cells, nasal epithelial cells and airway epithelial cells) [8]. Another epigenome wide association studies meta-analysis of DNAm and childhood asthma from eight cohorts conducted by the Pregnancy And Childhood Epigenetics consortium showed that DNAm in blood and nasal respiratory epithelium was associated with childhood asthma and the associations are in the same direction between the two tissues [12].
It has been suggested that epigenetic modifications, including DNAm, are largely tissue and cell type specific and several studies have compared such specificity between BEC and BL [3,9,13–17]. One study investigated a preselected set of CpGs (1027 CpGs) in peripheral blood mononuclear cells and in airway epithelial cells from 25 individuals, and 57 of the 1027 CpGs were differently methylated irrespective of asthma status [16]. Brugha et al. compared DNAm in BEC, BL and nasal epithelial cells and suggested lower agreement between BEC and BL [3]. However, the findings were based on six children aged 5–13 years. Some other studies, on the other hand, showed certain concordance between DNAm in blood and DNAm in cells from respiratory epithelium [18]. Nevertheless, no studies have assessed the level of tissue specificity in young adulthood at the genome scale, in other words, as to what extent DNAm in blood is comparable with that in bronchial epithelium cells irrespective to other health conditions or exposures, and no studies discussed the distributions of these comparable CpG sites as well as incomparable sites regarding their location on genes and their position with respect to CpG islands. This type of assessment has the potential to offer an overall picture of DNAm profile in BL compared with that in BEC. In the present study, we tackled this problem using epigenome-scale DNAm data of young adults aged 20–21 years from a birth cohort located on the Isle of Wight (IOW), UK.
Materials & methods
Study population
This study was based on data of a birth cohort from the IOW in the UK. The IOW Birth Cohort (IOWBC) was designed to study the natural history of asthma and allergies, and to identify potential environment and genetic risk factors. This cohort contains 1536 children born on IOW between 1 January 1989 and 28 February 1990, and the majority of the cohort participants are Caucasians (>98%). The study was approved by the IOW Local Research Ethics Committee at recruitment initial assessments and further assessments were approved by the National Research Ethics Service (06/Q1701/34). Informed consents were obtained from the newborn’s parents at birth and later from the participants. Details of the IOWBC have been described elsewhere [19,20]. Due to still birth, adoption and refusals for further follow-up, informed consent was obtained from 1456 out of 1536 (∼95%) newborns. These 1456 (n = 721 males; 49.5%) were followed-up at different ages.
BL & BEC collection & DNAm assessment
Forty-five subjects (equal numbers of persistent, remission and no asthma) had a fiberoptic bronchoscopy at ages 21–22 performed under sedation and local anesthesia, according to a standard protocol [21] and approved by the local research ethics committee. Bronchial brush biopsies were taken with a sterile single-sheathed nylon cytology brush from an approximately 3–4 cm2 intrabronchial area from the proximal part of the right or left main bronchus. Blood samples of these 45 subjects were also collected when BEC was sampled. Cells were stored in RNA later at -80˚C. DNA and RNA were isolated from BEC using an AllPrep DNA/RNA Mini kit (Qiagen, CA, USA) and quality was assessed using an Agilent bioanalyser. Of the 45 subjects, six males and eight females (total n = 14) had enough DNA samples collected from both BL and BEC for subsequent DNAm analyses.
Details of DNAm assessment and preprocessing were in Supplementary Material 1. To assist with the comparison in DNAm at CpGs between the two tissues, CpGs were categorized into three levels based on DNAm (in β-values) at each CpG. Following the literature, a CpG was classified as a hypomethylated site (including unmethylated sites as well as CpGs with rather low methylation) if a β-value was between 0 and ≤0.2, a heterogeneously methylated site if β >0.2 and <0.8 (exclusive) or a hypermethylated site if β ≥0.8 [22–25].
After preprocessing, a total of 774,463 CpGs were included in the analyses. CpGs from both tissues with greater than 4 missing values were excluded from analyses to ensure at least 10 pairs of DNAm data were available at each CpG. As a result, 7051 (0.9%) of the 774,463 CpGs were excluded, in other words, a total of 767,412 CpGs were included in subsequent analyses.
Statistical methods
To examine the comparability between BL and BEC in DNAm at the genome scale, at each CpG site, we used two methods. In the first method, paired t-tests were applied to each CpG site to compare DNAm in BL with that in BEC. Such comparisons were on the mean differences in DNAm between BL and BEC, which potentially provided an overall agreement between the two tissues in DNAm. Since β-values have severe heteroscedasticity in low (0–0.2) and high (0.8–1) methylation ranges, which potentially violates normality assumption required in t-tests, as suggested in the literature [26], M values, calculated as logit transformed β values, were used to assess the overall agreement. In the second approach, we utilized Pearson’s correlation coefficients calculated based on β-values at each CpG to examine linear correlations between the two tissues. This type of assessment of comparability is at the individual level and we denote it as an assessment of consistency. As in Jiang et al. [27], a CpG with correlation higher than 0.5 was regarded as a consistent CpG between the two tissues.
CpGs occur with high frequency in CpG islands (a dense region of CpG site) [28]. In human genes, about 40–70% of promoter regions contain a CpG island [28–30]. CpGs with DNAm in promoter regions reflect potential biological implications on the gene activity. For the identified CpGs showing overall agreement or consistency, we thus examined their locations with respect to important genomic regions such as CpG islands and adjacent regions and locations on genes. The chromosomal locations of CpGs were extracted from the Illumina Infinium MethylationEPIC v1.0 B4 Manifest File (https://support.illumina.com/downloads/infinium-methylationepic-v1-0-product-files.html). In terms of genomic position relative to the coverage of CpG island and adjacent regions, the location of a CpG is either on: a CpG island; a shore 2 k base pairs (bps) up- and down-stream of the island; or a shelf located 2 k bps outside of the shores [30,31]. We further refer to CpGs that are not in any of the categories listed above as ‘open sea’ [32]. The proportion of agreed or consistent CpGs located to a specific genomic region (island, shore, shelf or open sea) was calculated as the number of identified CpGs showing overall agreement or consistency in a region (island, shore, shelf or open sea) divided by the number of total CpGs in that specific region included on the array.
For the location of a CpG on a gene, seven locations were defined [27]: TSS1500 (between 200 and 1500 bps upstream of transcription start site; TSS); TSS200 (200 bps upstream of TSS); 5′ UTR; first exon; body; exon boundaries; and 3′ UTR. CpGs not in any of these defined gene regions were considered as ‘intergenic’. The proportion of agreed or consistent CpGs located to a specific location on a gene was calculated as the number of identified CpGs showing overall agreement or consistency at each of the seven locations divided by the number of total CpGs in that location.
In all statistical analyses, a false discovery rate (FDR) of 0.05 was applied to adjust for the inflation of significance levels due to multiple testing. Analyses were performed in R package version 3.6.2 or SAS package version 9.4.
Pathway analysis
The identified CpGs showing overall agreement or consistency were mapped to genes, and these mapped genes were further assessed for their enrichment in pathways. The gometh function in the R package missmethyl was used for the enrichment analyses [33]. Multiple testing was adjusted by controlling an FDR of 0.05.
Results
Majority of the 14 subjects were nonsmokers, not exposed to maternal smoking during pregnancy, and without family history of asthma, and no statistically significant differences were shown between male and females on these variables (Table 1).
Table 1. . Demographic and disease status of subjects.
| Male | Female | p-value | |
|---|---|---|---|
| n (%) | 6 (42.9%) | 8 (57.1%) | 0.62 |
| Mean of BMI (SD) | 28.0 (5.8) | 24.7 (4.5) | 0.27 |
| Smoking status | 0.58 | ||
| Current | 1 (16.7%) | 2 (25.0%) | |
| Ever | 0 (0.0%) | 2 (25.0%) | |
| Never | 5 (83.3%) | 4 (50.0%) | |
| Exposed to maternal smoking; n (%) | 0.47 | ||
| Yes | 0 (0.0%) | 2 (25.0%) | |
| No | 6 (100%) | 6 (75.0%) | |
| Diagnosed with asthma; n (%) | 1.00 | ||
| Yes | 2 (33.3%) | 3 (37.5%) | |
| No | 4 (66.7%) | 5 (62.5%) | |
| Mother had asthma; n (%) | |||
| Yes | 0 (0.0%) | 0 (0.0%) | N/A |
| No | 6 (100%) | 8 (100%) | |
| Father had asthma; n (%) | 1.00 | ||
| Yes | 0 (0.0%) | 1 (12.5%) | |
| No | 6 (100%) | 7 (87.5%) |
SD: Standard deviation.
Overall agreement & consistency in DNAm between the two tissues
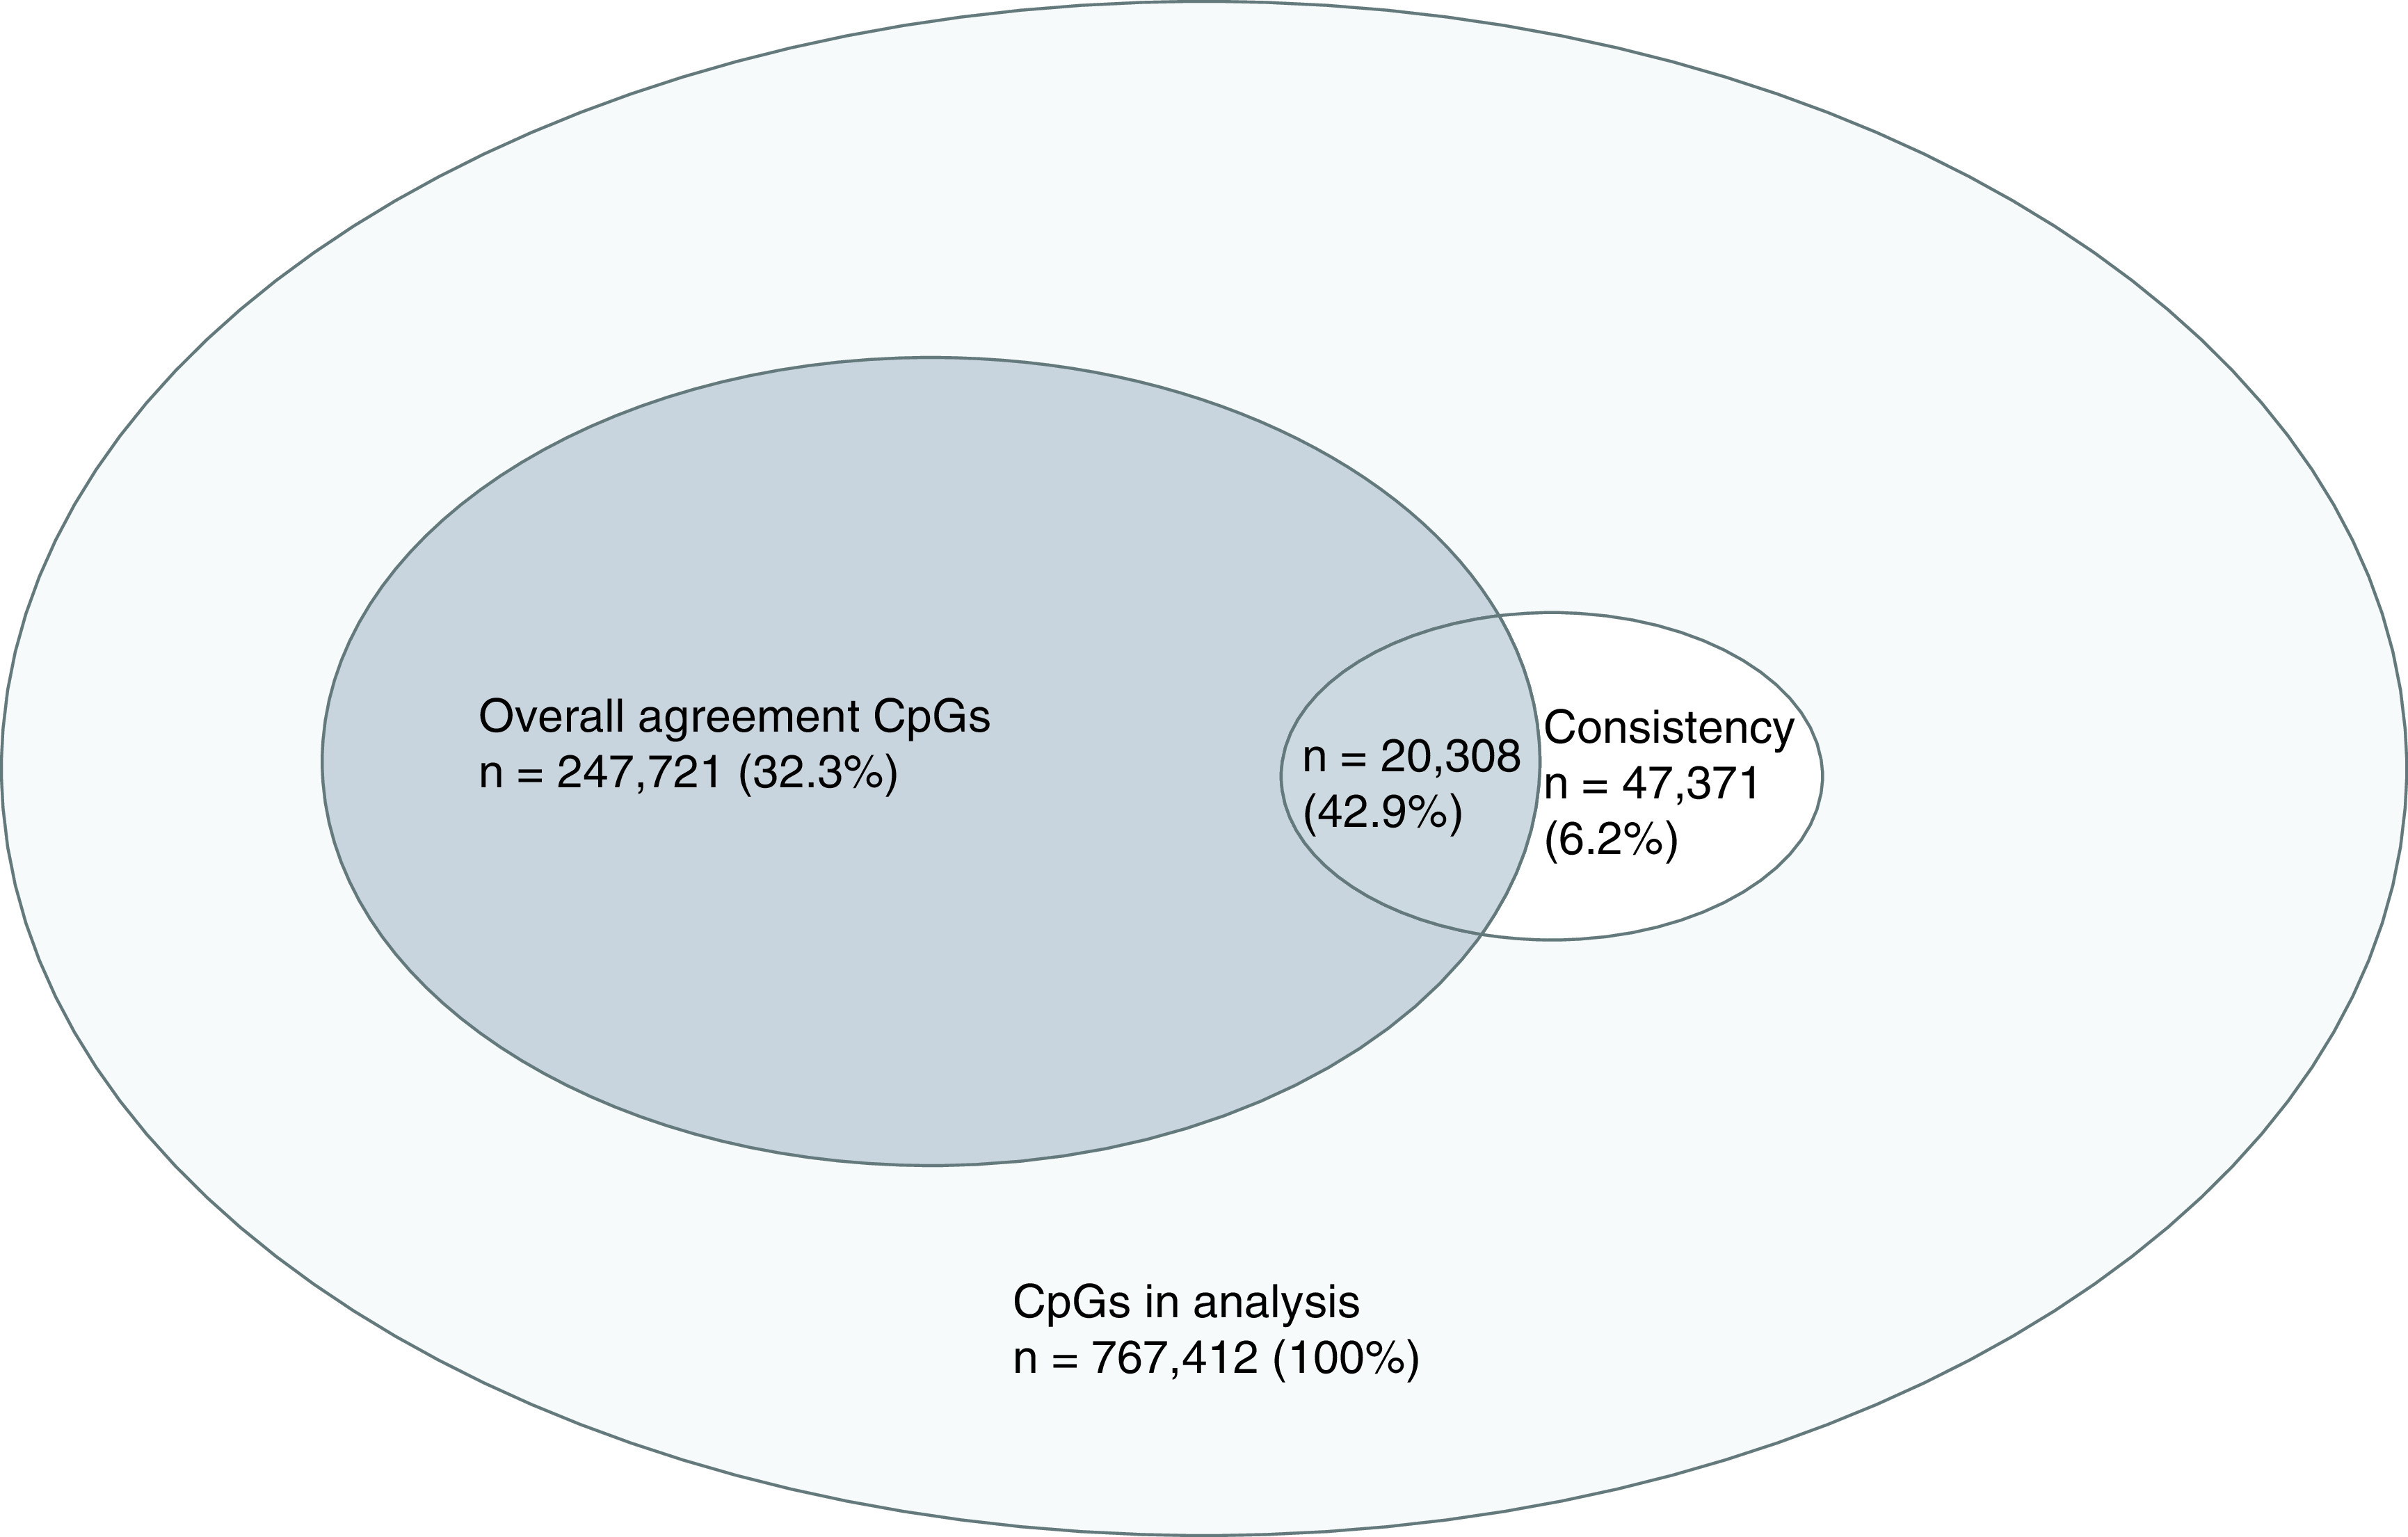
For the assessment on overall agreement in DNAm, after adjusting for multiple testing by controlling for FDR at 0.05, at 247,721 CpGs (32.3% of the 767,412 CpGs), DNAm did not show a statistically significant difference between BL and BEC, and these CpGs were treated as CpGs showing overall agreement in DNAm between the two tissues. With regards to Pearson’s correlation analysis for the consistency in DNAm, we identified 47,371 CpGs (6.2% of the 767,412 CpGs) with correlation coefficients >0.5. Following our definition, these were regarded as CpGs showing consistency in DNAm between the two tissues, and 42.9% of these 47,371 CpGs were also among the identified CpGs showing overall agreement (Figure 1).
Figure 1. . Overall agreement (dark gray) and consistency (white) CpGs.
Genomic locations of the identified CpGs
For the identified CpGs showing overall agreement or consistency in DNAm, we examined their genomic position relative to CpG island and adjacent regions (island, shore, shelf and open sea) as well as their location on genes (TSS1500, TSS200, 5′ UTR, first exon, gene body, exon boundaries, 3′ UTR and intergenic). Among all CpGs located in different regions relative to CpG island and adjacent regions, the highest percentage of identified CpGs shown to have overall agreement or to be consistent was found in CpG islands (Figure 2A & B). Specifically, of the 143,982 total CpGs in CpG island, 59.3% (85,324 CpGs) showed overall agreement between BL and BEC (Figure 2A), and 8.7% (12,521 CpGs) showed consistency (Figure 2B). Consequently, the patterns revealed by Figure 2A and B indicated that for CpGs not showing overall agreement or consistency, the highest percentages of such CpGs were found in ‘open sea’; in this location, DNAm at 76.6% of the CpGs did not indicate overall agreement and 94.8% showed no consistency between BL and BEC.
Figure 2. . Genomic locations relative to CpG island and adjacent regions of the identified CpGs.

(A) Allocation of CpGs showing overall agreement in DNA methylation (based on paired t-test) to CpG island and adjacent regions. Each percentage was calculated as the number of identified CpGs showing overall agreement between BL and BEC in a region divided by the number of total CpGs found in that specific region in the human genome. (B) Allocation of CpGs showing consistency of Pearson’s correlation >0.5 to CpG island and adjacent regions. Each percentage was calculated as the number of identified CpGs showing consistency between BL and BEC in a region divided by the number of total CpGs in that specific region in the human genome.
BEC: Bronchial epithelial cell; BL: Blood leukocyte.
Turning to the location of identified CpGs on different regions of genes, the highest percentage of identified CpGs shown to have overall agreement or be consistent between BL and BEC was in the TSS200 region (Figure 3A & B), and second highest percentage was the first exon region. Of the 70,873 total CpGs located in the TSS200 regions of a gene, 58.4% (41,372 CpGs) showed overall agreement in DNAm, and 7.7% (5,441 CpGs) showed consistency in DNAm between the two tissues. On the other hand, at CpGs not showing overall agreement CpGs, the highest percentage (75.5%) of such CpGs was in the ‘intergenic regions’, and for inconsistent CpGs, the highest percentage (94.9%) was in the ‘exon boundaries’.
Figure 3. . Genomic locations relative to genes of the identified CpGs.

(A) Allocation of CpGs showing overall agreement in DNA methylation (based on paired t-tests) to their locations relative to genes. Each percentage was calculated as the number of identified CpGs showing overall agreement between BL and BEC in a location divided by the number of total CpGs in that specific location in the human genome. (B) Allocation of CpGs showing consistency of Pearson’s correlation >0.5 to their locations relative to genes. Each percentage was calculated as the number of identified CpGs showing consistency between BL and BEC in a location divided by the number of total CpGs in that specific location in the human genome.
BEC: Bronchial epithelial cell; BL: Blood leukocyte.
Locations relative to genes of the identified CpGs classified by their CpG island & adjacent regions
We were interested in finding out whether the identified CpGs shown overall agreement or consistency localized to CpG islands were also co-located to the promoter regions (TSS200 and TSS1500). To answer this, we further examined those identified CpGs by combining the findings with respect to CpG islands and the findings related to location in genes. For the identified CpGs located in CpG islands and showing overall agreement in DNAm, the highest percentage (25.1%) of the identified CpGs were located in the region TSS200 (Figure 4A). Farther from the CpG island, the percentages of identified CpGs in TSS200 decreased; less than 4% of such identified CpGs in CpG shelf and in open sea were in the TSS200 region (2.3 and 3.5%, respectively). The pattern in DNAm consistency between the two tissues was slightly different from that in overall agreement (Figure 4B). For the identified CpGs located in CpG island and showing consistency, the highest percentage of those CpGs were in the body of genes (21.04%), slightly higher than the percentage of CpGs in the TSS200 region (20.99%). Farther from the CpG island, the percentages of identified CpGs in TSS200 decreased as well (Figure 4B), as seen in the results for overall agreement.
Figure 4. . Locations relative to genes of the identified CpGs classified by CpG island and adjacent regions.

(A) Distribution of CpGs showing overall agreement in DNAm (based on paired t-tests) between BL and BEC with regard to their locations relative to genes, categorized by their CpG island and adjacent regions. The numbers on top of the bars are the number of identified CpGs showing overall agreement in island, shore, shelf or open sea. The sum of these numbers is greater than the number of agreed CpGs (247,721) due to multiple gene features associated with some CpGs. The percentage values for exon boundaries were marked outside the bars. TSS and UTR. (B) Distribution of CpGs showing consistency of Pearson’s correlation >0.5 between BL and BEC with regard to their locations relative to genes, categorized by their CpG island and adjacent regions. The numbers on top of the bars are the number of identified CpGs showing consistency in island, shore, shelf or open sea. The sum of these numbers is greater than the number of consistent CpGs (47,371) due to multiple gene features associated with some CpGs. The percentage values for exon boundaries were marked outside the bars. TSS and UTR.
BEC: Bronchial epithelial cell; BL: Blood leukocyte; DNAm: DNA methylation; TSS: Transcriptional start site.
Our additional assessment indicated that, among identified CpGs (overall agreement or consistency) located in the promoter regions (TSS1500 and TSS200), about 44–56% were in CpG islands (Supplementary Figures 1A & 2A), but for CpGs not comparable (overall disagreed or inconsistent), the percentages are 23–38% (Supplementary Figures 1B & 2B).
To have a complete picture of the comparison, for CpGs not comparable (overall disagreed or inconsistent) between BL and BEC, we included their distribution patterns with respect to CpG islands and gene regions in Supplementary Figures 3 & 4. The distribution of the overall disagreed CpGs was different from that of CpGs showing an overall agreement. In particular, on CpG islands, the highest percentage of those overall disagreed CpGs was located in the body of genes rather than promoter regions. Farther from the CpG island, the percentages of disagreed CpGs located in body region increased. The pattern of inconsistent CpGs was in general comparable with the pattern of CpGs not showing overall agreement (Supplementary Figure 3).
Allocation of hypo-, hetero- & hyper-methylated identified CpGs in locations relative to genes
Figure 5A shows the percentages of identified CpGs with overall agreement in DNAm, based on paired t-tests, with respect to their methylation levels on different locations relative to genes. In TSS1500, TSS200, 5′ UTR and first exon regions, most identified CpGs were hypomethylated (∼69–∼92%). For instance, in TSS200, of the 41,372 overall agreed CpGs, 91.6% (37,916) of them were classified as being hypomethylated, 2113 (5.1%) CpGs were heterogeneously methylated or hetero-methylated and only 3.2% (1,343 CpGs) were hypermethylated. For other locations, they were dominated by hypermethylated CpGs (Figure 5A).
Figure 5. . Allocation of hypo-, hetero- & hyper-methylated identified CpGs in locations relative to genes.

(A) DNA methylation profiles of CpGs showing overall agreement in DNA methylation (based on paired t-tests) between BL and BEC by their locations relative to genes. CpGs were grouped into three levels of DNA methylation based on β value: hypomethylated (β value of 0–≤0.2), heterogeneously methylated (β value of >0.2–<0.8) and hypermethylated (β value of ≥0.8–1). The numbers on top of the bars are the number of identified CpGs showing agreement between the two tissues and are located in the gene features listed on the X-axis. The sum of these numbers is greater than the number of agreed CpGs (247,721) due to multiple gene features associated with some CpGs. (B) DNA methylation profiles of CpG sites showing consistency of Pearson’s correlation >0.5 between BL and BEC by their locations relative to genes. CpG sites were grouped into three levels of DNAm based on β value from BL: hypomethylated (β value of 0–≤0.2), heterogeneously methylated (β value of >0.2–<0.8) and hypermethylated (β value of ≥0.8–1). The numbers on top of the bars are the number of identified CpGs showing consistency between the two tissues and are located in the gene features listed on the X-axis. The sum of these numbers is greater than the number of consistent CpGs (47,371) due to multiple gene features associated with some CpGs. The distribution patterns for BEC were similar to BL (See Supplementary Figure 5).
BEC: Bronchial epithelial cell; BL: Blood leukocyte.
For identified CpGs showing consistency in DNAm between the two tissues, although the assessment of consistency focused on correlation in DNAm rather than average in DNAm at each CpG site, distribution patterns of DNAm levels at the identified CpGs were similar (Figure 5B for BL and Supplementary Figure 5 for BEC). However, dominance patterns of hypomethylated CpGs were different as seen for the identified CpGs showing overall agreement. A majority of the identified CpGs showing consistency located in two regions, TSS200 and first exon, were classified as hypomethylated (∼76–∼78%; Figure 5B). For example, in TSS200, of the 5441 consistent CpGs, 77.5% (4,215) of them were classified as being hypomethylated, 950 (17.5%) CpGs were heterogeneously methylated or hetero-methylated and only 5.1% (276 CpGs) were hypermethylated. In TSS1500 and 5′ UTR, about half of CpGs were hypomethylated (∼49–55%). For other regions, they were dominated by the hetero-methylated CpGs (Figure 5B).
As done for the allocations of overall agreed and individually consist CpGs, the distribution patterns of DNAm levels for CpGs not comparable between BL and BEC were shown in Supplementary Figures 6–9. For CpGs not showing overall agreement between BL and BEC, the percentages of hetero-methylated CpGs sites in all the seven regions were very different compared with those for CpGs showing overall agreement. In particular, for disagreed CpGs in the locations of body, exon boundaries, 3′ UTR and intergenic, greater than 50% of such CpGs were hetero-methylated, while for overall agreed CpGs, all percentages are <38%. In the regions of TSS1500 and 5′ UTR, >50% CpGs were hetero-methylated, while for overall agreed CpGs, such percentages in these two regions were <15%. Interestingly, for the CpGs inconsistent in DNAm between BL and BEC, the allocation percentages were comparable with the percentages for the consistent CpGs across all the seven regions.
Pathway analysis for identified CpGs showing overall agreement & consistency between BL & BEC
The 247,721 identified CpGs showing overall agreement and the 47,371 identified CpGs showing consistency were mapped to 23,284 and 15,637 genes, respectively, and pathway analyses were conducted on these two sets of genes separately. Using the gometh function in R, the identified CpGs with overall agreement in DNAm were involved in 128 statistically significant pathways, and the consistent CpGs were involved in seven pathways (Supplementary Table 1). Of the 128 (minimum FDR-adjusted p = 1.72 × 10⁻¹⁵) and the seven (minimum FDR-adjusted p = 0.003) pathways, the most statistically significant pathway was metabolic pathways (Table 2). Furthermore, five pathways, endocytosis, fatty acid metabolism, apelin signaling pathway, axon guidance and synaptic vesicle cycle, were common between the two pathway analyses (namely those of overall agreed and those of consistent CpGs). Four of the 10 most statistically significant pathways identified based on overall agreement CpGs were related to immunity (platelet activation, C-type lectin receptor signaling pathway, Fc gamma R-mediated phagocytosis and B-cell receptor signaling pathway, Table 2).
Table 2. . The significant KEGG enrichment pathways analysis with gometh function in R.
| Pathway | Gene count | p-value§ | FDR p-value§ | p-value¶ | FDR p-value¶ |
|---|---|---|---|---|---|
| Metabolic pathways† | 1470 | 5.12 × 10⁻¹⁸ | 1.72 × 10⁻¹⁵ | 9.61 × 10⁻⁶ | 0.003 |
| Endocytosis† | 246 | 4.03 × 10⁻⁵ | 7.55 × 10⁻⁴ | 8.67 × 10⁻⁵ | 0.015 |
| Fatty acid metabolism† | 56 | 0.011 | 0.034 | 3.37 × 10⁻⁴ | 0.028 |
| Apelin signaling pathway† | 137 | 0.003 | 0.015 | 4.35 × 10⁻⁴ | 0.029 |
| Axon guidance† | 180 | 1.94 × 10⁻⁴ | 0.002 | 8.65 × 10⁻⁴ | 0.042 |
| Synaptic vesicle cycle† | 78 | 1.07 × 10⁻⁴ | 0.001 | 8.54 × 10⁻⁴ | 0.042 |
| Platelet activation‡ | 124 | 0.001 | 0.009 | - | - |
| C-type lectin receptor signaling pathway‡ | 104 | 0.005 | 0.020 | - | - |
| Fc gamma R-mediated phagocytosis‡ | 92 | 0.005 | 0.021 | - | - |
| B cell receptor signaling pathway‡ | 80 | 0.013 | 0.037 | - | - |
Pathways in both paired t-test and Pearson’s correlation.
Immunity related pathways based on paired t-test only.
p-value for paired t-test based pathway.
p-value for Pearson's correlation based pathway.
FDR: False discovery rate.
Discussion
Several studies have focused on epigenome-scale comparison of DNAm between BL and BEC [2,3,16,17]. However, to the best of our knowledge, this is the first study that comprehensively assessed the level of comparability (overall agreement and consistency) in DNAm in young adults between BL and BEC at a genome scale, as well as the distributions of comparable and incomparable CpG sites regarding their location on genes and their position with respect to CpG islands. With genome-scale DNAm data in the IOWBC, of the 767,412 CpGs, 247,721 (32.3%) CpGs showed an overall agreement in DNAm and 47,371 (6.2%) CpGs demonstrated consistency in DNAm between BL and BEC. It is worth noting that recent studies suggested that nasal epithelium could be a better surrogate tissue for BEC compared with blood in the studies of asthma [2,3,34]. Epidemiological studies of epigenetics and asthma to date, however, have predominantly measured DNAm using BL [4–11] because these sources of samples are readily accessible [3]. Findings from our assessment on comparable and incomparable CpGs have the potential to benefit studies utilizing DNAm in BL.
Of the 143,982 total CpGs located in CpG islands, about 60% of them showed overall agreement identified by paired t-tests, while only 8.7% of them were shown to be consistent (via Pearson’s correlation coefficients). Although the percentage of consistency is lower than that of overall agreement, the coverage patterns are comparable between findings based on paired t-tests and those based on Pearson’s correlations. This observation is in line with the fact that the CpG island is a region with a high frequency of CpG sites [28]. Our study also shows that about 40% of the CpGs with overall agreement and 34% with consistency between BL and BEC were localized to CpG islands in proximal promoter regions, with potential biological implications on the gene activity. Our additional assessments showed that among the identified comparable CpGs (overall agreement or consistency) in promoter regions, 44–56% were in CpG islands, almost double the percentages for incomparable CpGs (overall disagreed or inconsistent). Such a discrepancy in [30] percentage supports a suggestion that the comparability between the two tissue was not by chance, although they are not perfectly comparable.
Regardless of the tissue types, most of the identified CpGs located in TSS200 and first exon of genes were hypomethylated and a very small portion of the CpGs were heterogeneously methylated. Although the patterns of distribution are similar between the two tissues, there is a possibility that for certain CpGs, DNAm is correlated, but the magnitude in DNAm is different on average.
This study used paired t-test and Pearson’s correlation coefficient to identify the agreed or consistent level of DNAm at CpGs between BL and BEC. For each CpG site, the paired t-test compared its DNAm in BL with that in BEC and assessed their differences on average. Thus, its focus was on the mean differences in DNAm between BL and BEC. On the other hand, the Pearson’s correlation analyses evaluated linear correlation between the two tissues to assess the agreement at an individual level. Because paired t-test only compares the mean of the DNAm level rather than the linear correlation of individuals, the overall agreed CpGs based on paired t-tests reflect that the means are the same in two tissues regardless of the linearity when comparing each DNAm value, and thus are less stringent compared with correlation-based assessments. This explains why we identified more CpGs that agreed between the two tissues based on paired t-tests than those based on Pearson’s correlation assessments. An intraclass correlation coefficient was not used in the assessment of agreement, because the intraclass correlation coefficient evaluates whether DNAm between two tissues is identical, which is overly stringent and is not the focus of our study.
We did not adjust for cell types in the present study. The focus of our study was to assess overall agreement and consistency in DNAm measured between BL and BEC, regardless of any tissue-specific factors. Thus, adjustment of cell types was not encouraged, since it would potentially lead to biased assessment and comparisons between the two tissues.
Multiple immunity related pathways are well represented by the identified CpGs, indicated by strong statistical significance shown in pathway analyses. Platelet activation factor (Table 2) has been implicated in IgE-mediated antigen-dependent allergic inflammation and in allergic asthma that initiates a cascade of events starting from the production of inflammatory mediators to propagation of an airway inflammatory response [35]. c-type lectin receptors belong to a major class of pattern recognition molecules during fungal infection. Besides their role in innate and adaptive immunity, c-type lectin receptors participate in shaping allergic airway diseases, specifically in response to allergens of fungal origin from house dust mite [36,37]. Single nucleotide polymorphisms in the Fc gamma receptor II have been found to be associated with several airway-associated diseases such as recurrent bacterial tract infection, bacteremia pneumococcal pneumonia, severe acute respiratory syndrome and atopy [38]. A similar relationship between IgE and Fc gamma receptor III was observed in murine models [39]. B cell receptor signaling (Table 2) was shown to upregulate the otherwise tightly controlled IgE production by promoting the rapid differentiation of B cells into IgE producing plasma cells, a proposed mechanism for IgE-mediated atopy [40,41].
A limitation of this study is the small sample size. A further evaluation of the identified CpGs is certainly needed in a large-scale study. On the other hand, with paired data, the homogeneity in an individual is expected to be high, partially compensating for the power loss. In addition, our results were limited to the design of arrays that do not measure genome wide methylation, but a selected representation of the genome. In this case, the proportions calculated are conditional on the number of CpGs in a region or location included on an array. Another limitation is that we assumed CpGs were independent and examined one CpG at a time. However, DNAm at CpGs in CpG islands tends to be correlated. Taking this correlation into account, further analytic approaches, such as spatial modeling, are needed to investigate the agreement between the two tissues.
Conclusion
The findings suggested that DNAm between BL and in BEC was comparable at certain CpGs and those CpGs were more likely to be in CpG islands of promoter regions of genes. Given the regulatory function of DNAm on gene activity, at CpG sites showing comparability between the two tissues, it is possible to use blood collected from less invasive sampling approach as a biomarker for BEC in epigenetic mechanism studies of lower airway-related diseases. However, due to potential tissue specificity and given the small sample size in this study and large variation of DNAm across subjects, we do not have a sufficient power to draw a conclusion regarding the potential of surrogacy and large scale studies as well as laboratory experiments are greatly needed to further assess the CpGs identified in our study.
Future perspective
Improved understanding of epigenetic mechanisms in the development of allergic diseases is critical to the basis for future allergic disease diagnosis and treatment, and in the long run for epigenetic therapies. Compared with airway tissues, blood-based specimens are a promising source of less invasive biomarkers in large scale studies and lend itself to a widespread use in clinical practice. Due to the potential of using whole blood as a biomarker for BEC at a large number of CpG sites, our findings may benefit future epigenetic studies on lower airway related diseases, especially when a large-scale assessment is the preference.
Summary points.
DNA methylation (DNAm) in bronchial epithelial cells (BEC) contributes greatly to the understanding of underlying epigenetic mechanisms of asthma and other respiratory diseases. However, sampling from lower airway tissues is relatively more invasive compared with sampling from blood.
Comparability (agreement or consistency) in DNAm at the genome scale between whole blood and BEC is unknown, and the distributions of comparable and incomparable CpGs are unknown.
This study examined to what extent DNAm measured in whole blood is comparable with that in BEC and has a potential of serving as a surrogate for DNAm in BEC.
Six males and eight females aged 20–21 years with DNA samples available in both blood leukocytes and BEC from Isle of Wight Birth Cohort were included in this study.
Overall agreement (paired t-tests of the average DNAm difference with p > 0.05 after controlling false discovery rate) and consistency (DNAm Pearson’s correlation coefficients >0.5) between the two tissues, at each of the 767,412 CpGs, were evaluated.
We identified 247,721 (32.3%) CpGs showing overall agreement and 47,371 (6.2%) CpGs showing consistency in DNAm between blood leukocytes and BEC.
A large portion of comparable CpGs are located in the CpG islands and in the promoter region (TSS1500 and TSS200) of genes, and certain immune pathways are well represented by the identified CpGs, indicating the potential of using blood as a marker for BEC at those CpGs for assessment of epigenetics of lower airway-related diseases.
Supplementary Material
Acknowledgments
The authors thanked A Alhendi for his invaluable help in data analyses, and the nurses and staff at the David Hide Asthma & Allergy Research Centre, Isle of Wight, UK, for their help in recruitment and sample collection.
Footnotes
Supplementary data
To view the supplementary data that accompany this paper please visit the journal website at: www.futuremedicine.com/doi/suppl/10.2217/epi-2020-0384
Author contributions
Y-S Lee and H Zhang carried out the project and drafted the manuscript. H Zhang conceived the study and provided guidance on the analytical and statistical aspects. Y Jiang provided guidance on analytical and statistical aspects. Y-S Lee did data management and performed all the statistical analyses. L Kadalayil was involved in the Isle of Wight Birth cohort data management and preprocessing and revised the manuscript. JW Holloway and SL Ewart supervised the DNA methylation measurement and revised the manuscript. JW Holloway and W Karmaus provided guidance on data analyses. SH Arshad was involved sample collection, data acquisition, DNA-M arraying, study design and critical revision. All authors read and approved the final manuscript.
Financial & competing interests disclosure
This work was supported by National Institutes of Health (NIH) under grant [R01AI121226] (PIs: Zhang and Holloway); (R01HL132321); and (R03HD092776) (PI: Karmaus). The authors have no other relevant affiliations or financial involvement with any organization or entity with a financial interest in or financial conflict with the subject matter or materials discussed in the manuscript apart from those disclosed.
No writing assistance was utilized in the production of this manuscript.
Ethical conduct of research
The authors state that they have obtained appropriate institutional review board approval or have followed the principles outlined in the Declaration of Helsinki for all human or animal experimental investigations. In addition, for investigations involving human subjects, informed consent has been obtained from the participants involved.
References
Papers of special note have been highlighted as: • of interest
- 1.Moore LD, Le T, Fan G. DNA methylation and its basic function. Neuropsychopharmacology 38(1), 23–38 (2013). [DOI] [PMC free article] [PubMed] [Google Scholar]
- 2.Lin P, Shu H, Mersha TB. Comparing DNA methylation profiles across different tissues associated with the diagnosis of pediatric asthma. Sci. Rep. 10(1), 1–12 (2020). [DOI] [PMC free article] [PubMed] [Google Scholar]
- 3.Brugha R, Lowe R, Henderson AJ et al. DNA methylation profiles between airway epithelium and proxy tissues in children. Acta Paediatr. 106(12), 2011–2016 (2017). [DOI] [PubMed] [Google Scholar]
- 4.Lee MK, Hong Y, Kim S, Kim WJ, London SJ. Epigenome-wide association study of chronic obstructive pulmonary disease and lung function in Koreans. Epigenomics 9(7), 971–984 (2017). [DOI] [PMC free article] [PubMed] [Google Scholar]
- 5.Lepeule J, Baccarelli A, Tarantini L et al. Gene promoter methylation is associated with lung function in the elderly: The Normative Aging Study. Epigenetics 7(3), 261–269 (2012). [DOI] [PMC free article] [PubMed] [Google Scholar]
- 6.Qiu W, Baccarelli A, Carey VJ et al. variable DNA methylation is associated with chronic obstructive pulmonary disease and lung function. Am. J. Resp. Crit. Care Med. 185(4), 373–381 (2012). [DOI] [PMC free article] [PubMed] [Google Scholar]
- 7.Kabesch M, Michel S, Tost J. Epigenetic mechanisms and the relationship to childhood asthma. Eur. Resp. J. 36(4), 950–961 (2010). [DOI] [PubMed] [Google Scholar]
- 8.Edris A, den Dekker HT, Melén E, Lahousse L. Epigenome-wide association studies in asthma: a systematic review. Clin. Exp. Allergy 49(7), 953–968 (2019). [DOI] [PubMed] [Google Scholar]; • A recent systematic review of epigenome-wide association studies which demonstrates significant associations between asthma and DNA methylation (DNAm) at CpGs from cells in different tissues.
- 9.Hudon Thibeault A, Laprise C. Cell-specific DNA methylation signatures in asthma. Genes 10(11), 932 (2019). [DOI] [PMC free article] [PubMed] [Google Scholar]
- 10.Imboden M, Wielscher M, Rezwan FI et al. Epigenome-wide association study of lung function level and its change. Eur. Resp. J. 54(1), e1900457,(2019). [DOI] [PMC free article] [PubMed] [Google Scholar]
- 11.Kabesch M, Tost J Recent findings in the genetics and epigenetics of asthma and allergy. Seminars In Immunopathology. 42(1), 43–60 (2020). [DOI] [PMC free article] [PubMed] [Google Scholar]
- 12.Reese SE, Xu C, Herman T et al. Epigenome-wide meta-analysis of DNA methylation and childhood asthma. J. Allergy Clin. Immunol. 143(6), 2062–2074 (2019). [DOI] [PMC free article] [PubMed] [Google Scholar]; • Asthma-related differential methylation in blood in children was substantially replicated in eosinophils and respiratory epithelium.
- 13.Tang B, Zhou Y, Wang C, Huang TH, Jin VX. Integration of DNA methylation and gene transcription across nineteen cell types reveals cell type-specific and genomic region-dependent regulatory patterns. Sci. Rep. 7(1), 1–11 (2017). [DOI] [PMC free article] [PubMed] [Google Scholar]
- 14.Lokk K, Modhukur V, Rajashekar B et al. DNA methylome profiling of human tissues identifies global and tissue-specific methylation patterns. Genome Biol. 15(4), 3248 (2014). [DOI] [PMC free article] [PubMed] [Google Scholar]
- 15.Moore JE, Purcaro MJ, Pratt HE et al. Expanded encyclopaedias of DNA elements in the human and mouse genomes. Nature 583(7818), 699–710 (2020). [DOI] [PMC free article] [PubMed] [Google Scholar]; • A large proportion of epigenetic modifications, including DNAm at CpG sites, are tissue and cell type specific.
- 16.Stefanowicz D, Hackett T, Garmaroudi FS et al. DNA methylation profiles of airway epithelial cells and PBMCs from healthy, atopic and asthmatic children. PloS ONE 7(9), e44213 (2012). [DOI] [PMC free article] [PubMed] [Google Scholar]
- 17.Yang IV, Richards A, Davidson EJ et al. The nasal methylome: a key to understanding allergic asthma. Am. J. Resp. Crit. Care Med. 195(6), 829–831 (2017). [DOI] [PMC free article] [PubMed] [Google Scholar]
- 18.Stueve TR, Li W, Shi J et al. Epigenome-wide analysis of DNA methylation in lung tissue shows concordance with blood studies and identifies tobacco smoke-inducible enhancers. Hum. Mol. Genet. 26(15), 3014–3027 (2017). [DOI] [PMC free article] [PubMed] [Google Scholar]; • Epigenome-wide analysis regarding the comparability in DNAm between blood and lung tissues.
- 19.Arshad SH, Holloway JW, Karmaus W et al. Cohort profile: The Isle of Wight whole population birth cohort (IOWBC). Int. J. Epidemiol. 47(4), 1043–1044i (2018). [DOI] [PMC free article] [PubMed] [Google Scholar]; • A birth cohort established in 1989/1990 with focus on natural history of asthma and allergy.
- 20.Arshad SH, Patil V, Mitchell F et al. Cohort Profile Update: The Isle of Wight Whole Population Birth Cohort (IOWBC). Int. J. Epidemiol. 2020) (Epub ahead of print). [DOI] [PMC free article] [PubMed] [Google Scholar]
- 21.British Thoracic Society Bronchoscopy Guidelines Committee. a Subcommittee of Standards of Care Committee of British Thoracic Society. British Thoracic Society guidelines on diagnostic flexible bronchoscopy. Thorax 56(Suppl. 1), i1–21 (2001). [DOI] [PMC free article] [PubMed] [Google Scholar]
- 22.Lam LL, Emberly E, Fraser HB et al. Factors underlying variable DNA methylation in a human community cohort. Proc. Nat. Acad. Sci. USA 109(Suppl. 2), 17253–17260 (2012). [DOI] [PMC free article] [PubMed] [Google Scholar]
- 23.Price EM, Cotton AM, Lam LL et al. Additional annotation enhances potential for biologically-relevant analysis of the Illumina Infinium HumanMethylation450 BeadChip array. Epigenetics & Chromatin 6(1), 1–15 (2013). [DOI] [PMC free article] [PubMed] [Google Scholar]
- 24.Eckhardt F, Lewin J, Cortese R et al. DNA methylation profiling of human chromosomes 6, 20 and 22. Nat. Genet. 38(12), 1378–1385 (2006). [DOI] [PMC free article] [PubMed] [Google Scholar]
- 25.Li Y, Zhu J, Tian G et al. The DNA methylome of human peripheral blood mononuclear cells. PLOS Biology 8(11), e1000533 (2010). [DOI] [PMC free article] [PubMed] [Google Scholar]
- 26.Du P, Zhang X, Huang C et al. Comparison of beta-value and m-value methods for quantifying methylation levels by microarray analysis. BMC Bioinformatics 11(1), 587 (2010). [DOI] [PMC free article] [PubMed] [Google Scholar]
- 27.Jiang Y, Wei J, Zhang H et al. Epigenome wide comparison of DNA methylation profile between paired umbilical cord blood and neonatal blood on Guthrie cards. Epigenetics 15(5), 454–461 (2020). [DOI] [PMC free article] [PubMed] [Google Scholar]; • CpGs with a correlation of 0.5 or higher were treated as consistent CpGs.
- 28.Saxonov S, Berg P, Brutlag DL. A genome-wide analysis of CpG dinucleotides in the human genome distinguishes two distinct classes of promoters. Proc. Nat. Acad. Sci. USA 103(5), 1412–1417 (2006). [DOI] [PMC free article] [PubMed] [Google Scholar]
- 29.Deaton AM, Bird A. CpG islands and the regulation of transcription. Genes & Development 25(10), 1010–1022 (2011). [DOI] [PMC free article] [PubMed] [Google Scholar]
- 30.Illumina. Field guide to methylation methods. (2016). https://www.illumina.com/content/dam/illumina-marketing/documents/products/other/field_guide_methylation.pdf
- 31.Irizarry RA, Ladd-Acosta C, Wen B et al. The human colon cancer methylome shows similar hypo-and hypermethylation at conserved tissue-specific CpG island shores. Nat. Genet. 41(2), 178–186 (2009). [DOI] [PMC free article] [PubMed] [Google Scholar]
- 32.Sandoval J, Heyn H, Moran S et al. Validation of a DNA methylation microarray for 450,000 CpG sites in the human genome. Epigenetics 6(6), 692–702 (2011). [DOI] [PubMed] [Google Scholar]
- 33.Geeleher P, Hartnett L, Egan LJ, Golden A, Raja Ali RA, Seoighe C. Gene-set analysis is severely biased when applied to genome-wide methylation data. Bioinformatics 29(15), 1851–1857 (2013). [DOI] [PubMed] [Google Scholar]
- 34.Solazzo G, Ferrante G, La Grutta S. DNA methylation in nasal epithelium: strengths and limitations of an emergent biomarker for childhood asthma. Front. Pediatr. 8, 256(2020). [DOI] [PMC free article] [PubMed] [Google Scholar]
- 35.Turkalj M, Banic I. The role of platelets in allergic inflammation and asthma. : Asthma - Biological Evidences, Celso Pereira. IntechOpen, (2019). https://www.intechopen.com/books/asthma-biological-evidences/the-role-of-platelets-in-allergic-inflammation-and-asthma [Google Scholar]; • Platelet activation factor initiates a cascade of events starting from the production of inflammatory mediators to propagation of an airway inflammatory response.
- 36.Hadebe S, Brombacher F, Brown GD. C-type lectin receptors in asthma. Front. Immunol. 9, 733 (2018). [DOI] [PMC free article] [PubMed] [Google Scholar]; • C-type lectin receptors participate in shaping allergic airway diseases.
- 37.Chen M, Huang M, Yu W et al. Antibody blockade of Dectin-2 suppresses house dust mite-induced Th2 cytokine production in dendritic cell-and monocyte-depleted peripheral blood mononuclear cell co-cultures from asthma patients. J. Biomed. Sci. 26(1), 1–12 (2019). [DOI] [PMC free article] [PubMed] [Google Scholar]
- 38.Wu J, Lin R, Huang J et al. Functional Fcgamma receptor polymorphisms are associated with human allergy. PLoS ONE 9(2), e89196 (2014). [DOI] [PMC free article] [PubMed] [Google Scholar]
- 39.Arase N, Arase H, Hirano S, Yokosuka T, Sakurai D, Saito T. IgE-mediated activation of NK cells through Fc gamma RIII. J. Immunol. 170(6), 3054–3058 (2003). [DOI] [PubMed] [Google Scholar]
- 40.Yang Z, Robinson MJ, Chen X et al. Regulation of B cell fate by chronic activity of the IgE B cell receptor. eLife 5, e21238 (2016). [DOI] [PMC free article] [PubMed] [Google Scholar]; • Chronic B cell receptor activity and access to T cell help play critical roles in regulating IgE responses.
- 41.Saunders SP, Ma EG, Aranda CJ, Lafaille de Curotto, Maria A. Non-classical B cell memory of allergic IgE responses. Front. Immunol. 10, 715 (2019). [DOI] [PMC free article] [PubMed] [Google Scholar]
Associated Data
This section collects any data citations, data availability statements, or supplementary materials included in this article.