

Abstract
The potential applicability of concepts and methods of the paradigm of precision medicine to the field of applied behavior analysis is only beginning to be explored. Both precision medicine and applied behavior analysis seek to understand and classify clinical problems through identification of their causal pathways. Both aim to develop treatments directly targeting those causal pathways, which also requires an understanding of the mechanisms by which treatments produce change (treatment-action pathways). In the current study, we extend the data-analytic methods and concepts described by Hagopian et al. (2018) toward the identification of variables that predict response to functional communication training (FCT). We discuss emerging conceptual issues, including the importance of distinguishing predictive behavioral markers from predictor variables based on their purported involvement in the causal or treatment-action pathways. Making these discriminations is a complex undertaking that requires knowledge of these mechanisms and how they interact.
Keywords: functional analysis, functional communication training, precision medicine, predictive behavioral markers, predictor variables
The potential applicability of precision medicine to the field of applied behavior analysis is only beginning to be explored (Hagopian et al., 2018). Precision medicine represents an approach to disease research and classification based on an understanding of the causal mechanisms of diseases, rather than their immediately apparent signs and symptoms. Technological advances increasingly enable researchers to identify the genetic, molecular, and cellular variables that give rise to diseases, or the mechanisms that establish and maintain a disease (i.e., causal pathways). Knowledge of these causal pathways also can reveal subtypes of what was thought to be a single disease and inform the development of more targeted interventions. Conversely, the treatment-action pathway refers to the mechanisms by which treatments alter the disease process. In addition to relying on biomedical technologies that identify disease and treatment mechanisms, precision medicine requires data-analytic methods to isolate and quantify the accuracy of biological variables (biomarkers) that reflect the disease process and can be used to predict response to treatment. In the current study, we further explicate how these concepts and methods are translatable to applied behavior analysis, conduct an analysis to identify variables that may predict response to functional communication training (FCT), and discuss emerging conceptual issues regarding the application of these methods to applied behavior analysis.
Precision Medicine and Applied Behavior Analysis
Causal and Treatment-Action Pathways
Despite its focus on biological diseases and interventions, the data-analytic methods and concepts of precision medicine are generalizable to and compatible with the fundamental tenets of applied behavior analysis (see Hagopian et al., 2018 for a detailed discussion). Both precision medicine and applied behavior analysis seek to understand and classify clinical problems through the identification of the causal mechanisms of dysfunction. With biological diseases, a goal is to identify and understand underlying dysfunctional biological processes that give rise to observable diseases and their related symptoms. These causal pathways can be highly complex, involving dysfunction at multiple points in the process between the ultimate cause to the presenting problem. In the case of problem behavior, a goal is to identify the controlling variables that occasion and reinforce the unwanted behavior. Though problem behaviors may be the product of a functional behavioral process (e.g., reinforcement), they are dysfunctional in the sense that they produce injury to self or others, impair one’s ability to function, or are otherwise detrimental in the long term. Thus, the contingencies that support problem behavior are part of the causal pathway of behavioral dysfunction. Causal pathways of behavioral dysfunction could theoretically include other functional dimensions of the behavior of concern, learning histories, skills deficits, and response tendencies such as behavioral invariance or temporal discounting that set the stage for the emergence of problem behavior. In the case of skills deficits, the causal pathways can include learning histories as well as deficits related to intellectual disabilities.
Precision medicine and applied behavior analysis also seek to develop individualized treatments that precisely target the causal pathways of biological or behavioral dysfunction, respectively. As dysfunction occurring earlier along the pathway can lead to additional dysfunction, intervening at earlier points in the pathway is optimal. Fundamental to both approaches is the recognition that, to develop targeted interventions, there is also a need to understand the mechanisms by which treatments produce change. Many behavioral treatments involve multiple components relying on processes including extinction, reinforcement, stimulus control, altering motivating operations, and so on. We refer to these disease-modifying or behavior-change mechanisms as the treatment-action pathways. Table 1 provides a list of these and other precision medicine related terms and their translation to applied behavior analysis.
Table 1.
List of Precision Medicine Related Terms, Definitions, and Examples
| Term | Definition and Examples |
|---|---|
| Causal Pathways of Dysfunction | Mechanisms that establish or maintain biological dysfunction (i.e., disease) or behavioral dysfunction (e.g., problem behavior, skills deficits), respectively |
| Examples: BRCA1 mutations inhibit cell repair and lead to cancer; establishing operations and contingencies that occasion and maintain problem behavior | |
| Treatment-Action Pathways | Mechanisms by which biomedical or behavioral interventions alter the causal pathways of biological or behavioral dysfunction, respectively |
| Examples: Drugs that interfere with reuptake of serotonin; behavioral interventions that involve withholding reinforcement that historically maintained problem behavior (i.e., extinction) | |
| Predictive Biomarkers (PBioM) | Biomarkers that predict response to a specific treatment |
| Examples: EGFR mutations in non-small cell lung cancer predicts response to EGFR inhibitors | |
| Predictive Behavioral Markers (PBMs) | Objective behavioral measures that predict response to treatment by way of their direct involvement in the causal or treatment-action pathways |
| Examples: Level of differentiation (LOD) of automatically maintained self-injury predicts response to treatment using reinforcement | |
| Target Behavior PBMs | Types of PBMs that are related to a functional dimension of the target behavior of concern that is directly involved in the causal pathway |
| Examples: Operant function of problem behavior; LOD of automatically maintained SIB | |
| Behavioral Capacity PBMs | Types of PBMs that are related to learning capacities or behavioral repertoires necessary for a behavioral treatment to exert its effects through involvement in the causal or treatment-action pathways |
| Examples: Yet to be subjected to PBM analytic methods (see text) | |
| Predictor Variables | Variables that predict response to treatment but without direct involvement in the causal or treatment-action pathways |
| Examples: Weight, blood pressure, (biomedical interventions); adherence to treatment recommendations, appointment keeping (behavioral interventions) | |
| Treatments Targeting Causal Pathways | Disease-modifying biomedical treatments directly targeting the disease mechanisms (precision medicine-informed interventions); function-based behavioral treatments directly targeting the controlling variables (applied behavior-analytic interventions) |
| Examples: Interferon drugs modulating immune system dysfunction responsible for destruction of myelin in multiple sclerosis; functional communication training establishing a mand occasioned by the same motivating operations that historically occasioned problem behavior that now produces reinforcement in lieu of problem behavior (which is on extinction) | |
| Treatments Focused on Management | Biomedical treatments focused on symptom management that do not alter the underlying disease processes (symptomatic treatment); default behavioral treatment technologies to override unknown existing contingencies (behavior modification) |
| Examples: Nasal decongestants to treat symptoms of upper respiratory infections; a behavioral intervention involving contingencies aimed at increasing desirable behaviors and decreasing problem without knowledge of function |
Therapeutic Implications
To the extent that we can understand the causal and treatment-action pathways of biological or behavioral dysfunction, we can effectively act on those mechanisms and more directly alter the source of dysfunction. Prior to the advent and use of biomedical technologies enabling the identification of the causal pathways of biological dysfunction, early medical interventions often targeted presenting signs and symptoms. Technological advancements in biomedical science that advanced knowledge of disease and treatment mechanisms transformed traditional medicine into precision medicine. For example, consider two types of therapies for multiple sclerosis (MS), a chronic autoimmune inflammatory disease of the central nervous system caused by deterioration of myelinated axons. Disease-modifying therapies (Goldenberg, 2012) modulate the immune system in a way that reduces destruction of myelin. In contrast, symptomatic treatments (e.g., corticosteroids) reduce inflammation and provide short-term symptomatic relief but do not alter the disease process—and may have deleterious side effects preventing their long-term use (Goldenberg, 2012). In other words, disease-modifying therapies more directly target the disease mechanisms further up the causal pathway, whereas symptomatic treatments may only temporarily ameliorate clinical symptoms (and may have iatrogenic effects; Kompel et al., 2019; see Table 1).
Similarly, advances in functional analysis (FA) technologies facilitating the identification of controlling variables of problem behavior provided structure for classifying problem behavior, which directly translated into a prescriptive model for treatment design (i.e., function-based treatment). This ushered in a shift from the purely technological approach of behavior modification to the analytic, function-based approach that is the hallmark of applied behavior analysis (Mace, 1994). Thus, rather than applying default reinforcement and punishment contingencies to override unknown existing contingencies maintaining problem behavior, contemporary applied behavior analytic interventions are informed by an understanding of the function of behavior and the mechanisms by which treatments alter behavior. Theoretically, greater knowledge of the causal and treatment-action pathways affords us (as individual practitioners and as a field as a whole) with greater abilities to (a) develop more targeted treatments, (b) make more informed changes to interventions when effects wane, (c) better modify interventions when certain components cannot be applied, and (d) develop entirely new classes of interventions.
Biomarkers and Behavioral Markers
Disease processes occurring at various points along the causal pathway can be objectively measured and used in several ways. Broadly, disease biomarkers are objective biological measures that are related to, a product of, or the cause of a disease (La Thangue & Kerr, 2011). Different types of biomarkers may be distinguished by their unique features or functions: predictive biomarkers predict response to a specific treatment, diagnostic biomarkers identify a disease (or subtypes of a disease), and prognostic biomarkers provide information about the future course of that disease. It is possible that a single biomarker may function as a diagnostic, prognostic, and/or predictive marker simultaneously (e.g., BRCA1 gene; Carser et al., 2011). As Aronson (2005) describes, biomarkers may predict or correspond to important disease-related sequelae at different levels of analysis or at different locations within the causal pathway: “There are many links in the chain of events that leads from the pathogenesis of a disease to its clinical manifestations; biomarkers can be used at any point in the chain, at the molecular, cellular, or organ levels” (p. 491).
Predictive Biomarkers and Predictive Behavioral Markers
Predictive biomarkers (PBioMs) are a type of biomarker that predicts response to treatment. These represent the point of interaction between the treatment-action pathways of biomedical interventions (i.e., a drug) and the causal pathways of the disease. In the case where there is an intervention that directly targets the mechanism driving the disease process, the causal and treatment action-pathways are directly linked. PBioMs related to the treatment-action pathway could also include genetic mutations that affect an individual’s ability to effectively metabolize certain classes of medications—even if those mutations are not related to the causal pathway of the disease (e.g., Ventola, 2013). To the extent that those mutations directly affect those mechanisms of treatment action that alter the disease process, their ability to predict response to treatment represents a direct functional relation between the treatment and the disease.
Hagopian et al. (2018) translated the concepts underlying the function of predictive biomarkers to define predictive behavioral markers (PBMs) as objective behavioral measures that predict response to treatment. Two classes of PBMs, analogous to PBioMs, were proposed. The first type of PBM is related to the causal pathway of behavioral dysfunction: termed target behavior PBMs. These are related to a functional dimension of the target behavior of concern (see Table 1). Hagopian et al. then applied data-analytic methods used to quantify the accuracy and predictive utility of predictive biomarkers to identify two PBMs for automatically maintained self-injurious behavior (SIB) and its response to treatment using reinforcement alone. The two variables subjected to analysis were (a) the level of differentiation (LOD) of SIB across the play and alone or ignore conditions of the functional analysis, and (b) the derived categorical subtype of automatically maintained SIB. The LOD of SIB represents proportional responding across the play and no-interaction conditions of the FA. This quantifies the degree to which SIB changes as a function of the level of ambient stimulation, which was characterized as representing the sensitivity of SIB to disruption by alternative reinforcement. This dimension of behavior was thought to be related to both the causal pathway of this response class and the treatment-action pathway of interventions involving alternative reinforcement. With LOD (a continuous variable), analyses were performed to empirically identify the optimal “cutoff” (i.e., 0.64) that most accurately discriminated cases where reinforcement alone was and was not efficacious. When the LOD of SIB exceeded this cutoff, the probability of a positive response to treatment (positive predictive value) using reinforcement alone was very good (86%). For cases not meeting the LOD cutoff, the probability of a negative outcome was also very good (88%; negative predictive value). The analytic methods used in that study to examine the predictive utility of LOD are described in the current study (see Methods). Data analytic methods used for categorical variables (the categorical subtype of automatically maintained SIB) are described in detail in Hagopian et al. (2018).
The second type of PBM, termed behavioral capacity PBMs (see Hagopian et al., 2018), is related to learning capabilities or behavioral repertoires necessary for a behavioral treatment to exert its effects. This type of PBM is analogous to metabolic or pharmacogenomic PBioMs, which are objective biological measures that can impact the treatment-action pathways of medications. Many individuals, both healthy and those with diseases, have genetic mutations that affect their body’s ability to effectively metabolize medications. Thus, a medication that might be known to be efficacious may not be beneficial in some cases if such mutations are present. Analogously, if a person lacks learning capacities or skills essential for a behavioral intervention to produce change, an otherwise efficacious behavioral treatment may produce limited effects. It is also possible that a behavioral capacity PBM could be indirectly related to the causal pathway as well (assuming limited capacities set the stage for the emergence and maintenance of problem behavior). Behavioral capacity PBMs have yet to been empirically demonstrated. However, given that behavioral interventions rely on the operation of certain learning processes, it seems possible that limited capacities among individuals with intellectual disabilities or other impairments could impact how effectively some learning processes operate. Hypothetically, if it were shown that a certain level of listener skills, for example, was needed for an intervention relying on instructional control to produce reductions in problem behavior, then that level of listener skill could be a behavioral capacity PBM for that treatment. In an empirical study, Keohane et al. (2008) presented data illustrating that academic programs targeting verbal behavior were not effective with three children with autism until after observing repertoires were established. These and similar findings (Greer, 2002; 2020) suggest that observing behavior might be necessary for acquisition of important language skills. Thus, there may be a sufficient empirical and conceptual basis to test whether observing repertoires could be a behavioral capacity PBM for some treatments targeting verbal skills.
Predictive Behavioral Markers and Predictor Variables.
It is important to note that not all variables that predict response to treatment should be characterized as PBioMs or PBMs. That is, a variable may predict response to treatment (from a purely probabilistic or actuarial standpoint), even though it is not part of the causal or treatment-action pathways. This can occur with variables that are merely correlates to or indirect moderators of treatment. For example, variables such as caregiver adherence with recommendations, general appointment-keeping, and early response to treatment all may predict eventual response to treatment. Although a relation between these variables and outcomes may be demonstrated empirically, it is doubtful that this would be a function of their direct involvement in the specific causal or treatment-action pathways. Such variables may be better described as predictor variables rather than PBioMs or PBMs (see Table 1).
Although predictor variables may still have clinical utility, it is important to distinguish these variables from PBioMs and PBMs, which are directly related to the causal or treatment-action pathways (Aronson, 2005; Hill, 1965; La Thangue & Kerr, 2011). As speculated by Hagopian et al. (2018), in applied behavior analysis the identification of PBMs “relies upon knowledge acquired from smaller-scale studies designed to isolate variables related to the mechanisms of problem behavior and putative action treatment, as these may hold the most promise as potential PBMs” (p. 463). Thus, to make this distinction between predictor variables and PBMs more explicit, we expand upon the earlier definition to define PBMs as objective behavioral measures that predict response to treatment by way of their direct involvement in the causal or treatment-action pathways, and “predictor variables” as variables that predict response to treatment but without direct involvement in the causal or treatment-action pathways (see Table 1). Although the same data-analytic methods are used to quantify the predictive utility of PBMs and predictor variables (the probabilistic relation between the predictor and the outcome), PBMs require additional evidence (conceptual and empirical) linking them to the causal or treatment-action pathways, which is discussed further below.
Identifying Variables that Predict Response to Functional Communication Training
As summarized above, the data-analytic methods used in precision medicine have been applied to identify PBMs for automatically maintained SIB (Hagopian et al., 2018). However, the application of this approach to other functional classes of problem behavior or treatments has yet to be demonstrated. The operant reinforcing function of problem behavior is undoubtedly a PBM for response to function-based interventions—established by way of decades of evidence (e.g., Didden et al., 2006; Greer et al., 2016) and the obvious link between functional class (the causal pathways) and function-based treatments (the treatment-action pathways that act on those contingencies; see Hagopian et al., 2018). However, in the field of applied behavior analysis, we have ventured little beyond operant function as the basis for treatment selection for problem behavior. It remains unknown if causal and treatment-action pathways interact differently across functions and treatment combinations. That is, one type of function-based treatment (e.g., NCR) might be more efficacious for certain functional classes (e.g., attention), but less for another (e.g., escape). Likewise, it is not known whether the efficacy of different treatment components may vary across topographies of behavior within the same functional class (e.g., whether extinction may be more efficacious for SIB than for aggression). As was demonstrated with automatically maintained SIB, it is plausible that additional response dimensions and response patterns observed within FA conditions might affect the interaction between the causal and treatment-action pathways and thus be predictive of treatment outcomes.
Although LOD was found to be critical for automatically maintained SIB, this dimension of responding may be less relevant for socially maintained behavior which, by definition, is identified as such only when the LOD is high. As noted by Hagopian et al. (2018), both the candidate predictor variable of interest and outcome variable (i.e., response to treatment) must vary across a range of values if a relation is to be identified. A response dimension that merits analysis with respect to socially maintained problem behavior is the rate of problem behavior within the relevant FA test condition for the identified function (i.e., rate of problem behavior in the attention condition for attention-maintained behavior). Conceptually, it is generally accepted that changes in response rates vary in the presence of discriminative stimuli, in part, according to changes in relevant motivating operations (MOs; e.g., Lotfizadeh et al., 2012). This suggests that relatively higher response rates, which produce higher levels of reinforcement, are indicative of putatively stronger MOs. This may explain why, for example, following functional communication training (FCT; Carr & Durand, 1985) functional communication response rates may approximate pretreatment rates of problem behavior (e.g., Call et al., 2018; Roane et al., 2004). Consequently, relative rates of problem behavior during each FA condition may provide an index of the strength of relevant MOs controlling problem and alternative behavior (e.g., Brown et al., 2000; Hagopian et al., 2011). To the degree that FCT is more effective in contexts with potent MOs (e.g., Brown et al., 2000), higher response rates during FA conditions could be hypothesized to predict greater response to treatment with FCT.
Therefore, in addition to further explicating additional conceptual issues related to the nature and future applications of precision medicine concepts to the field of applied behavior analysis, another purpose of the present discussion was to apply the methodology outlined by Hagopian et al. (2018) to examine whether the rate of problem behavior in the differentiated FA test condition accurately predicts response to treatment with FCT and extinction. This includes discussion of whether the rate of problem behavior in the differentiated FA test condition (reflecting MO strength) is part of the causal or treatment-action pathways (a true PBM) or is merely a correlate that is not part of either of those pathways (a predictor variable).
Method
Participants and Setting
Consecutive controlled case series (CCCS) studies, which report on a series of cases that undergo a common procedure evaluated using a single case experimental design, where all cases are included regardless of outcomes (Hagopian, 2020), represent a rich source of clinical data that can be subjected to retrospective analysis. We obtained all data for the current analysis by combining data from three published CCCS studies that reported FA and treatment outcome data following FCT with extinction (Greer et al., 2016; Hagopian et al., 1998; Rooker et al., 2013). As each of these studies included every case that underwent FCT regardless of outcomes, the results are not biased by the selective inclusion of cases with certain outcomes (see Hagopian, 2020). All studies reported on participants with intellectual and developmental disabilities who engaged in problem behavior (e.g., SIB, aggression, disruption, elopement, inappropriate vocalizations) maintained by attention, escape, or access to tangibles. These studies were selected because they represent the three largest CCCS studies to date reporting FA and FCT outcomes. Overall, data from 25, 55, and 22 applications of FCT were obtained from Hagopian et al. (1998), Rooker et al. (2013), and Greer et al. (2016), respectively (see Table 3). All applications of FCT reported from Hagopian et al. were conducted with individuals receiving treatment for severe problem behavior within a specialized hospital-based inpatient unit. Forty-two of the applications reported by Rooker et al. were also conducted within the inpatient unit, and 13 of the applications were conducted with outpatients in the same program. All applications reported by Greer et al. were conducted with outpatients. Across studies, treatment data were sometimes reported for multiple applications of FCT for different functions of problem behavior (e.g., FCT was conducted separately for escape-maintained behavior as well as attention-maintained behavior) for the same individual. In such cases, we reported each treatment outcome and corresponding FA data (e.g., FCT for escape-maintained behavior and rate of problem behavior during escape FA condition) as separate applications (n attention = 37; n escape = 29; n tangible = 36).
Table 3.
Rate of Problem Behavior in FA and Percentage of Behavior Reduction with FCT and Extinction
| n | Function | Rate | % | n | Function | Rate | % | n | Function | Rate | % | n | Function | Rate | % |
|---|---|---|---|---|---|---|---|---|---|---|---|---|---|---|---|
| 1 | Esca | 3.5 | 95.35 | 28 | Tanb | 1.63 | 87.4 | 55 | Escb | 2.06 | 74.49 | 82 | Escc | 4.4 | 82.4 |
| 2 | Esca | 4.5 | 31.25 | 29 | Attnb | 4.72 | 97.89 | 56 | Attnb | 6.66 | 92.31 | 83 | Tanc | 1.9 | 93.6 |
| 3 | Esca | 1.1 | −2.52 | 30 | Escb | 3.64 | 89.84 | 57 | Escb | 13.7 | 93.93 | 84 | Escc | 6.6 | 74.8 |
| 4 | Esca | 13.8 | 91.88 | 31 | Attnb | 25.8 | 98.73 | 58 | Tanb | 0.77 | 62.38 | 85 | Tanc | 1.0 | 72.9 |
| 5 | Esca | 2.6 | 87.3 | 32 | Escb | 0.56 | 86.89 | 59 | Tanb | 7.27 | 6.05 | 86 | Attnc | 0.7 | 60 |
| 6 | Esca | 2.6 | 24.81 | 33 | Attnb | 2.73 | 65.43 | 60 | Attnb | 2 | 33 | 87 | Tanc | 1.2 | 100 |
| 7 | Attna | 6.9 | 98.31 | 34 | Tanb | 0.76 | 81.25 | 61 | Attnb | 6.4 | 96.06 | 88 | Tanc | 2.7 | 90.2 |
| 8 | Attna | 5.5 | 88.01 | 35 | Tanb | 0.28 | 81.71 | 62 | Tanb | 0.68 | 100 | 89 | Escc | 3.2 | 100 |
| 9 | Attna | 2.4 | 82.08 | 36 | Attnb | 3.07 | 100 | 63 | Attnb | 3.83 | 100 | 90 | Tanc | 6.4 | 100 |
| 10 | Attna | 2.9 | 61.12 | 37 | Attnb | 1.18 | 23.34 | 64 | Attnb | 54.9 | 99.6 | 91 | Attnc | 4.7 | 85.4 |
| 11 | Attna | 23 | −19.53 | 38 | Attnb | 1.75 | 32.58 | 65 | Attnb | 0.4 | 92.47 | 92 | Escc | 2.1 | 94.4 |
| 12 | Attna | 1.8 | −46.24 | 39 | Tanb | 0.68 | 100 | 66 | Escb | 0.5 | 63.4 | 93 | Escc | 2.2 | 100 |
| 13 | Attna | 5.0 | 52.76 | 40 | Tanb | 1.43 | 100 | 67 | Attnb | 6.38 | 74.36 | 94 | Tanc | 3.8 | 100 |
| 14 | Attna | 7.1 | 84.5 | 41 | Escb | 1 | 93.94 | 68 | Attnb | 1.6 | 48.61 | 95 | Attnc | 1.6 | 82.9 |
| 15 | Tana | 6.6 | 92.67 | 42 | Tanb | 1.03 | 96.68 | 69 | Attnb | 1.94 | 97.82 | 96 | Tanc | 2.2 | 84 |
| 16 | Attna | 7.0 | 96.88 | 43 | Tanb | 1.06 | 85.47 | 70 | Attnb | 1.94 | 95.75 | 97 | Tanc | 1.7 | 91 |
| 17 | Esca | 3.1 | 94.44 | 44 | Attnb | 3.27 | −314.2 | 71 | Escb | 2.78 | 75.38 | 98 | Tanc | 1.7 | 97.2 |
| 18 | Attna | 15.1 | 99.51 | 45 | Escb | 0.31 | 91.3 | 72 | Tanb | 0.52 | 93.88 | 99 | Escc | 1.6 | 98.1 |
| 19 | Esca | 5.6 | 97.67 | 46 | Escb | 5.68 | 96.3 | 73 | Tanb | 1.66 | 100 | 100 | Escc | 1.6 | 98.1 |
| 20 | Esca | 6.2 | 99.04 | 47 | Tanb | 4.01 | 93.74 | 74 | Attnb | 1.28 | 74.85 | 101 | Attnc | 2.3 | 87 |
| 21 | Attn | 2.4 | 99.04 | 48 | Escb | 2.76 | 48.39 | 75 | Escb | 0.62 | −27.5 | 102 | Tanc | 2.4 | 100 |
| 22 | Tana | 2.5 | 77.25 | 49 | Tanb | 2.57 | 100 | 76 | Tanb | 1.34 | 94.31 | ||||
| 23 | Attna | 6.1 | 96.84 | 50 | Tanb | 4.39 | 47.62 | 77 | Tanb | 1.34 | 91.73 | ||||
| 24 | Esca | 1.5 | 56.52 | 51 | Tanb | 2.06 | 44.63 | 78 | Tanb | 1.14 | 94.94 | ||||
| 25 | Tana | 3.7 | 75.96 | 52 | Attnb | 1.45 | 0.44 | 79 | Tanb | 4.2 | 97.89 | ||||
| 26 | Tanb | 1.16 | 91.56 | 53 | Attnb | 6.92 | 94.64 | 80 | Tanb | 2.53 | 94.64 | ||||
| 27 | Tanb | 0.32 | 100 | 54 | Attnb | 4.7 | 100 | 81 | Escc | 4.4 | 82.4 |
Note:
Greer et al. (2016); n = application number; % = reduction in problem behavior (percentage); all rates reflect responses/min
Initial Identification of Candidate Predictor
Given the aforementioned hypothesis that the rate of problem behavior in the differentiated test condition of the FA may provide an index of response strength or relevant MOs, we initially examined rate of problem behavior to identify potential patterns or trends (e.g., indicators of efficient responding, differences in response rate distributions) within extant datasets to determine if this variable warranted additional examination. In this exploratory phase, we simply plotted response to FCT (percentage reduction in problem behavior relative to baseline) as a function of response rate across behavioral functions. Each application was depicted as an individual data point to allow examination of the distribution of outcomes. We then used visual analysis and simple descriptive statistics to examine if a relation appeared to be present that warranted additional examination. Results from this exploratory process indicated that response rate during FA test conditions appeared to be related to response to FCT, subsequently warranting formal quantitative analysis.
Data Analysis
Response to treatment with FCT and extinction was the direct outcome measure that we used to classify participants as responders and nonresponders. The data-analytic methods used to identify PBioMs and PBMs require outcomes be expressed in this binary manner based on what is considered an objective but meaningful measure of change in the problem of concern.1 That is, we distinguished responders from nonresponders based on whether FCT with extinction produced at least an 80% reduction in target problem behavior from baseline, which is a common benchmark for positive response to treatment for problem behavior within the field of applied behavior analysis (e.g., Greer et al., 2016; Rooker et al., 2013). The candidate predictor was the mean rate of target problem behavior during the FA test condition corresponding to the functional reinforcer used in FCT. For example, the mean rate of responding during the escape condition of the FA would be the candidate predictor for response to treatment following FCT and extinction for escape-maintained problem behavior. Detailed descriptions of the functional-analysis and treatment-evaluation methods are described in the studies from which we obtained these data (Greer et al., 2016; Hagopian et al., 1998; Rooker et al., 2013).
Receiver Operator Characteristic (ROC) Curve
The data-analytic methods used to quantify the predictive accuracy of continuous candidate predictor variables (such as rate of responding) require the use of a ROC curve (different methods are used for categorical variables, such as subtypes; see Hagopian et al., 2018). Quantifying how well a variable accurately predicts response to treatment requires that one (a) define an objective benchmark of a meaningful change to represent a positive response to treatment, (b) identify the desired relative balance of specificity and sensitivity based on what type of error is of relatively greater concern, (c) calculate specificity and sensitivity pairs for each obtained value of the predictor by plotting a ROC curve to identify the cutoff corresponding to the desired balance of specificity and sensitivity, and (d) use that cutoff as the basis for determining the conditional probabilities of positive and negative outcomes (see Table 2).
Table 2.
Quantifying Accuracy and Predictive Utility of Predictive Behavioral Markers
| Term | Description and Relevance |
|---|---|
| Sensitivity | The proportion of cases that were accurately classified as responders by the PBM (proportion of true positives) among all the responders. High sensitivity is associated with relatively fewer false negatives. |
| Specificity | The proportion of cases that were accurately classified as nonresponders by the PBM (proportion of true negatives) among all the nonresponders. High specificity is associated with relatively fewer false positives. |
| Optimal Cutoff Point | If the costs of false positives and false negatives are equivalent, then the optimal cutoff point for the predictor would balance sensitivity and specificity. If the costs of one type of error are disproportionally high, then the optimal cutoff point would be selected to reduce those types of errors (e.g., to minimize false negatives a higher level of sensitivity would be selected, sacrificing specificity). |
| Receiver Operating Characteristic (ROC) Curve | Depicts the relationship between sensitivity (true positives) and 1-specificity (false positives) across a series of cutoff points for a continuous predictor. By calculating specificity and sensitivity pairs for every obtained value of the predictor, the optimal PBM cutoff point can be identified for classifying cases. |
| Area Under the Curve (AUC) | Quantifies the overall accuracy of prediction based on calculating the ROC curve; this value ranges from 0–1. With a binary outcome, 0.50 equals chance prediction; therefore, AUC of 0.70 is considered acceptable; above 0.80 is excellent; however, these values must be interpreted with consideration of base rates, PPV, and NPV. |
| Positive Predictive Value (PPV) | The proportion of actual responders among all who were predicted to be responders (i.e., all who met the cutoff). This is the conditional probability of a positive response to treatment given the individual meets/exceeds the selected cutoff (i.e., “tests positive” for the PBM). |
| Negative Predictive Value (NPV) | The proportion of actual nonresponders among all who were predicted to be nonresponders (i.e., all who did not meet the cutoff). This is the conditional probability of a negative response to treatment given the individual did not meet the selected cutoff (i.e., “tests negative” for the PBM). |
| Base Rates v. Conditional Probabilities | The overall proportion of cases who were responders is the unconditional probability of a positive response; the overall proportion of cases who were nonresponders is the unconditional probability of a negative response. These must be considered when interpreting PPV and NPV, respectively and their additive predictive utility. |
| PPV, NPV, & Making Predictions | To have clinical utility PPV and NPV must both exceed the base rate of a positive and negative outcome, respectively. Insofar as the sample and procedures used to calculate PPV (and NPV) have generality to other cases, these values can reflect the probability of a positive (or negative) response based on whether the selected cutoff or the PBM was met (or not met). |
Note. For brevity, all references to the “cutoff” of the PBM assume that a value exceeding the cutoff is associated with a positive response to treatment.
As noted above, determining the desired balance between sensitivity and specificity is essential to the use and interpretation of ROC curves. For an overview of sensitivity, specificity, and ROC curves in the context of PBMs see Hagopian et al. (2018); these terms are also summarized in Table 2. Briefly, the sensitivity of a predictor refers to the proportion of cases that were accurately classified as responders (true positives) among all the responders. Higher sensitivity is associated with relatively fewer false negatives. The specificity of a predictor refers to the proportion of cases that were accurately classified as nonresponders (true negatives) among all the nonresponders. Because specificity and sensitivity are inversely related, researchers must determine the relative importance of each based on which type of errors are of greater concern. Thus, when the costs or risks (to the patient) of false positives and false negatives are roughly equal, one would select the cutoff point where sensitivity and specificity are balanced (i.e., neither is sacrificed for the other). If the costs of one type of error are disproportionally high, then the optimal cutoff point would be selected to reduce those types of errors (e.g., to minimize false negatives, a higher level of sensitivity would be selected, sacrificing specificity). Like Hagopian et al., we selected the cutoff point where sensitivity and specificity were balanced as the risks of either over- or under-identifying potential responders to FCT were considered to be equivalent.
The ROC curve depicts the relationship between sensitivity (true positives) and 1-specificity (false positives) across a series of thresholds or “cutoffs” of the predictor. Broadly, ROC curves allow researchers to quantify the predictive accuracy of PBMs by calculating specificity (true negatives) and sensitivity (true positives) pairs for every obtained predictor value, which are calculated using the following formulas:
Positive and Negative Predictive Value (PPV and NPV)
The identified optimal cutoff point (where specificity and sensitivity were balanced) was then used as the basis for examining the accuracy of the predictor variable with respect to response to treatment. This is expressed using two values based on whether an individual “tested positive” or “tested negative” for the predictor (meaning they either met or did not meet the cutoff associated with a positive response)—and whether or not they actually responded to treatment. Positive predictive value (PPV) is the conditional probability of a positive response to treatment given the individual “tested positive” (meaning they met or exceeded the selected cutoff). This is the proportion of actual responders among all who were predicted to be responders (i.e., all who met the cutoff). Negative predictive value (NPV) is the conditional probability of a negative response to treatment given the individual “tested negative” (meaning they did not meet the cutoff). This is the proportion of cases accurately predicted to be nonresponders among all who were predicted to be nonresponders (i.e., all who did not meet the cutoff). The following formulas were used:
Consideration of Base Rates or Unconditional Probabilities
As is the case with interpreting the results of any conditional probability analysis, the conditional probability must be compared with the unconditional probability or “base rate.” In this case, PPV must provide a level of prediction that exceeds the base rate of a positive outcome to have practical value. The base rate of a positive outcome refers to the overall proportion of cases with a positive outcome. Likewise, NPV must provide a level of prediction that exceeds the base rate of negative outcome (the overall proportion of nonresponders). Therefore, to have clinical utility, PPV and NPV must both exceed the base rate of a positive and negative outcome, respectively. Given that the outcome is expressed in binary terms (a positive or negative outcome), the floor for evaluating prediction is 0.50, which would be obtained by random chance (that is, a value of 0.6 is only 10% above chance prediction). To have clinical utility PPV and NPV must both exceed the base rate of a positive and negative outcome, respectively. Metrics of accuracy (sensitivity and specificity) and metrics of predictive utility (PPV and NPV) simply describe the outcomes within the current sample. Insofar as the sample and outcomes have generality to other cases, one can use these PPV and NPV values to make predictions about the probability of what outcomes would be expected with future cases based on whether the selected cutoff of the PBM was met or not met.
In the current study, sensitivity, specificity, PPV, and NPV calculations were performed using Microsoft Excel 2016, although these calculations may also be performed by hand or with a variety of commercially available statistical software packages. PPV and NPV are also used to calculate the area under the curve (AUC), which quantifies the accuracy of prediction. AUC values of 0.5 would indicate that the predictor is 50% accurate, which is no better than chance. An AUC value of 1.0 would represent a perfect relation between the predictive behavioral marker and outcome variable (meaning all cases exceeding the cutoff are responders, and all falling below the cutoff are nonresponders). Accordingly, larger AUC values reflect better predictive accuracy, with values of 0.7 or greater representing acceptable discrimination between responders and nonresponders and values of 0.8 and greater considered excellent (see Hagopian et al., 2018; Rice & Harris, 2005). However, interpreting AUC values should not occur in isolation, as one must also consider base rates, as well as PPV and NPV (see Results). The AUC value derived from the ROC curve is comparable to the non-parametric Mann–Whitney U statistic (Mann & Whitney, 1947), as they both measure a classifier’s relative predictive utility relative to chance (Mason & Graham, 2002).
Results
Figure 1 depicts the ROC curves obtained using rate in the differentiated test conditions of FAs as a predictor for treatment using FCT for problem behavior maintained by attention, escape, or access to tangibles. As noted above, ROC curves quantify the predictive accuracy of variables by calculating the specificity (the proportion of true negatives) and sensitivity (the proportion of true positives) values for every obtained value of the predictor.2 Because the costs (i.e., risks to individuals) of failing to correctly identify potential responders (false negatives) or nonresponders (false positives) are equivalent for FCT, we elected to select the cutoff point where specificity and sensitivity were balanced (i.e., the pair of values were at their maximum).
Figure 1.
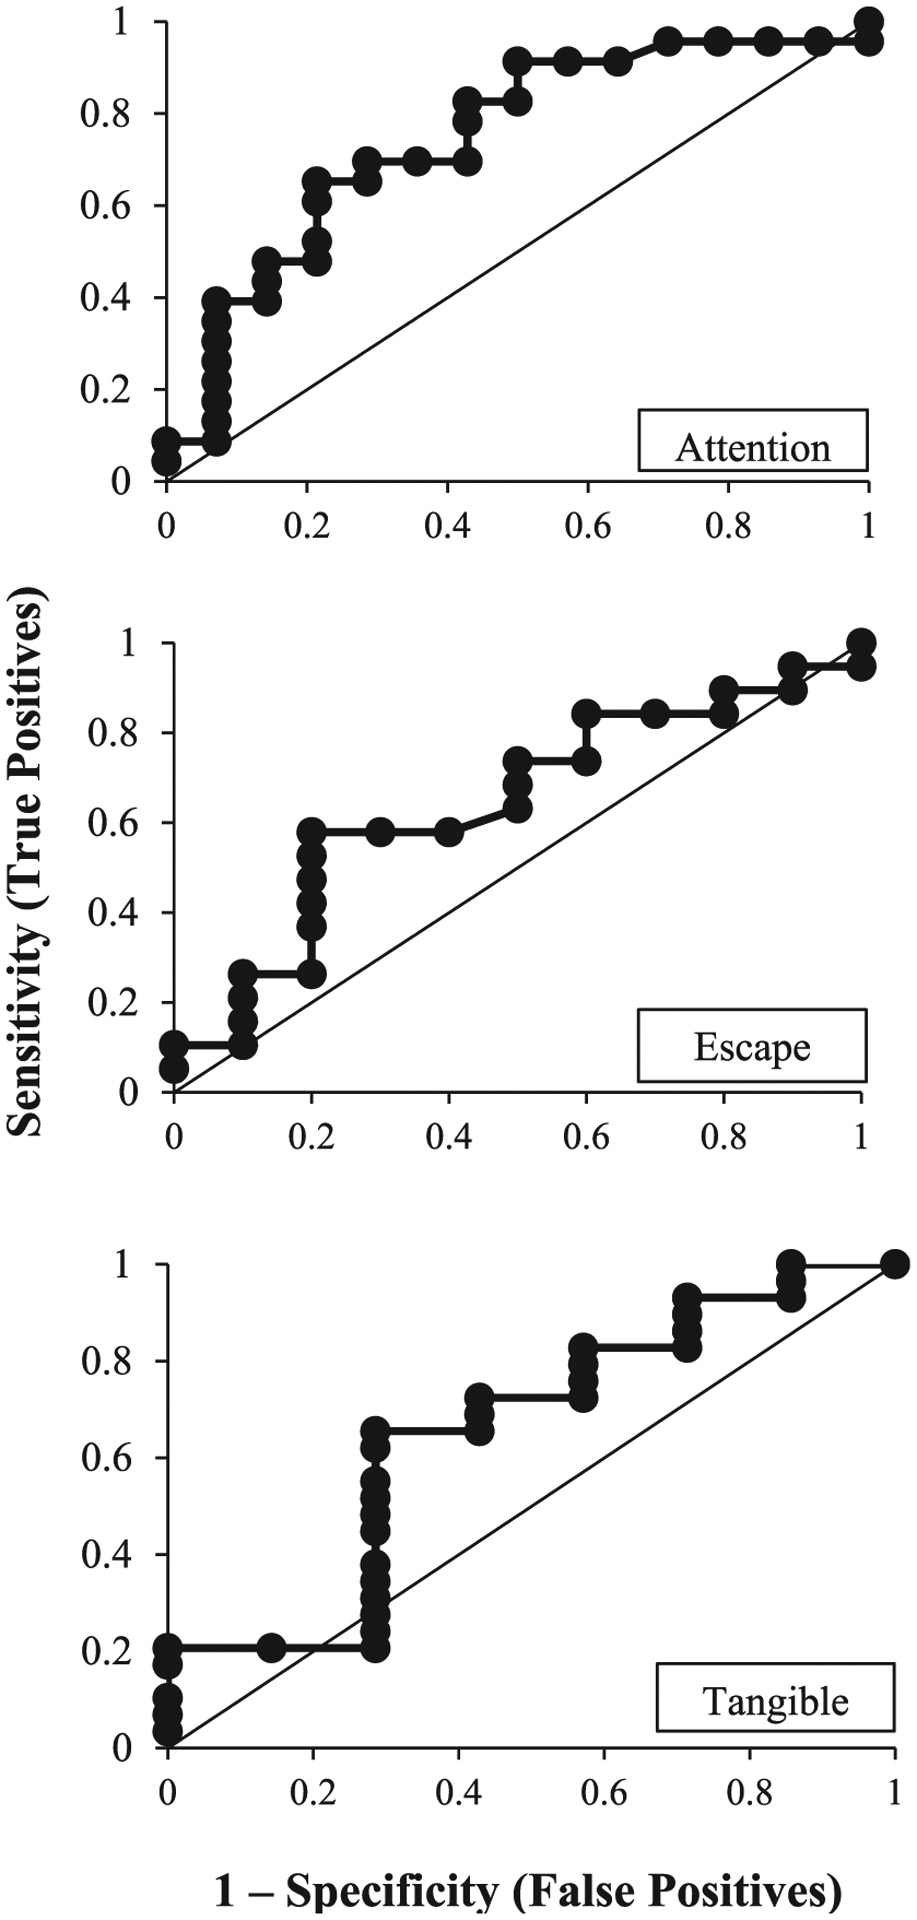
ROC Curves for Rate of Problem Behavior in Functional Analyses and Treatment Outcomes
For attention-maintained problem behavior the optimal cutoff point—where the sensitivity and specificity were balanced—was obtained when the value of the predictor (rate of problem behavior) was 1.94. At that optimal cutoff value, the AUC (the two-dimensional area under the curve which can range from 0 to 1) was 0.76, meaning that 76% of participants with attention-maintained problem behavior were accurately classified as either responders or nonresponders to FCT with extinction, using the empirically derived cutoff score of 1.94 responses per minute. This cutoff score is illustrated in Figure 2 (top panel), which depicts each participant’s data as a coordinate of the relation between mean FA test rate and percentage reduction with treatment with FCT and extinction. Using the ROC-obtained cutoff score of 1.94, the associated PPV and NPV values were 0.75 and 0.78, respectively (see Table 4). These values represent the percentage of cases that had a positive or negative response to treatment based on whether they met or did not meet the cutoff (1.94 responses per minute in the attention condition of the functional analysis). Thus, 75% of individuals who met or exceeded the cutoff of 1.94 had a positive response to FCT (PPV). Additionally, 78% of individuals who did not meet the cutoff did not have a favorable response to FCT (NPV)—thus, only 22% had a favorable response when the rate of problem behavior was lower than 1.94 per minute in the FA test condition. Twenty-three of the 37 applications of FCT with extinction produced at least an 80% reduction in attention-maintained problem behavior, indicating the base rate (or unconditional probability) of a positive response was 0.62 (i.e., 62% of cases); therefore, the base rate of a negative response was 0.38. As noted, the base rate of a positive response to treatment must be considered when interpreting the predictive utility of any predictor. The PPV of 0.75 exceeds the base rate of 0.62 for a positive response for attention-maintained problem behavior; the NPV of 0.78 greatly exceeds the base rate of a negative response (0.38). Figure 3 depicts the added predictive value above and beyond the base rates of positive and negative responses to FCT for each function of behavior that is provided by the obtained PPV and NPV values. This figure illustrates how the added predictive value provided by ROC curve-derived cutoffs for rate of problem behavior is greater for attention-maintained behavior relative to other functions; and includes comparable results from Hagopian et al. (2018) on automatically maintained problem behavior as a basis for comparison.
Figure 2.
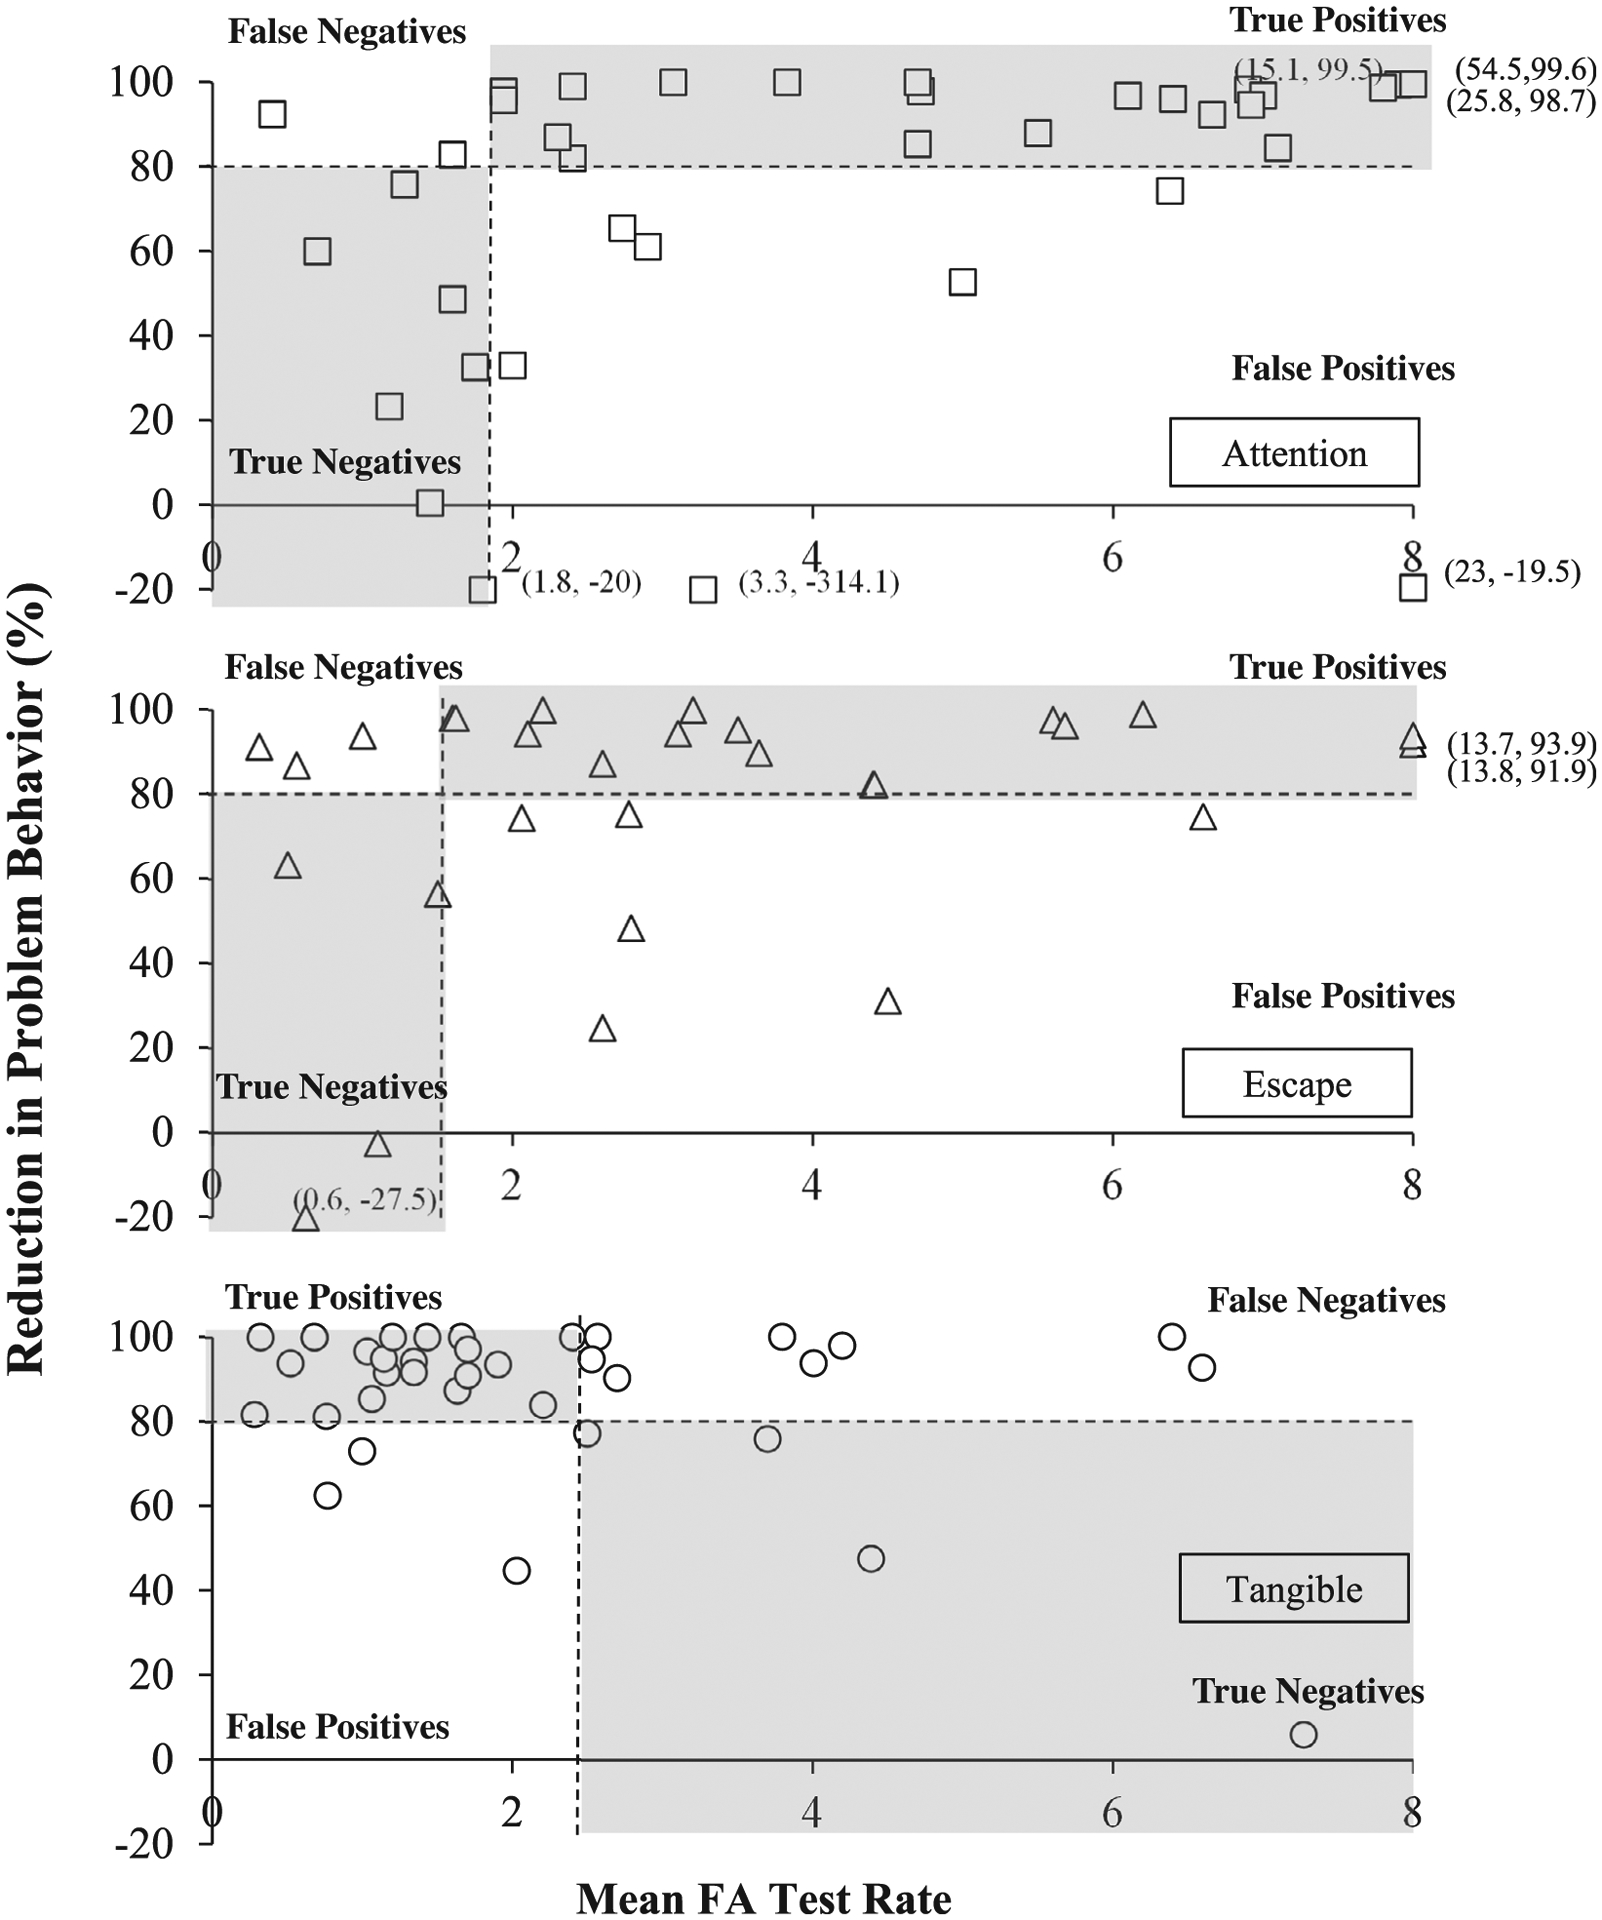
Relation between Problem Behavior Rate and Response to Treatment During FCT
Table 4.
ROC Identified Cutoff for FA Response Rate and Treatment Outcomes by Function
| Function | n | ROC Cutoff | Responder | Non-responder | P(Resp) | PPV | NPV | AUC |
|---|---|---|---|---|---|---|---|---|
| Attention | 28 | ≥ 1.94 | 21 | 7 | 0.62 | 0.75 | n/a | 0.76 |
| 9 | <1.94 | 2 | 7 | n/a | 0.78 | |||
| Escape | 22 | ≥ 1.60 | 16 | 6 | 0.65 | 0.73 | n/a | 0.69 |
| 7 | < 1.60 | 3 | 4 | n/a | 0.57 | |||
| Tangible | 12 | > 2.4 | 8 | 4 | 0.81 | n/a | 0.33 | 0.69 |
| 24 | ≤ 2.4 | 21 | 3 | 0.88 | n/a |
Note. The direction of the predictor variable and identified cutoff differs for tangible functions, as lower response rates (as opposed to higher rates) are more predictive of response to treatment.
P(Resp) = unconditional probability for response to treatment (i.e., base rate); PPV = positive predicted value; NPV = negative predicted value; AUC = area under the curve
Figure 3. Added Predictive Value for Response to FCT from the ROC-Derived Cutoffs.
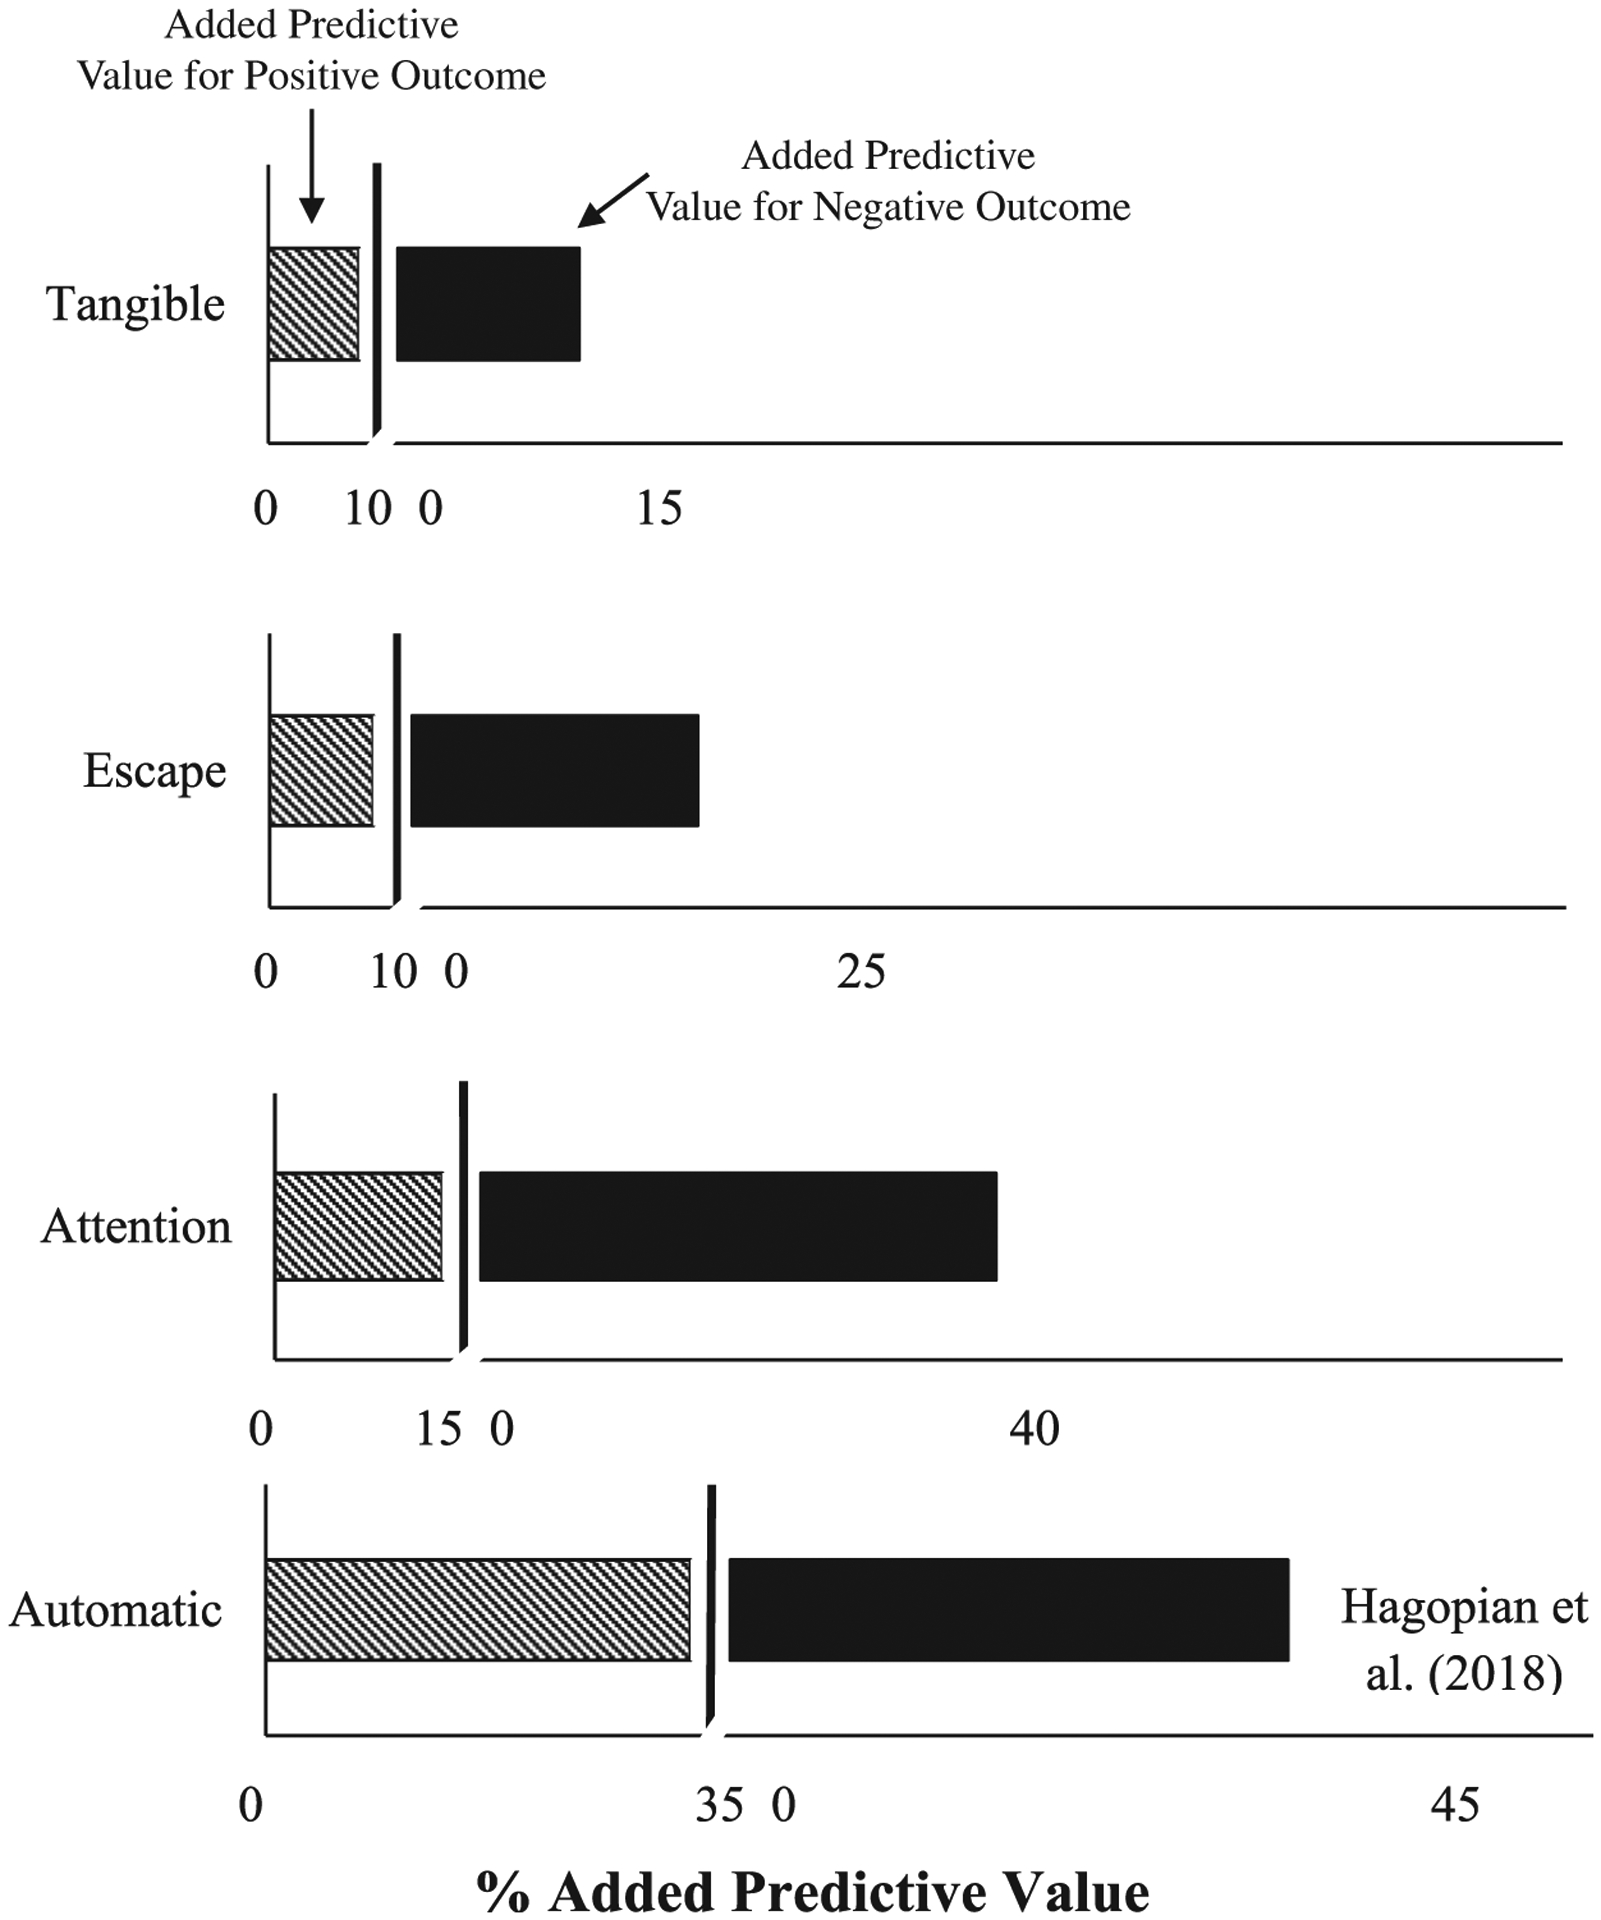
Note. Data for response to treatment with reinforcement alone for individuals with automatically maintained behavior from Hagopian et al. (2018) are provided as a comparison (bottom panel).
The AUC for rate of problem behavior during the FA attention condition was 0.76, which is generally regarded as representing acceptable discrimination between responders and nonresponders (Hagopian et al., 2018; Rice & Harris, 2005). In contrast, the AUC values for escape (0.69) and tangible (0.69) did not reach the minimum level of 0.70 (see Table 4). Though the difference in AUC values for attention, escape, and tangible may seem comparable, careful review of the all the results reveal larger differences. In contrast to attention-maintained behavior for which both PPV and NPV values were high, either one or the other (but not both) were high for problem behavior maintained by escape or access to tangibles. Nor did PPV markedly exceed the unconditional probability for positive response to treatment (Table 4; Figure 3). That is, for escape-maintained problem behavior, PPV was only slightly higher than the base rate of a positive response (0.73 vs. 0.65, respectively). For tangible-maintained problem behavior, PPV was only slightly higher than the base rate of a positive response (0.88 vs. 0.80).
Unlike response rate patterns observed with problem behavior maintained by attention or escape, higher response rates in the tangible FA condition tended to be associated with worse treatment outcomes relative to lower response rates in the FA. That is, responders for FCT with extinction with tangible-maintained behavior trended toward having lower average rates of problem behavior relative to nonresponders. Thus, even when the direction of the predictor variable was subsequently reversed (assuming lower response rates predicted positive treatment outcomes) it was still not a useful predictor variable (Table 4).
These findings indicate that, for this sample, the rate of problem behavior in the FA attention condition has predictive utility that is potentially clinically meaningful for individuals with attention-maintained problem behavior. That is, 75% of individuals whose rate of problem behavior during the attention condition met/exceeded the cutoff of 1.94 responses per minute would have responded favorably to treatment using FCT with extinction (which exceeded the base rate of 62% for a positive response to treatment for attention-maintained behavior with FCT and extinction). To the extent that the samples described in these three studies, and application of FCT for these 37 cases with attention-maintained behavior are more broadly representative, one could make predictions about what outcomes would likely be achieved with others under similar circumstances. Those predictions could be tested in a subsequent study, which would be essential before applying these findings to practice (see Hagopian et al., 2018 for a summary of how one would conduct a prospective study to further test and validate a PBM). Consistent with outcomes from all ROC analyses,3 results from a two-tailed Mann–Whitney U test indicate that the difference in problem behavior rate between responders and nonresponders (U = 82.5, p = .014) was statistically above chance for attention-maintained problem behavior. In contrast, the difference in problem behavior rate between responders and nonresponders was not statistically above chance for individuals with escape-maintained (p = .23) or tangible-maintained (p = .29) problem behavior.
Discussion
Although the results of the current study show that the rate of problem behavior in the attention condition distinguished responders from nonresponders to FCT with a moderate degree of accuracy, additional research is needed to replicate and further examine this relation and its generality. At this point, it would be pre-mature to suggest the current findings should guide clinical practice in any way. Findings of the current study may have more direct implications for future research on identifying variables that predict response to FCT and more broadly regarding continued application and refinement of methods for the identification of variables that predict response to treatment.
One explanation for why rate of behavior in the test condition of the FA predicted response to FCT for the attention function but not for escape or tangible functions may involve the relative differences in the duration of reinforcement for problem behavior. Generally, attention is provided for brief intervals contingent upon problem behavior during FA attention conditions, whereas escape and access to tangible items are generally provided for a period of 30 s (e.g., Iwata & Dozier, 2008). As a result, it is possible that problem behavior may be rate-limited within these escape and tangible conditions (assuming that responding occurs primarily when the MO is present). If rate of problem behavior in the differentiated FA condition reflects response strength, it is possible that the extended reinforcer delivery (30 s) in the tangible and escape conditions decreases the MO (and commensurate response strength) relative to abbreviated reinforcer delivery. Notably, the distribution of response rates in the escape condition varied widely (Figure 2). Moreover, the average FA test rate in most applications for FCT with extinction for tangible-maintained problem behavior was less than two responses per minute (Figure 2, bottom panel). Thus, there is no indication of particularly “efficient” responding or other consistent response patterns within many of the applications across either escape or tangible FA conditions. Additionally, the direction of the relation between rate of problem behavior and response to treatment is reversed between applications with escape and tangible functions. Hypothetically, even if problem behavior was rate-limited or otherwise affected by the relatively longer reinforcement intervals, there is still no apparent reason why higher rates of problem behavior in the FA would be associated with an increased probability of a positive response to treatment for individuals with escape functions but not tangible functions.
The negative relation between rate of problem behavior and response to treatment observed with problem maintained by tangibles, and the positive relation with problem behavior maintained by escape, could suggest that the outcomes obtained with attention-maintained problem behavior are not necessarily attributable to differences in FA reinforcement parameters across conditions. Additionally, unlike responders with attention-maintained and escape-maintained problem behavior, response rates for a large majority of responders fell between 0 – 2 responses per minute within the FA tangible condition. However, it is unclear why these function-specific differences emerged (i.e., why rate of problem behavior was a predictor for attention-maintained problem behavior but not for problem behavior maintained by access to tangibles or escape).
Emerging Methodological and Conceptual Issues
Base Rate of a Positive Response to Treatment
As has been discussed, positive predictive value (PPV) represents the conditional probability of a positive response to treatment given an individual “testing positive” (i.e., meeting the empirically derived cutoff of the predictor). PPV must be interpreted in relation to the base rate of a positive response to treatment (the unconditional probability of a positive response). In the current study, we saw differences in the base rate of a positive response to treatment across functions (62%, 65%, and 81% for attention, escape, and tangible, respectively). The same logic holds true for NPV, which is the probability of a negative response to treatment given “testing negative” for the PBM. NPV must be viewed in the context of base rate of a negative response. For only the attention condition did PPV and NPV markedly exceed the base rates of both a positive and negative response (see Figure 3); therefore, despite similar AUC values across all functions, response rate was a reliable predictor for attention-maintained behavior.
High base rates of a positive response were less of an issue in Hagopian et al. (2018), where the base rate for effective treatment for automatically maintained SIB was relatively low (54.1%). The obtained PPV of LOD in the FA was 85.7%; the PPV of Subtype 1 was 82.6%, which greatly exceeded the underlying base rate of 54.1%. However, if the base rate had been, for example 80% in Hagopian et al., then the obtained PPV value of 82.6% would not have added much predictive value.
Both PPV and NPV are derived from Bayes’ theorem:
in which the prevalence of the outcome (i.e., response to treatment [A]) directly moderates PPV and NPV, such that PPV increases and NPV decreases as prevalence increases. In other words, candidate predictors may have the illusory appearance of being useful distinguishers between responders and nonresponders if the prevalence of responders within the sample is generally high (i.e., high base rate of a positive response); therefore, this must be taken into consideration when interpreting the findings (Robinson et al., 2016).
The Importance of Identifying Causal and Treatment-Action Pathways
Determining whether the variable of interest participates in the causal or treatment-action pathways (i.e., is a PBM), or is a correlate or moderator variable that is not part of those pathways (i.e., is a predictor variable) is a different endeavor than quantifying its predictive accuracy. Why making this distinction is important has been mentioned above and is discussed further below, followed by a discussion of how one might go about distinguishing PBMs from predictor variables, which is far more complex. Undertaking efforts to identify the mechanisms responsible for controlling and changing behavior (i.e., the causal and treatment-action pathways) is what distinguishes the conceptually systematic and informed approach that is the hallmark of applied behavior analysis from the purely technological approach of behavior modification. Although many interventions can change behavior independent of knowledge of the causal pathway (powerful contingencies, antecedent interventions, and sedating medications), targeted interventions that directly act on the causal pathway are likely to produce more meaningful and sustainable change. The examination and explication of mechanisms which are functionally related to the causal pathways of behavioral dysfunction and treatment-action pathways of interventions are activities consistent with the objectives and values of behavior analysis since its inception. As our understanding of the causal and treatment-action pathways becomes more complete, we move toward the goal of prediction and control (Skinner, 1953). True prediction and control in the applied realm, where we seek to produce therapeutic outcomes, requires that we (a) identify the controlling variables of behavior (i.e., the causal pathways), and (b) alter those variables (which also requires knowledge of the treatment-action pathways).
How One Might Distinguish Between PBMs and Predictor Variables
After successfully showing a variable is an accurate predictor quantitatively, one must seek to establish a conceptual and empirical basis for whether that variable is or is not part of the causal or treatment-action pathways. One can work toward this goal through direct or systematic replication focused on demonstrating generality of process, meaning providing evidence that the functional relation of interest (the relation between the predictor and treatment outcome) is present across a variety of analytic methods and targets. The current study focused on examining the predictive utility of the rate of problem behavior (in the relevant differentiated test condition of the FA) for response to FCT; results indicated that the predictive value was function-specific (for problem behavior maintained by attention, but not by access to tangibles or escape from demands). We have suggested that the rate of problem behavior may reflect the strength of the MO, providing a conceptual basis for this relation. But why this relation is unique to attention-maintained problem behavior is not clear. The fact that it does not have generality to problem behavior maintained by escape or tangibles raises questions about whether it is directly related to the causal or treatment-action pathways. It is possible that response rate of attention-maintained problem behavior is not directly related to these pathways, or that it is merely an artefact of session reinforcement-parameter differences across conditions of the functional analysis. In light of this uncertainty, response rate in the attention condition should be referred to as a predictor variable for response to FCT rather than as a PBM for the time being.
To establish a base of empirical support that response rate of attention-maintained behavior is a PBM (rather than a predictor variable), additional studies would need to be conducted. First, it would be important to show this relation remains even when reinforcement duration across attention, tangible, and escape conditions is equivalent; this would rule out the possibility that the findings are an artefact of reinforcement duration differences across FA conditions. Second, demonstrating that the rate of the functional communication response during FCT also predicts response to treatment for attention-maintained problem behavior—but not for tangible-maintained, escape-maintained, or multiply-maintained behavior—would lend support to the strength of the MO hypothesis and its specificity to attention-maintained behavior. Another source of support would be obtained if one could demonstrate that rate of problem behavior exclusively predicts response to treatment for attention-maintained problem behavior with FCT is true for other interventions (such as noncontingent reinforcement). Future researchers might also correct for reinforcer consumption time across FA conditions to make these session parameters more comparable. Emergence of similar outcomes across such studies would demonstrate generality of the finding that the link between rate of problem behavior and response to treatment is exclusive to attention-maintained problem behavior (i.e., generality of process).
An Uncertain Path That May Become Clear Along the Way
Given the nature of the distinction between PBMs and predictor variables, the status of PBMs and predictor variables are implicitly provisional and always subject to revision based on new findings. As has been seen with PBioMs, the status of variables can change as our understanding of their role in the causal or treatment-action pathways changes (Aronson, 2005; Strimbu & Tavel, 2010). The criteria for what constitutes a “biomarker,” or what biological signs are considered biomarkers, may shift along a continuum of evidence ranging from biological signs directly tied to the disease mechanisms (e.g., hypermethelation of a specific gene) to more distal biological indicators that are potentially related to the causal pathway of the disease.
As discussed, it is not always immediately clear whether a variable that predicts response to treatment does so because of its direct involvement in the causal or treatment-action pathways or is merely a correlate to them. Identifying variables that predict response to treatment is a complex undertaking requiring some understanding of how an intervention (which often involves multiple components and mechanisms) interacts with an existing behavioral repertoire that itself has multiple controlling variables (and a history that can only be inferred). In contrast to studies where definitive outcomes are observed and replicated, efforts undertaken to identify and distinguish PBMs from predictor variables may not produce findings that are as definitive as to which we are accustomed (see Hayes, 2001). Conducting research to ask these types of experimental questions requires we extend our methods toward identifying functional relations between predictors and outcomes that have generality across cases (see Hagopian, 2020). These added complexities and approximations will bring uncertainties that require continued inquiry to clarify findings. This iterative process where answers beget new questions, and new knowledge clarifies or corrects old thinking, mirrors what has been occurring with precision medicine. Historically, the field of psychology (James, 1907), and behavior analysis in particular (e.g., Baum, 2004; Zuriff, 1985) has tended to embrace such iterations and approximations while recognizing the provisional status of many psychological and behavioral phenomena.
Indeed, William James (1907) entertained this idea over 100 years ago:
The most violent revolutions in an individual’s beliefs leave most of his old order standing. Time and space, cause and effect, nature and history, and one’s own biography remain untouched. New truth is always a go-between, a smoother-over of transitions. It marries old opinion to new fact so as ever to show a minimum of jolt, a maximum of continuity. We hold a theory true just in proportion to its success in solving this ‘problem of maxima and minima.’ But success in solving this problem is eminently a matter of approximation. We say this theory solves it on the whole more satisfactorily than that theory; but that means more satisfactorily to ourselves, and individuals will emphasize their points of satisfaction differently. To a certain degree, therefore, everything here is plastic.
(p. 31)
Acknowledgments
The authors wish to acknowledge Michael Kranak, Jennifer Vetter, and Lynn Bowman for their helpful comments during preparation of this manuscript.
Manuscript preparation was supported by Grant 2R01HD076653 from the Eunice K. Shriver National Institute of Child Health and Human Development (NICHD), and U54 HD079123 from the Intellectual and Developmental Disabilities Research Centers (IDDRC). Its contents are solely the responsibility of the authors and do not necessarily represent the official views of NICHD or IDDRC.
Footnotes
Such measures of efficacy are meant only for the purpose of capturing the primary dimension of behavior change and are not intended to reflect broader changes in quality of life – those dimensions of treatment outcomes require additional measures.
The ROC curve graphically plots specificity and the inverse of sensitivity (1-sensitivity) to facilitate visual interpretation.
Supplemental analyses, which obtained estimates for fitted ROC curves using maximum likelihood estimation (e.g., Park et al., 2004), also yielded AUC values similar to those obtained using the empirical ROC method described above (Eng, n.d.)
REFERENCES
- Aronson JK (2005). Biomarkers and surrogate end-points. British Journal of Clinical Pharmacology, 59(5), 491–494. 10.1111/j.1365-2125.2005.02435.x. [DOI] [PMC free article] [PubMed] [Google Scholar]
- Baum WM (2004). Understanding behaviorism: Behavior, culture, and evolution (2nd ed.). John Wiley & Sons. [Google Scholar]
- Brown KA, Wacker DP, Derby KM, Peck SM, Richman DM, Sasso GM, … Harding JW (2000). Evaluating the effects of functional communication training in the presence and absence of establishing operations. Journal of Applied Behavior Analysis, 33(1), 53–71. 10.1901/jaba.2000.33-53. [DOI] [PMC free article] [PubMed] [Google Scholar]
- Call NA, Clark SB, Mevers JL, Parks NA, Volkert VM, & Scheithauer MC (2018). An individualized method for establishing and thinning multiple schedules of reinforcement following functional communication training. Learning and Motivation, 62, 91–102. 10.1016/j.lmot.2017.03.006. [DOI] [Google Scholar]
- Carr EG, & Durand VM (1985). Reducing behavior problems through functional communication training. Journal of Applied Behavior Analysis, 18(1), 111–126. 10.1901/jaba.1985.18-111. [DOI] [PMC free article] [PubMed] [Google Scholar]
- Carser JE, Quinn JE, Michie CO, O’Brien EJ, McCluggage WG, Maxwell P, … Harkin P (2011). BRCA1 is both a prognostic and predictive biomarker of response to chemotherapy in sporadic epithelial ovarian cancer. Gynecologic Oncology, 123 (3), 492–498. [DOI] [PubMed] [Google Scholar]
- Didden R, Korzilius H, van Oorsouw W, & Sturmey P (2006). Behavioral treatment of challenging behaviors in individuals with mild mental retardation: Meta-analysis of single-subject research. American Journal on Mental Retardation, 111(4), 290–298. 10.1352/0895-8017(2006)111[290:BTOCBI]2.0.CO;2. [DOI] [PubMed] [Google Scholar]
- Eng, J. (n.d.). ROC analysis: web-based calculator for ROC curves. Retrieved from http://www.jrocfit.org.
- Goldenberg MM (2012). Multiple sclerosis review. Pharmacy and Therapeutics, 37(3), 175–184. 10.1111/jcp.2012.37.issue-3. [DOI] [PMC free article] [PubMed] [Google Scholar]
- Greer RD (2002). Designing teaching strategies: An applied behavior analysis systems approach. Elsevier. [DOI] [PMC free article] [PubMed] [Google Scholar]
- Greer RD (2020). The selector in behavior selection. The Psychological Record. Advance online publication. 10.1007/s40732-020-00385-3 [DOI] [Google Scholar]
- Greer BD, Fisher WW, Saini V, Owen TM, & Jones JK (2016). Functional communication training during reinforcement schedule thinning: An analysis of 25 applications. Journal of Applied Behavior Analysis, 49(1), 105–121. 10.1002/jaba.265. [DOI] [PMC free article] [PubMed] [Google Scholar]
- Hagopian LP (2020). The consecutive controlled case series: Design, data-analytics, and reporting methods supporting the study of generality. Journal of Applied Behavior Analysis, 53(2), 596–619. 10.1002/jaba.691. [DOI] [PMC free article] [PubMed] [Google Scholar]
- Hagopian LP, Boelter EW, & Jarmolowicz DP (2011). Reinforcement schedule thinning following functional communication training: Review and recommendations. Behavior Analysis in Practice, 4(1), 4–16. 10.1007/BF03391770. [DOI] [PMC free article] [PubMed] [Google Scholar]
- Hagopian LP, Fisher WW, Sullivan MT, Acquisto J, & LeBlanc LA (1998). Effectiveness of functional communication training with and without extinction and punishment: A summary of 21 inpatient cases. Journal of Applied Behavior Analysis, 31(2), 211–235. 10.1901/jaba.1998.31-211. [DOI] [PMC free article] [PubMed] [Google Scholar]
- Hagopian LP, Rooker GW, & Yenokyan G (2018). Identifying predictive behavioral markers: A demonstration using automatically reinforced self-injurious behavior. Journal of Applied Behavior Analysis, 51(3), 443–465. 10.1002/jaba.477. [DOI] [PMC free article] [PubMed] [Google Scholar]
- Hayes SC (2001). The greatest dangers facing behavior analysis today. The Behavior Analyst Today, 2(2), 61–63. 10.1037/h0099914. [DOI] [Google Scholar]
- Hill AB (1965). The environment and disease: Association or causation? Proceedings from the Royal Society of Medicine, 58(1), 295–300. 10.1177/003591576505800503. [DOI] [PMC free article] [PubMed] [Google Scholar]
- Iwata BA, & Dozier CL (2008). Clinical application of functional analysis methodology. Behavior Analysis in Practice, 1(1), 3–9. 10.1007/BF03391714. [DOI] [PMC free article] [PubMed] [Google Scholar]
- James W (1907). Pragmatism and other writings. Penguin Press. [Google Scholar]
- Keohane DD, Luke N, & Greer RD (2008). The things we care to see: The effects of rotated protocol immersion on the emergence of early observing responses. Journal of Early and Intensive Behavior Intervention, 5(1), 23–29. 10.1037/h0100408. [DOI] [Google Scholar]
- Kompel AJ, Roemer FW, Murakami AM, Diaz LE, Crema MD, & Guermazi A (2019). Intra-articular corticosteroid injections in the hip and knee: Perhaps not as safe as we thought? Radiology, 293(3), 656–663. 10.1148/radiol.2019190341. [DOI] [PubMed] [Google Scholar]
- La Thangue NB, & Kerr DJ (2011). Predictive biomarkers: A paradigm shift towards personalized cancer medicine. Nature Reviews Clinical Oncology, 8 (10), 587–596. 10.1038/nrclinonc.2011.121. [DOI] [PubMed] [Google Scholar]
- Lotfizadeh AD, Edwards TL, Redner R, & Poling A (2012). Motivating operations affect stimulus control: A largely overlooked phenomenon in discrimination learning. The Behavior Analyst, 35(1), 89–100. 10.1007/BF03392268. [DOI] [PMC free article] [PubMed] [Google Scholar]
- Mace FC (1994). The significance and future of functional analysis methodologies. Journal of Applied Behavior Analysis, 27(2), 385–392. 10.1901/jaba.1994.27-385. [DOI] [PMC free article] [PubMed] [Google Scholar]
- Mann HB, & Whitney DR (1947). On a test of whether one of two random variables is stochastically larger than the other. The Annals of Mathematical Statistics, 18, 50–60. 10.1214/aoms/1177730491. [DOI] [Google Scholar]
- Mason SJ, & Graham NE (2002). Areas beneath the relative operating characteristics (ROC) and relative operating levels (ROL) curves: Statistical significance and interpretation. Quarterly Journal of the Royal Meteorological Society, 128(584), 2145–2166. 10.1256/003590002320603584. [DOI] [Google Scholar]
- Park SH, Goo JM, & Jo CH (2004). Receiver operating characteristic (ROC) curve: Practical review for radiologists. Korean Journal of Radiology, 5(1), 11–18. https://doi.org/.3348/kjr.2004.5.1.11 [DOI] [PMC free article] [PubMed] [Google Scholar]
- Rice ME, & Harris GT (2005). Comparing effect sizes in follow-up studies: ROC Area, Cohen’s d, and r. Law and Human Behavior, 29(5), 615–620. 10.1007/s10979-005-6832-7. [DOI] [PubMed] [Google Scholar]
- Roane HS, Fisher WW, Sgro GM, Falcomata TS, & Pabico RR (2004). An alternative method of thinning reinforcer delivery during differential reinforcement. Journal of Applied Behavior Analysis, 37(2), 213–218. 10.1901/jaba.2004.37-213. [DOI] [PMC free article] [PubMed] [Google Scholar]
- Robinson M, Boissoneault J, Sevel L, Letzen J, & Staud R (2016). The effect of base rate on the predictive value of brain biomarkers. The Journal of Pain, 17(6), 637–641. 10.1016/j.jpain.2016.01.476. [DOI] [PMC free article] [PubMed] [Google Scholar]
- Rooker GW, Jessel J, Kurtz PF, & Hagopian LP (2013). Functional communication training with and without alternative reinforcement and punishment: An analysis of 58 applications. Journal of Applied Behavior Analysis, 46(4), 708–722. 10.1002/jaba.76. [DOI] [PubMed] [Google Scholar]
- Skinner BF (1953). Science and human behavior. Free Press. [Google Scholar]
- Strimbu K, & Tavel JA (2010). What are biomarkers? Current Opinion in HIV and AIDS, 5(6), 463–466. 10.1097/COH.0b013e32833ed177. [DOI] [PMC free article] [PubMed] [Google Scholar]
- Ventola CL (2013). Role of pharmacogenomic biomarkers in predicting and improving drug response: The clinical significance of pharmacogenetic variants. Pharmacy and Therapeutics, 38(9), 545–551. Retrieved from. https://www.ncbi.nlm.nih.gov/pmc/articles/PMC382893. [PMC free article] [PubMed] [Google Scholar]
- Zuriff GE (1985). Behaviorism: A conceptual reconstruction. Columbia University Press. [Google Scholar]