

Abstract
The objectives of this study were to construct a risk score for predicting incident hypertension by using the Korean Genome and Epidemiology Study (KoGES) data and to compare the performance between KoGES and the Framingham model. A total of 4747 participants were analyzed. The entire cohort was randomly assigned to derivation and validation sets at a ratio of 6:4. A hypertension risk score was developed based on the derivation cohort, using the same risk factors that were used for developing the Framingham hypertension risk score. The accuracy of KoGES and Framingham models was evaluated in terms of calibration and discrimination. The area under receiver operating characteristic (AROC) curves were 0.789 for the Framingham model and 0.791 for the KoGES model. The AROC calculated for the point‐based risk score was 0.790, which is almost identical to that for the KoGES model. The Framingham model showed poor agreement (χ2=29.73, P=.0002) and underestimated the risk of hypertension in most deciles of predicted risk. The model based on KoGES yielded results similar to the observed risk of hypertension (χ2=4.17, P=.8415). This study demonstrates that the Framingham risk score based on data from a non‐Korean population can lead to the underestimation of the prediction risk of hypertension.
Hypertension is a major public health problem and a major cause of mortality and morbidity. It is also one of the major risk factors for cardiovascular and kidney disease.1, 2, 3 Although no direct cause has been identified, many factors such as a sedentary lifestyle, smoking, visceral obesity, potassium deficiency, general obesity, and alcohol intake increase the risk of developing hypertension.4, 5, 6, 7 The cost of treating hypertension and its complications is a major problem, especially in developing and industrialized countries. Therefore the top priority for public health and welfare authorities in these countries is to identify individuals who need to receive help via intensive lifestyle modification or primary pharmacologic therapy. For this reason, several physicians and investigators have developed, or validated, risk scores that predict the incidence of hypertension based on prospective large cohort studies such as the Framingham Heart Study (FHS),8 the Whitehall II Study,9 the Multi‐Ethnic Study of Atherosclerosis (MESA),10 Women's Health Study (WHS),11 the Atherosclerosis Risk in Communities (ARIC) study and the Cardiovascular Health Study (CHS),12 and the Chin‐Shan Community Cardiovascular Cohort study.13 Of these, the Framingham hypertension risk score is widely used to predict the risk for near‐term incident hypertension and has been externally validated using other large cohorts. However, most of the validation cohorts used were Caucasian, with few Asian populations. Several reports suggest that certain prediction models developed using specific ethnic groups tend to overestimate or underestimate the incidence in other ethnic groups.14
Therefore, the aim of this study was to develop a simple risk score for predicting the development of incident hypertension in a Korean population using data from the Korea Genome and Epidemiology Study (KoGES) and to compare this model with the Framingham risk model using a validation data set.
Materials and Methods
Study Participants and Design
KoGES is an ongoing community‐based cohort study that began in 2001 with the support of the Korean National Institute of Health. The study has been described in detail previously.15 Briefly, the cohort initially included 10,038 participants aged 40 to 69 years. A baseline examination was performed between 2001 and 2003 and follow‐up examinations are conducted biennially. Participants included residents of an industrialized area (Ansan) and a rural area (Ansung).
The current study was based on an examination of baseline and first and second follow‐up data (Figure 1). After the 4‐year follow‐up examination, 7260 participants were enrolled in the current study (2492 refused to participate in the follow‐up surveys and 286 died before completing the 2 follow‐up visits).
Figure 1.
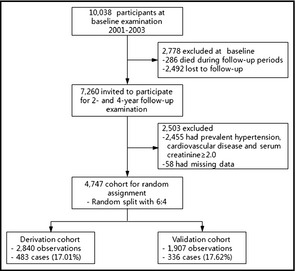
Study flow and participants at baseline and follow‐up.
In addition, 2233 participants with prevalent hypertension at baseline (taking antihypertensive medication, a systolic blood pressure [SBP] ≥140 mm Hg, or a diastolic blood pressure [DBP] ≥90 mm Hg) and 222 participants who reported prevalent cardiovascular disease or had a serum creatinine value >2 mg/dL were excluded. Complete data were not available for 58 patients; therefore, 4747 participants remained eligible for analysis (Figure 1). The study protocol was approved by the institutional review board of the Korea Centers for Disease Control and Prevention.
Measurements and Surveys
Anthropometric measurements were measured for each participant and blood was drawn for biochemistry tests. Participants received a questionnaire about their medical history and health behavior. The questionnaire collected demographic information, lifestyle information, and personal and familial medical histories, and assessed smoking status and alcohol consumption. “Current smoking” was defined as smoking at least 1 cigarette per day for at least a year. The participants were classified as nondrinkers, exdrinkers, and current drinkers. Body mass index (BMI) was calculated by dividing the weight in kilograms by the height in meters squared. Blood pressure was measured by trained technicians using mercury sphygmomanometers (Baumanometer‐Standby; W.A. Baum Co. Inc, New York, NY). SBP and DBP values were defined as the average of the left and right arm readings obtained in a seated position after a minimum 5 minutes of rest. Participants were considered to have hypertension if they had an SBP ≥140 mm Hg or a DBP ≥90 mm Hg, or reported the use of antihypertensive medication at baseline examination.
Statistical Analyses
We randomly split the entire KoGES cohort into derivation and validation cohorts at a ratio of 6:4. We developed a hypertension risk score based on the derivation cohort using the same risk factors that were used for developing the Framingham hypertension risk score. The Framingham hypertension risk score consists of components such as SBP, sex, parental history of hypertension, BMI, smoking status, and the interaction between DBP and age. These variables can be obtained without the need for biochemical tests. The interaction between DBP and age was considered because DBP shows a significant early rise and late fall pattern according to age in both normal and hypertensive patients.16
Weibull regression analysis was used to develop the risk prediction models because participants were examined for onset of hypertension only periodically.8, 17 Weibull regression analysis, which is one of the parametric survival models, is often used to fit the data when the event time of interest with censoring status follows the Weibull distribution and the interval‐censoring data are observed. We developed 1‐, 2‐, and 4‐year risk scores for predicting the probability of incident hypertension. The regression coefficients in the model were used to calculate a point value for a specific category of each risk factor. Finally, the hypertension risk score was calculated as the sum of these points. This risk score was related to the actual incidence rate of hypertension using a simple equation.18
We then tested the accuracy of the risk score models according to their calibration and discrimination ability using the validation cohort. To compare the discrimination ability of the models, the area under the receiver operating characteristic curves (AROCs) were obtained. The statistical difference between the AROC for the two models was tested using the method of DeLong and colleagues19 The goodness of fit test based on the Hosmer‐Lemeshow chi‐square statistics was used to assess calibration.20 The predicted probability of developing hypertension calculated from the Framingham model was divided into deciles and the observed and mean predicted probabilities for each model were calculated and compared. In particular, the predicted probability of incident hypertension was calculated using a recalibration of the Framingham model according to the method described by D'Agostino and colleagues.14
A two‐tailed P value <.05 was considered statistically significant. Statistical analyses were performed using SAS software (version 9.2; SAS Institute, Cary, NC).
Results
Hypertension and Prehypertension
Of the 4747 participants without hypertension at baseline, 819 (17.3%) developed hypertension during the 4‐year follow‐up. The study population comprised 2274 men and 2473 women. The cumulative incident rates for hypertension at first and second follow‐up were 11.0% and 17.3%, respectively. Table 1 shows the characteristics of the participants in the entire, derivation, and validation cohorts. The mean SBP and DBP of the entire cohort were 112.7±11.4 and 75.2±7.9 mm Hg, respectively, at baseline. The baseline characteristics of the derivation and validation cohorts were similar.
Table 1.
Baseline Characteristics of the Study Cohorts (Derivation and Validation Cohorts)
| Variables | Entire Cohort (n=4747) | Derivation Cohort (n=2840) | Validation Cohort (n=1907) |
|---|---|---|---|
| Age, mean (SD), y | 50.48 (8.44) | 50.42 (8.46) | 50.58 (8.42) |
| Female sex, % | 52.10 | 52.75 | 51.13 |
| Parental hypertension, % | 14.73 | 14.51 | 15.05 |
| Current smokers, % | 25.89 | 25.67 | 26.22 |
| BMI, mean (SD) | 24.16 (2.99) | 24.16 (3.02) | 24.17 (2.93) |
| Blood pressure, mean (SD), mm Hg | |||
| Systolic | 112.79 (11.38) | 112.73 (11.52) | 112.88 (11.16) |
| Diastolic | 75.18 (7.90) | 75.22 (7.92) | 75.12 (7.87) |
| Diabetes, % | 9.56 | 9.33 | 9.91 |
| Total cholesterol, mg/dL | 188.26 (33.91) | 188.22 (33.71) | 188.32 (34.23) |
| HDL cholesterol, mg/dL | 44.88 (9.87) | 44.99 (9.77) | 44.71 (10.01) |
| Fasting plasma glucose, mg/dL | 85.51 (18.78) | 85.43 (18.01) | 85.62 (19.88) |
| Hemoglobin A1C, % | 5.71 (0.83) | 5.70 (0.79) | 5.72 (0.89) |
| Triglyceride, mg/dL | 151.29 (94.73) | 152.19 (100.36) | 149.96 (85.69) |
| Serum creatinine, mg/dL | 0.99 (0.10) | 0.99 (0.10) | 0.99 (0.10) |
Abbreviations: BMI, body mass index (calculated as weight in kg/height m2); HDL, high‐density lipoprotein; SD, standard deviation.
Of the 4747 participants in the entire cohort, 2031 (42.8%) had prehypertension at the baseline examination. The relative risk (RR) of incident hypertension during the 4‐year follow‐up was 4.03 (95% confidence interval [CI], 3.48–4.67) when participants who had prehypertension were compared with those with normal blood pressure (SBP <120 mm Hg and DBP <80 mm Hg) at baseline.
Development of Risk Score Based on the Development Cohort Data
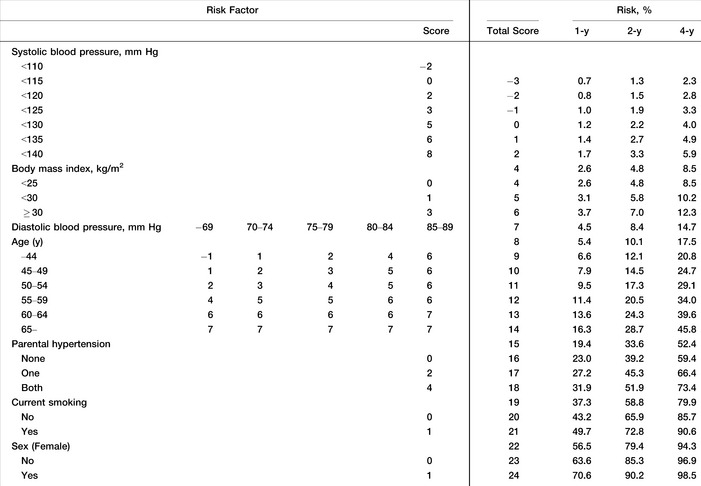
The derivation cohort from the KoGES was used to construct a new risk score that was compared with Framingham risk score. Table 2 shows the results of the Weibull multiple regression analysis for predicting the development of hypertension with the derivation cohort. In this model, all the variables taken from the Framingham risk score were statistically significant predictors of the risk for developing hypertension, with the exception of sex. The interaction terms between age and other risk factors were also tested, but only the interaction between age and DBP was significant. We constructed a simple points system using the coefficients derived from the Weibull model to predict the development of incident hypertension in a Korean population (Table 3). The 1‐, 2‐, and 4‐year point risk scores for predicting the development of incident hypertension are shown in Table 3. The risk of developing incident hypertension at 1, 2, and 4 years can be simply calculated by summing each score assigned to risk factor.
Table 2.
Multivariate‐Adjusted Hazard Ratios for Weibull Regression (Derivation Cohort: n = 2840)
| Variables | Model Using Framingham Risk Score's Variables | ||
|---|---|---|---|
| Coefficient (±SE) | Hazard Ratio (95% CI) | P Value | |
| Intercept | 30.355±4.088 | – | <.0001 |
| Age, y | −0.284±0.071 | 1.300 (1.143–1.479) | <.0001 |
| Female sex | −0.208±0.122 | 1.213 (0.971–1.514) | .0885 |
| Current smoker (vs nonsmoker) | −0.291±0.134 | 1.309 (1.027–1.669) | .0296 |
| SBP, per 1 mm Hg | −0.064±0.007 | 1.061 (1.048–1.075) | <.0001 |
| DBP, per 1 mm Hg | −0.203±0.050 | 1.207 (1.103–1.321) | <.0001 |
| Parental hypertension | −0.379±0.124 | 1.421 (1.134–1.780) | .0022 |
| Body mass index | −0.067±0.016 | 1.063 (1.033–1.095) | <.0001 |
| Age by DBP | 0.003±0.001 | 0.997 (0.995–0.999) | .0004 |
| Scale parameter | 1.080±0.055 | – | – |
| AUC (95% CI) | 0.7805 (0.7594–0.8017) | ||
| Hosmer‐Lemeshow (P value) | 10.28 (.3281) | ||
Abbreviations: AUC, area under the receiver operating characteristic curve; CI, confidence interval; DBP, diastolic blood pressure; SBP, systolic blood pressure; SE, standard error.
Table 3.
The Simple Point Score System for the Hypertension Prediction Model
Comparison Between the KoGES and Framingham Risk Scores Using the Validation Cohort
Figure 2 compares the AROC for the Framingham recalibrated, KoGES, and points‐based risk models, and shows that the AROCs were similar. The AROC for all of the prediction models indicated good discrimination ability and ranged from 0.779 to 0.791. The AROC for incident hypertension was 0.789 (95% CI, 0.764–0.815) for the Framingham risk model and 0.791 (95 CI, 0.766–0.817; P=.4272 compared with the Framingham model) for the KoGES risk model. The AROC for the points‐based risk score model was 0.790 (95% CI, 0.764–0.815), which was almost identical to that of the KoGES and Framingham risk models. Additionally, the AROC for prehypertension was 0.707 (95% CI, 0.68–0.73). The discrimination power of prehypertension for predicting incident hypertension was significantly lower than that of the Framingham and KoGES risk score models (P values <.0001 and <.0001, respectively).
Figure 2.
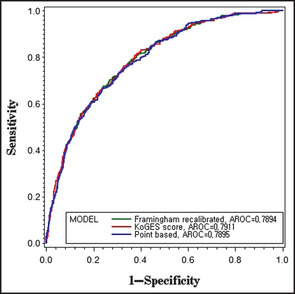
Receiver operating characteristic (ROC) curves for the Framingham recalibrated, Korean Genome and Epidemiology Study (KoGES), and point‐based models (validation cohort: n=2840). Framingham‐recalibrated model (green): area under ROC=0.79 (95% confidence interval [CI], 0.76–0.82), KoGES model (red): AROC=0.79 (95% CI, 0.77–0.82), and point‐based model (blue): AROC=0.79 (95% CI, 0.76–0.81).
Figure 3 shows the overall calibration between the observed and predicted risk for incident hypertension and contains the Hosmer‐Lameshow's chi‐square statistics evaluating the calibration of the models. For the Framingham recalibrated model, the chi‐square statistics were 29.73 (P=.0002), which indicate very poor agreement. The Framingham recalibrated model underestimated the risk of hypertension in most deciles of predicted risk, but the tendency was worse for the high‐risk deciles. The new model based on KoGES data was close to the observed risk of hypertension (χ2=4.17, P=.8415). The predicted risk calculated using the points‐based model was also similar to the observed risk (χ2=13.42, P=.0981).
Figure 3.
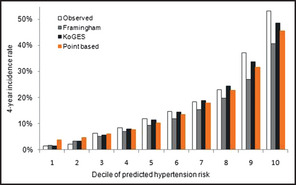
Comparison of the predicted risk of developing hypertension according to deciles for the Framingham risk score, Korean Genome and Epidemiology Study (KoGES), and point‐based risk score, and the observed risk (validation cohort: n=2840).
Discussion
Recent clinical trials indicate that suitable interventions such as lifestyle modification programs or medications are effective strategies for individuals with prehypertension.21, 22, 23 However, such intervention programs may incur high costs that place a burden on patients, their families, and the national health care system. For these reasons, appropriate tools for identifying patients who require intervention are required.
The Framingham risk model was developed to identify nonhypertensive patients who have an increased risk for developing incident hypertension in the near future and is based on a Caucasian population. The Framingham risk score improved the prediction of incident hypertension over that based on prehypertension status alone, and enabled better identification of nonhypertensive individuals at the greatest risk.9 The research from the Whitehall II study shows that the Framingham risk score is highly reproducible.9 However, the results from the MESA study show that the Framingham risk score can underestimate the risk of incident hypertension in some ethnic groups, and it should be corrected using a recalibration process, which involves replacing some of the parameters in the model.10 Because of ethnic differences, the risk score models must be validated in other populations or ethnic groups. In Asian countries, these risk score models for predicting incident hypertension have not been validated using general methods and Asian populations. Recently, a model for predicting the hypertension risk in a community‐based cohort of middle‐aged and elderly ethnic Chinese patients living in Taiwan was developed.13 The authors proposed two different types of risk score models: the first was a clinical model based on sex, age, BMI, SBP, and DBP. The other was a biochemical model and included white blood cell counts (WBCs) and fasting glucose and uric acid levels in addition to the parameters used for the clinical model. They showed that the interaction terms for age and DBP did not reach statistical significance. The authors also compared the discrimination and calibration ability of the John Hopkins model, the Framingham model, and the clinical and biochemical models using an ethnic Chinese cohort. The results showed that the calibration and discrimination ability of the Framingham risk score model was good.
The present study also validated the Framingham model for predicting incident hypertension in a large community cohort based on a Korean middle‐aged population. The results revealed that the Framingham model showed good discrimination ability for predicting the risk of developing hypertension (Table 3). However, as shown in Figure 3, the Framingham risk score tended to systematically underestimate the risk of developing incident hypertension in the Korean middle‐aged population, and showed poor agreement between the predicted probabilities and the actual observed risk, particularly in the high‐risk deciles (P=.0002). Unlike in other studies,9, 10, 13 this disagreement was not adjusted appropriately using the recalibration process. Physicians or health care professionals need a more accurate tool to assess whether potential patients have a high risk of developing incident hypertension. In that sense, the utility of risk scores based on other ethnic populations needs to be considered very carefully.
Strengths and Limitations
The strength of this study was the use of a large community‐based data set based on a middle‐aged population, which was derived from both urban and rural areas in Korea. However, there are several limitations. Primarily, the KoGES hypertension scores were derived and validated using only a Korean community‐based cohort and will, thus, only be applicable in the same clinical or epidemiological settings. Validation studies need to be conducted in other populations to justify its generalizability to the Korean population. Finally, we did not consider other risk factors that were not included in the Framingham risk score; for example, physical activity, dietary behavior, or drinking habits, which are associated with incident hypertension.
Conclusions
This study constructs a new risk score for predicting hypertension in a Korean population using data from the KoGES study and compares the risk score with the Framingham risk score. The result from this study shows that risk scores derived from other countries or ethnic groups can result in the overestimation or underestimation of the risk for incident hypertension. For this reason, we developed a risk score system based on a community‐based cohort from Korea.
Acknowledgments and disclosure
This work was performed under the Korea National Institute of Health intramural research grant 4800‐4845‐300‐210 (2010‐N63001‐00). There are no conflicts of interest to disclose.
Author contributions
N.K.L. researched data, contributed to discussion, and wrote the manuscript. K.H.S. and K.S.L. reviewed and edited the manuscript. M.C.C. reviewed and wrote the manuscript. H.Y.P. researched data, contributed to discussion, and wrote the manuscript.
J Clin Hypertens (Greenwich). 2013;15:344–349. ©2013 Wiley Periodicals, Inc.23614850
References
- 1. Lawes CM, Vander Hoorn S, Rodgers A. Global burden of blood‐pressure‐related disease, 2001. Lancet. 2008;371(9623 1513–1518. [DOI] [PubMed] [Google Scholar]
- 2. Chen J. Epidemiology of hypertension and chronic kidney disease in China. Curr Opin Nephrol Hypertens. 2010;19(3):278–282. [DOI] [PMC free article] [PubMed] [Google Scholar]
- 3. Gaziano TA, Bitton A, Anand S, Weinstein MC. The global cost of nonoptimal blood pressure. J Hypertens. 2009;27(7):1472–1477. [DOI] [PubMed] [Google Scholar]
- 4. Kyrou I, Chrousos GP, Tsigos C. Stress, visceral obesity, and metabolic complications. Ann N Y Acad Sci. 2006;1083:77–110. [DOI] [PubMed] [Google Scholar]
- 5. Wofford MR, Hall JE. Pathophysiology and treatment of obesity hypertension. Curr Pharm Des. 2004;10(29):3621–3637. [DOI] [PubMed] [Google Scholar]
- 6. Djousse L, Mukamal KJ. Alcohol consumption and risk of hypertension: does the type of beverage or drinking pattern matter? Rev Esp Cardiol. 2009;62(6):603–605. [DOI] [PubMed] [Google Scholar]
- 7. Haslam DW, James WP. Obesity. Lancet. 2005;366(9492):1197–1209. [DOI] [PubMed] [Google Scholar]
- 8. Parikh NI, Pencina MJ, Wang TJ, et al. A risk score for predicting near‐term incidence of hypertension: the Framingham Heart Study. Ann Intern Med. 2008;148(2):102–110. [DOI] [PubMed] [Google Scholar]
- 9. Kivimaki M, Batty GD, Singh‐Manoux A, et al. Validating the Framingham Hypertension Risk Score: results from the Whitehall II study. Hypertension. 2009;54(3):496–501. [DOI] [PMC free article] [PubMed] [Google Scholar]
- 10. Muntner P, Woodward M, Mann DM, et al. Comparison of the Framingham Heart Study hypertension model with blood pressure alone in the prediction of risk of hypertension: the Multi‐Ethnic Study of Atherosclerosis. Hypertension. 2010;55(6):1339–1345. [DOI] [PMC free article] [PubMed] [Google Scholar]
- 11. Paynter NP, Cook NR, Everett BM, et al. Prediction of incident hypertension risk in women with currently normal blood pressure. Am J Med. 2009;122(5):464–471. [DOI] [PMC free article] [PubMed] [Google Scholar]
- 12. Kshirsagar AV, Chiu YL, Bomback AS, et al. A hypertension risk score for middle‐aged and older adults. J Clin Hypertens. 2010;12(10):800–808. [DOI] [PMC free article] [PubMed] [Google Scholar]
- 13. Chien KL, Hsu HC, Su TC, et al. Prediction models for the risk of new‐onset hypertension in ethnic Chinese in Taiwan. J Hum Hypertens. 2011;25(5):294–303. [DOI] [PubMed] [Google Scholar]
- 14. D'Agostino RB Sr, Grundy S, Sullivan LM, Wilson P. Validation of the Framingham coronary heart disease prediction scores: results of a multiple ethnic groups investigation. JAMA. 2001;286(2):180–187. [DOI] [PubMed] [Google Scholar]
- 15. Shin C, Abbott RD, Lee H, et al. Prevalence and correlates of orthostatic hypotension in middle‐aged men and women in Korea: the Korean Health and Genome Study. J Hum Hypertens. 2004;18(10):717–723. [DOI] [PubMed] [Google Scholar]
- 16. Franklin SS, Gustin WT, Wong ND, et al. Hemodynamic patterns of age‐related changes in blood pressure. The Framingham Heart Study. Circulation. 1997;96(1):308–315. [DOI] [PubMed] [Google Scholar]
- 17. Cox DR, Oakes D. Analysis of Survival Data. London, New York: Chapman and Hall; 1984: viii 201. [Google Scholar]
- 18. Sullivan LM, Massaro JM, D'Agostino RB Sr. Presentation of multivariate data for clinical use: the Framingham Study risk score functions. Stat Med. 2004;23(10):1631–1660. [DOI] [PubMed] [Google Scholar]
- 19. DeLong ER, DeLong DM, Clarke‐Pearson DL. Comparing the areas under two or more correlated receiver operating characteristic curves: a nonparametric approach. Biometrics. 1988;44(3):837–845. [PubMed] [Google Scholar]
- 20. Hosmer DW, Hosmer T, Le Cessie S, Lemeshow S. A comparison of goodness‐of‐fit tests for the logistic regression model. Stat Med. 1997;16(9):965–980. [DOI] [PubMed] [Google Scholar]
- 21. Lee LL, Watson MC, Mulvaney CA, et al. The effect of walking intervention on blood pressure control: a systematic review. Int J Nurs Stud. 2010;47(12):1545–1561. [DOI] [PubMed] [Google Scholar]
- 22. Schultz MG, Hordern MD, Leano R, et al. Lifestyle change diminishes a hypertensive response to exercise in type 2 diabetes. Med Sci Sports Exerc. 2011;43(5):764–769. [DOI] [PubMed] [Google Scholar]
- 23. Fuchs FD, Fuchs SC, Moreira LB, et al. Prevention of hypertension in patients with pre‐hypertension: protocol for the PREVER‐prevention trial. Trials. 2011;12:65. [DOI] [PMC free article] [PubMed] [Google Scholar]