

Abstract
The authors investigated effects of excessive salt intake and potassium supplementation on ambulatory arterial stiffness index (AASI) and endothelin‐1 (ET‐1) in salt‐sensitive and non–salt‐sensitive individuals. AASI and symmetric AASI (s‐AASI) were used as indicators of arterial stiffness. Plasma ET‐1 levels were used as an index of endothelial function. Chronic salt‐loading and potassium supplementation were studied in 155 normotensive to mild hypertensive patients from rural northern China. After 3 days of baseline investigation, participants were maintained sequentially for 7 days each on diets of low salt (51.3 mmol/d), high salt (307.7 mmol/d), and high salt+potassium (60 mmol/d). Ambulatory 24‐hour blood pressure (BP) and plasma ET‐1 were measured at baseline and on the last 2 days of each intervention. High‐salt intervention significantly increased BP, AASI, s‐AASI (all P<.001); potassium supplementation reversed increased plasma ET‐1 levels. High‐salt–induced changes in BP, s‐AASI, and plasma ET‐1 were greater in salt‐sensitive individuals. Potassium supplementation decreased systolic BP and ET‐1 to a significantly greater extent in salt‐sensitive vs non–salt‐sensitive individuals (P<.001). Significant correlations were identified between s‐AASI and ET‐1 change ratios in response to both high‐salt intervention and potassium supplementation (P<.001). Reducing dietary salt and increasing daily potassium improves arterial compliance and ameliorates endothelial dysfunction.
Salt (sodium chloride, NaCl) is an essential nutrient and major food additive, and high dietary salt is an important contributor to hypertension (elevated blood pressure [BP]) in humans.1, 2 This phenomenon has also been demonstrated in multiple animal species, including mice, rats, rabbits, dogs, pigs, and chimpanzees.3, 4, 5 In addition to increasing BP, high dietary salt may independently damage vascular function. This can lead to hypertrophy of arterial walls and vascular smooth muscle, increasing arterial stiffness, affecting arterial vessel contractility,6, 7 and impairing endothelial function,8 particularly in salt‐sensitive individuals.1, 4, 9, 10 Salt sensitivity, which is the tendency for BP to fall during salt reduction and rise during salt repletion/supplementation, varies among individuals.1, 11
Studies report that potassium also plays an important role in the development of hypertension,12, 13, 14 and the role of dietary potassium in the pathogenesis of salt sensitivity and related vascular disease is recognized.1 A high‐potassium diet has been shown to blunt the hypertensive effect of high‐sodium intake15 and to inhibit neointimal proliferation in animal studies.16 Increased potassium intake may also reduce sodium sensitivity in humans.14 In one study, supplemental potassium did not reduce BP in mildly hypertensive individuals, but did improve pulse wave velocity and endothelial function.17 Moreover, a randomized controlled trial in early‐stage hypertensive patients found no benefit of dietary potassium supplementation in terms of either BP, arterial stiffness, or endothelial function.18
The linear relationship between systolic BP (SBP) and diastolic BP (DBP) has been shown to reflect arterial properties.19, 20, 21 The ambulatory arterial stiffness index (AASI), which is the linear regression slope of SBP vs DBP obtained through 24‐hour noninvasive ambulatory BP monitoring, is an accepted measure of arterial stiffness/compliance.22, 23, 24 AASI has been reported to correlate with classical measures of arterial stiffness such as pulse wave velocity,20, 25 central and peripheral pulse pressure,26 and the systolic augmentation index.27 It also provides prognostic information on cardiovascular mortality and target‐organ damage over a wide range of ages, especially in normotensive individuals.28, 29 However, AASI has been criticized for its strong inverse relationship with the degree of nocturnal BP fall,19, 30 heart rate,31 and its ambulatory monitoring technique.32 Recently, a modified, symmetric ambulatory arterial stiffness index (s‐AASI) has been shown to provide more clinically relevant evaluation of arterial stiffness, with greater predictive power than the previously established AASI parameter.19, 33, 34 In the present study, both AASI and s‐AASI were used to analyze arterial stiffness. Endothelial dysfunction promotes changes in vascular tone and structure through the release of endothelin‐1 (ET‐1) and is an early and important event in the pathogenesis of atherosclerosis.35 ET‐1, an important member of the endothelin family, may be an indicator of salt‐induced cardiovascular alterations through its multiple biologic effects, including regulation of vascular tone, renal sodium and water excretion, cell growth and proliferation, and extracellular matrix accumulation.36
This study aimed to evaluate the effects of excessive salt intake and potassium supplementation on AASI, s‐AASI, and ET‐1 in a group of normotensive to mild hypertensive patients. We also aimed to determine whether these indicators of cardiovascular status are differentially modified by high‐salt intake or potassium supplementation in salt‐sensitive vs non–salt‐sensitive individuals.
Materials and Methods
Study Participants
From May to October 2010, a total of 202 individuals from rural Shandong Province, China, volunteered to participate in the present study. Among these, 47 participants dropped out or were excluded as a result of incomplete information. Finally, 155 individuals (106 normotensive, 49 mild hypertensive; 89 men, 66 women) with a median age of 53 years (range 36–61 years) were eligible and included in the study. Normotensive was defined as SBP <140 mm Hg and DBP <90 mm Hg. Mild hypertensive was defined as 140≤SBP≤170 mm Hg or 90≤DBP≤100 mm Hg. Exclusion criteria were SBP >170 mm Hg and/or DBP >100 mm Hg, secondary hypertension, antihypertensive medication use, current low‐sodium diet, diabetes mellitus, history of stroke, coronary heart disease, heart failure, peripheral arterial disease, chronic kidney disease (including microproteinuria), pregnant women, smokers, heavy alcohol consumption, chronic liver disease, active peptic ulcer disease, connective tissue disease, and individuals unwilling to provide signed informed consent. This study was approved by the research ethics committee of the Institute of Basic Medicine, Shandong Academy of Medical Sciences. All participants provided signed informed consent.
Chronic Salt Loading and Potassium Supplementation Intervention
The protocol for chronic salt loading and potassium supplementation intervention was performed as described previously.4, 37 The protocol consisted of a 4‐phase timeline as follows. The study participants received 3 days of baseline observation, including medical history and physical examination (height, weight, BP). Then the study participants received a low‐salt diet (3 g of salt or 51.3 mmol of sodium chloride per day) for 7 days. Then, they received a high‐salt diet (18 g of salt or 307.7 mmol of sodium chloride per day) for 7 days. In the final week, the participants maintained a high‐salt diet and took a 60‐mmol potassium (potassium chloride) supplement daily.
All meals were prepared without salt by full‐time chefs in onsite research kitchens. Prepackaged salt (1.5 or 7 g per package) was added by the study staff to each participant's meals. All participants were required to have their meals at the study kitchen under the supervision of the study staff during the entire study period. Participants were instructed to avoid consuming any foods not provided as part of the study.
Salt‐Sensitive Definition
Because BP salt‐sensitivity is a continuous variable,4, 38 study participants were divided into 2 groups, a salt‐sensitive group and a non–salt‐sensitive group, to facilitate analysis, as previously described.39 Salt‐sensitivity was defined as a BP increase of >5 mm Hg over baseline phase BP during the high‐salt phase, or a BP increase of >10 mm Hg over low‐salt phase BP during the high‐salt phase. Individuals not meeting these criteria were considered non–salt‐sensitive.
24‐Hour Ambulatory BP Monitoring
BP measurements were obtained at each clinical visit by trained and certified observers using a validated oscillometric device as well as random–zero sphygmomanometer (A&D TM‐2430 Ambulatory Blood Pressure Monitor; A&D Company Ltd, Tokyo, Japan) according to a common protocol.4 BP was measured with the participant in the sitting position after 5 minutes of rest and recorded intermittent BP every 15 minutes during daytime hours (6 am–10 pm) and every 20 minutes during nighttime hours (10 pm–6 am). The BP cuff was positioned on the nondominant upper limb, and participants were instructed to keep this arm still and relaxed to the side during measurements. Participants were encouraged to engage in normal daily activities. BP was measured in the morning of the 3‐day baseline observation, and the last 3 days of each intervention phase by the same BP technician using the same sphygmomanometer to avoid observation variation. All BP observers were blinded to the dietary intervention.
Ambulatory Arterial Stiffness Indexes
The linear regression slope of DBP vs SBP was computed for each participant from unedited 24‐hour intermittent ambulatory BP recordings.40, 41 Standard asymmetrical linear regression was applied without forcing the slope through the origin, as previously described.27 AASI was defined as one minus the regression slope. AASI values were converted to s‐AASI values using the following approximation: s‐AASI=1−(1−AASI)/r, where r was the correlation coefficient of the regression.19 Ambulatory BP profiles were included for further analysis if r>0.5, indicating a linear SBP‐DBP relationship. Each sampling period included ≥50 readings.
Laboratory Measurements
At baseline and on day 6 of the other 3 phases, venous blood samples were collected in sodium EDTA tubes from each participant in the morning after an overnight fast. Blood samples were centrifuged at 3000 rpm for 30 minutes, and plasma was frozen immediately and stored at −80°C until analysis. As a marker of endothelial injury, plasma ET‐1 was measured by enzyme‐linked immunosorbent assay following the manufacturer's instructions (Bender MedSystems, Vienna, Austria). Minimum detectable concentration was <1.0 pg/mL. Intra‐assay and inter‐assay coefficients of variation were <5%. All samples were measured in duplicate.
Total cholesterol (TC), triglycerides (TGs), high‐density lipoprotein cholesterol (HDL‐C), and fasting plasma blood glucose (FPG) were measured using a Hitachi 7600 automated biochemical analyzer (Hitachi, Ltd, Tokyo, Japan). Low‐density lipoprotein cholesterol (LDL‐C) was calculated using the Friedewald formula: LDL‐C=TC−(HDL‐C+[TGs/5]).
Data Analysis
Continuous data were presented as mean±standard deviation or median with interquartile range (IQR; between 25th and 75th percentile) based on normality of data. Categorical data were expressed by frequency with percentage. Differences in baseline characteristics between salt‐sensitive and non–salt‐sensitive groups were detected by independent t test or Wilcoxon rank‐sum test for continuous variables and chi‐square test for categorical variables. Differences in outcome measures, including 24‐hour SBP, 24‐hour DBP, serum potassium concentration, AASI, s‐AASI, and ET‐1 in response to different interventions were analyzed by Friedman test with post‐hoc Wilcoxon signed‐rank test using Bonferroni correction for pair‐wise comparisons between interventions. Change ratios of outcome measures were calculated as follows: (1) response to high‐salt intervention: difference between high‐salt intervention and low‐salt intervention is relative to low‐salt intervention, (2) response to potassium supplementation: difference between potassium supplementation and high‐salt intervention is relative to high‐salt intervention. Change ratios of outcome measures response to high‐salt intervention or potassium supplementation between salt‐sensitive and non–salt‐sensitive groups were compared by Wilcoxon rank‐sum test. Associations between change ratios of ET‐1 and the other 4 parameters were analyzed with Spearman's rank correlation coefficients (r s) for high‐salt intervention or potassium supplementation, respectively. Strengths of correlations were compared and expressed according to the following scale: very weak (0–0.19), weak (0.20–0.39), moderate (0.40–0.59), strong (0.60–0.79), and very strong (0.80–1.00). Statistical analyses were performed with SAS software version 9.2 (SAS Institute Inc, Cary, NC). A two‐tailed P<.05 was considered statistically significant.
Results
Study Participants’ Baseline Demographic and Clinical Characteristics
Figure 1 shows the process for recruitment and screening of study participants. Of 274 individuals originally screened, 72 were excluded or declined to provide signed informed consent, and 202 were enrolled. Subsequently, 47 individuals withdrew, failed to complete the study or had unacceptable 24‐hour ambulatory BP readings. Finally, 155 individuals (85 salt‐sensitive and 70 non–salt‐sensitive) completed the study and their data were retained for analyses. Comparison of baseline demographic and clinical characteristics of salt‐sensitive and non–salt‐sensitive groups is shown in Table 1. No statistically significant differences were found between the two groups in age, sex, body mass index, SBP, DBP, hypertension, drinking habits, TC, TGs, HDL‐C, LDL‐C, or fasting plasma glucose (all P>.05; Table 1).
Figure 1.

Flowchart of patient enrollment and screening.
Table 1.
Baseline Demographic and Clinical Characteristics
| Characteristics | Salt‐Sensitive (n=85) | Non–Salt‐Sensitive (n=70) | P Value |
|---|---|---|---|
| Sex, No. (%) | |||
| Male | 51 (60.0) | 38 (54.3) | .474a |
| Female | 34 (40.0) | 32 (45.7) | |
| Age, y | |||
| Median, IQR | 53.0 (47.0–56.0) | 52.5 (46.0–57.0) | .843b |
| BMI, kg/m2 | |||
| Mean±SD | 25.77±3.31 | 25.03±3.55 | .182c |
| Weight, kg | |||
| Mean±SD | 67.8±11.1 | 66.4±10.5 | .404c |
| SBP, mm Hg | |||
| Mean±SD | 126.77±12.70 | 124.93±15.55 | .420c |
| DBP, mm Hg | |||
| Mean±SD | 81.92±7.45 | 80.27±9.39 | .236c |
| Hypertension, No. (%) | |||
| Normotensive | 56 (65.9) | 50 (71.4) | .460a |
| Mild hypertensive | 29 (34.1) | 20 (28.6) | |
| Alcohol Consumption, No. (%) | |||
| No | 56 (65.9) | 54 (77.1) | .124a |
| Yes | 29 (34.1) | 16 (22.9) | |
| TC, mmol/L | |||
| Median, IQR | 5.3 (4.8–5.8) | 5.1 (4.6–5.6) | .108b |
| TGs, mmol/L | |||
| Mean±SD | 1.86±0.42 | 1.79±0.44 | .297c |
| HDL‐C, mmol/L | |||
| Median, IQR | 1.5 (1.2–1.7) | 1.4 (1.1–1.6) | .101b |
| LDL‐C, mmol/L | |||
| Mean±SD | 3.44±0.69 | 3.35±0.73 | .438c |
| FPG, mmol/L | |||
| Median, IQR | 5.3 (4.7–6.1) | 5.5 (4.8–5.8) | .749b |
Abbreviations: BMI, body mass index; DBP, diastolic blood pressure; FPG, fasting plasma glucose; HDL‐C, high‐density lipoprotein cholesterol; IQR, interquartile range; LDL‐C, low‐density lipoprotein cholesterol; SBP, systolic blood pressure; SD, standard deviation; TC, total cholesterol; TGs, triglycerides. aChi‐square test. bWilcoxon rank‐sum test. cIndependent t test.
24‐Hour SBP Response to Salt Loading and Potassium Supplementation
Analysis of 24‐hour BP for all participants showed a marked effect of all interventions (Table 2). The 24‐hour median (IQR) SBP for all patients was reduced significantly by low‐salt intervention from a baseline value of 123.0 (111.0–133.0) mm Hg to 113.0 (105.0–123.0) mm Hg (P<.001). The subsequent switch to high salt increased SBP to 131.0 (115.0–139.0) mm Hg, significantly higher than the low‐salt and baseline values (P<.001 for both). Finally, the addition of supplemental potassium in the presence of high salt reduced SBP to 121.0 (109.0–131.0) mm Hg (P<.001 vs high‐salt and low‐salt values), essentially normalizing SBP to baseline values (Table 2).
Table 2.
Baseline 24‐Hour Ambulatory SBP and DBP and Serum Potassium Concentration Response to Low‐Salt, High‐Salt, and High‐Salt With Potassium Supplementation Interventions for Total Patients, Salt‐Sensitive Patients, and Non–Salt‐Sensitive Patients
| Baseline | Low‐Salt | High‐Salt | High‐Salt+Potassium Supplementation | P Valuea | |
|---|---|---|---|---|---|
| 24‐h ambulatory SBP, mm Hg | |||||
| Total, N=155 | 123.0 (111.0–133.0) | 113.0 (105.0–123.0)b | 131.0 (115.0–139.0)b,c | 121.0 (109.0–131.0)c,d | <.001 |
| Salt‐sensitive, n=85 | 125.0 (113.0–133.0) | 113.0 (105.0–121.0)b | 133.0 (121.0–141.0)b,c | 125.0 (113.0–131.0)c,d | <.001 |
| Non–salt‐sensitive, n=70 | 117.0 (107.0–129.0) | 112.0 (103.0–125.0)b | 119.0 (109.0–133.0)b,c | 115.0 (105.0–127.0)c,d | <.001 |
| 24‐h ambulatory DBP, mm Hg | |||||
| Total, N=155 | 77.0 (69.0–83.0) | 71.0 (67.0–79.0)b | 81.0 (73.0–85.0)b,c | 77.0 (71.0–81.0)c,d | <.001 |
| Salt‐sensitive, n=85 | 77.0 (71.0–83.0) | 73.0 (67.0–77.0)b | 81.0 (77.0–85.0)b,c | 77.0 (73.0–81.0)c,d | <.001 |
| Non–salt‐sensitive, n=70 | 75.0 (69.0–83.0) | 71.0 (67.0–79.0)b | 79.0 (71.0–85.0)b,c | 75.0 (69.0–81.0)c,d | <.001 |
| Serum potassium concentration, mmol/L | |||||
| Total, N=155 | 4.40 (4.20–4.70) | 4.64 (4.49–4.82)b | 4.40 (4.10–4.90)c | 4.95 (4.80–5.17)b,c,d | <.001 |
| Salt‐sensitive, n=85 | 4.30 (4.00–4.70) | 4.59 (4.49–4.84)b | 4.40 (4.10–4.70)c | 4.95 (4.72–5.18)b,c,d | <.001 |
| Non–salt‐sensitive, n=70 | 4.59 (4.30–4.80) | 4.69 (4.54–4.82) | 4.55 (4.20–4.90) | 4.99 (4.88–5.14)b,c,d | <.001 |
Abbreviations: DBP, diastolic blood pressure; SBP, systolic blood pressure. aFriedman test. Post‐hoc Wilcoxon signed‐rank test using Bonferroni correction: b P<.05 vs baseline, c P<.05 vs low‐salt intervention, d P<.05 vs high‐salt intervention.
The medians (IQR) of 24‐hour SBP of salt‐sensitive participants during baseline, low‐salt, high‐salt, and high‐salt/potassium supplementation phases were 125.0 (113.0–133.0) mm Hg, 113.0 (105.0–121.0) mm Hg, 133.0 (121.0–141.0) mm Hg, and 125.0 (113.0–131.0) mm Hg, respectively. Those for non–salt‐sensitive participants were 117.0 (107.0–129.0) mm Hg, 112.0 (103.0–125.0) mm Hg, 119.0 (109.0–133.0) mm Hg, and 115.0 (105.0–127.0) mm Hg, respectively (Table 2).
Change ratios for 24‐hour ambulatory SBP are shown in Table 3. The 24‐hour SBP change ratio response to high‐salt intervention was significantly greater for salt‐sensitive individuals than for non–salt‐sensitive participants (median [IQR]): 0.15 [0.10–0.21] vs 0.07 [0.04–0.09], respectively; P<.001). The magnitude of 24‐hour change ratio response to potassium supplementation was greater in salt‐sensitive individuals than in non–salt‐sensitive participants: −0.06 (−0.09 to −0.02) vs −0.04 (−0.06 to −0.02), respectively (P=.009) (Figure 2e; Table 3).
Table 3.
Change Ratios of 24‐Hour Ambulatory SBP and DBP and Serum Potassium Concentration in Response to High‐Salt Intervention or to Potassium Supplementation Between Salt‐Sensitive and Non–Salt‐Sensitive Participants
| Salt‐Sensitive | Non–Salt‐Sensitive | P Valuea | |
|---|---|---|---|
| 24‐h ambulatory SBP, mm Hg | |||
| Change ratios in response to high‐salt intervention | 0.15 (0.10–0.21) | 0.07 (0.04–0.09) | <.001 |
| Change ratios in response to potassium supplementation | −0.06 (−0.09 to −0.02) | −0.04 (−0.06 to −0.02) | .009 |
| 24‐hour ambulatory DBP, mm Hg | |||
| Change ratios in response to high‐salt intervention | 0.12 (0.05–0.18) | 0.07 (0.03–0.10) | <.001 |
| Change ratios in response to potassium supplementation | −0.05 (−0.08 to 0.00) | −0.03 (−0.07 to 0.00) | .107 |
| Sera potassium concentration, mmol/L | |||
| Change ratios in response to high‐salt intervention | −0.04 (−0.11 to 0.04) | −0.03 (−0.11 to 0.07) | .218 |
| Change ratios in response to potassium supplementation | 0.14 (0.06–0.20) | 0.10 (0.02–0.19) | .203 |
Wilcoxon rank‐sum test.
Figure 2.

Baseline ambulatory arterial stiffness index (AASI) and responses to low‐salt, high‐salt, and high‐salt+potassium supplementation interventions for (a) total, (b) salt‐sensitive, and (c) non–salt‐sensitive participants. Change ratios for AASI in salt‐sensitive and non–salt‐sensitive participants in response to (d) high‐salt intervention and (e) potassium supplementation. *P<.05 vs baseline. † P<.05 vs low‐salt intervention. ‡ P<.05 vs high‐salt intervention. § P<.05 vs salt‐sensitive group.
24‐Hour DBP Response to Salt Loading and Potassium Supplementation
Among all participants, the median (IQR) 24‐hour DBP was modified significantly by each intervention, and effects were qualitatively similar to effects on SBP. The baseline DBP of 77.0 (69.0–83.0) mm Hg was reduced to 71.0 (67.0–79.0) mm Hg (P<.001) by low‐salt intervention, increased to 81.0 (73.0–85.0) mm Hg by high‐salt intervention (P<.001 vs baseline and low‐salt DBP), and again reduced by addition of supplemental potassium to 77.0 (71.0–81.0) mm Hg (P<.001 vs low‐salt and high‐salt; Table 2).
Analysis of effects of the 3 interventions according to salt‐sensitivity showed essentially the same effects as those for participants as a whole. In salt‐sensitive individuals, the baseline 24‐hour DBP and that after low salt, high salt, and supplemental potassium were 77.0 (71.0–83.0) mm Hg, 73.0 (67.0–77.0) mm Hg, 81.0 (77.0–85.0) mm Hg, and 77.0 (73.0–81.0) mm Hg, respectively. The 24‐hour DBP values in non–salt‐sensitive participants were 75.0 (69.0–83.0) mm Hg, 71.0 (67.0–79.0) mm Hg, 79.0 (71.0–85.0) mm Hg, and 75.0 (69.0–81.0) mm Hg, respectively. Again, the significance of each effect was identical to that found for analysis of all participants (Table 2).
Change ratios for 24‐hour ambulatory DBP are shown in Table 3. The 24‐hour DBP change ratio response to high‐salt intervention was significantly greater for salt‐sensitive individuals than for non–salt‐sensitive participants (median [IQR]): 0.12 [0.05–0.18] vs 0.07 [0.03–0.10], respectively; P<.001). However, the 24‐hour DBP change ratio response to potassium supplementation in salt‐sensitive participants did not differ significantly from that in non–salt‐sensitive participants: −0.05 (−0.08 to 0.00) vs −0.03 (−0.07 to 0.00) (P=.107) (Table 3).
AASI Responses to Salt Loading and Potassium Supplementation
Analysis of the AASI for all participants revealed significant effects of each intervention (Figure 2). The baseline, median (IQR) AASI value was 0.53 (0.45–0.63), which was reduced by low‐salt intervention to 0.41 (0.34–0.45) (P<.001). High‐salt intervention increased AASI to 0.65 (0.56–0.72) (P<.001 vs baseline and low salt), and adding supplemental potassium subsequently reduced AASI to 0.53 (0.42–0.58) (P<.001 vs low salt and high salt; Figure 2).
In the salt‐sensitive group, median (IQR) AASIs for baseline, low‐salt, high‐salt, and supplemental potassium conditions were 0.54 (0.46–0.64), 0.41 (0.36–0.45), 0.66 (0.60–0.73), and 0.55 (0.45–0.59) mm Hg, respectively (Figure 2b), and AASI values for non–salt‐sensitive participants were 0.52 (0.44–0.61), 0.40 (0.33–0.45), 0.61 (0.49–0.69), and 0.52 (0.38–0.57), respectively (Figure 2c). Effects in both groups followed the same pattern of statistical significance as those for analysis of all participants.
AASI change ratios of salt‐sensitive participants were not significantly different from those of non–salt‐sensitive participants in response to either high‐salt intervention (median [IQR]: 0.62 [0.61–0.64] vs 0.62 [0.47–0.64], P=.180; Figure 2d) or potassium supplementation: −0.16 (−0.28 to −0.15) vs −0.15 (−0.25 to −0.15), P=.126; Figure 2e.
s‐AASI Response to Salt Loading and Potassium Supplementation
Analysis of all participants revealed significant effects of all interventions on s‐AASI (Figure 3). Baseline median (IQR) s‐AASI value was 0.31 (0.22–0.37), which was reduced by low‐salt intervention to 0.22 (0.15–0.28) (P<.001). High‐salt intervention increased s‐AASI to 0.33 (0.25–0.41) (P<.001 vs baseline and low salt), and potassium supplementation subsequently reduced s‐ASSI to 0.28 (0.20–0.35) (P<.001 vs low salt and high salt; Figure 3a).
Figure 3.
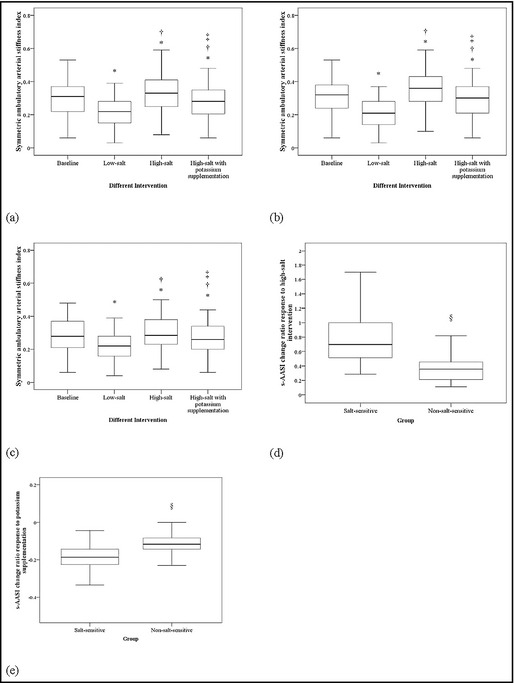
Baseline symmetric ambulatory arterial stiffness index (s‐AASI) and responses to low‐salt, high‐salt, and high‐salt+potassium supplementation interventions for (a) total, (b) salt‐sensitive, and (c) non–salt‐sensitive participants. Change ratios for s‐AASI in salt‐sensitive participants and non–salt‐sensitive participants in response to (d) high‐salt intervention and (e) potassium supplementation. *P<.05 vs baseline. † P<.05 vs low‐salt intervention. ‡ P<.05 vs high‐salt intervention. § P<.05 vs salt‐sensitive group.
Among salt‐sensitive participants, the median (IQR) AASIs for baseline, low‐salt, high‐salt, and supplemental potassium conditions were 0.32 (0.24–0.38), 0.21 (0.14–0.28), 0.36 (0.28–0.43), and 0.30 (0.21–0.37) mm Hg, respectively (Figure 3b), and AASI values for non–salt‐sensitive participants were 0.52 (0.44–0.61), 0.40 (0.33–0.45), 0.61 (0.49–0.69), and 0.52 (0.38–0.57), respectively (Figure 3c). The effects in both groups followed the same pattern of statistical significance as those for analysis of all participants.
Salt‐sensitive participants had significantly higher s‐AASI change ratios in response to high‐salt intervention than their non–salt‐sensitive counterparts (median [IQR]: 0.70 [0.52–1.00] vs 0.36 [0.21–0.45], P<.001; Figure 3d), but no differences were noted with potassium supplementation: −0.19 (−0.23 to −0.14) vs −0.12 (−0.14 to −0.08) (P<.001; Figure 3e).
ET‐1 Response to Salt Loading and Potassium Supplementation
Among total participants, the median baseline (IQR) of ET‐1 levels was 40.84 (37.85–44.41) pg/mL, which was decreased by low‐salt (35.68 [32.04–39.08] pg/mL [P<.001]) and subsequently increased by high‐salt intervention (43.97 [40.72–47.75] pg/mL [P<.001 vs baseline and low salt]). Supplemental potassium intervention increased ET‐1 to 42.56 (38.56–46.17) pg/mL (P<.001 vs low salt, high salt, and baseline; Figure 4a).
Figure 4.

Baseline endothelin‐1 (ET‐1) level and response to low‐salt, high‐salt, and high‐salt+potassium supplementation interventions for (a) total, (b) salt‐sensitive, and (c) non–salt‐sensitive participants. Change ratios for ET‐1 in salt‐sensitive participants and non–salt‐sensitive participants in response to (d) high‐salt intervention and (e) potassium supplementation. *P<.05 compared with baseline. † P<.05 compared with low‐salt intervention. ‡ P<.05 compared with high‐salt intervention. § P<.05 compared with salt‐sensitive group.
In the salt‐sensitive group, the median (IQR) of ET‐1 levels were: baseline, 41.80 (38.06–44.47) pg/mL; low‐salt, 34.14 (30.20–37.87) pg/mL; high‐salt, 44.67 (41.42–48.74) pg/mL; and potassium supplementation, 42.59 (38.80–46.85) pg/mL (Figure 4b). Corresponding levels for the non–salt‐sensitive group were 40.40 (37.81–43.53) pg/mL, 36.77 (34.35–40.57) pg/mL, 42.81 (40.01–45.56) pg/mL, and 41.55 (38.56–44.73) pg/mL, respectively (Figure 4c). The significance of each effect was identical to that observed for analysis of all participants.
Salt‐sensitive participants had significantly higher ET‐1 change ratios in response to high‐salt intervention than non–salt sensitive individuals (median [IQR]: 0.33 [0.29–0.38] vs 0.15 [0.11–0.18], P<.001; Figure 4d), and significantly lower change ratios in response to potassium supplementation (median [IQR]: −0.04 [−0.05 to −0.03] vs −0.02 [−0.03 to −0.02], P<.001; Figure 4e).
Correlations Between ET‐1 Change Ratios and Other Parameters
ET‐1 change ratios in response to high‐salt intervention correlated significantly with change ratios for 24‐hour SBP (r s=0.572, P<.001, Figure 5a), 24‐hour DBP (r s=0.347, P<.001, Figure 5c), and s‐AASI (r s=0.523, P<.001, Figure 5g). In contrast, ET‐1 change ratios in response to potassium supplementation correlated only with change ratios for s‐AASI (r s=0.421, P<.001, Figure 5h).
Figure 5.

Correlations between the endothelin‐1 (ET‐1) change ratio and change ratios for 24‐hour systolic blood pressure (SBP), 24‐hour diastolic blood pressure (DBP), ambulatory arterial stiffness index (AASI), and symmetric AASI (s‐AASI) among total participants in response to high‐salt intervention and potassium supplementation, respectively. Spearman's rank correlation coefficients (r s) were calculated for each scatter plot: ET‐1 vs 24‐hour SBP for (a) high‐salt intervention and (b) potassium supplementation; ET‐1 vs 24‐hour DBP for (c) high‐salt intervention and (d) potassium supplementation; ET‐1 vs AASI for (e) high‐salt intervention and (f) potassium supplementation; ET‐1 vs s‐AASI for (g) high‐salt intervention and (h) potassium supplementation.
Discussion
We investigated effects of excessive salt intake and potassium supplementation on arterial stiffness and endothelial function in normotensive and mild hypertensive individuals, and the sensitivity of these interventions in salt‐sensitive vs non–salt‐sensitive individuals, finding that: (1) high‐salt intake not only elevated SBP and DBP, but also increased arterial stiffness and damaged endothelial function; (2) low‐salt intake improved arterial compliance and endothelial function compared with baseline conditions; (3) supplemental potassium reversed deleterious effects of high‐salt diets on arterial stiffness and endothelial dysfunction; (4) salt‐sensitive individuals experienced significantly greater effects of high‐salt loading on BP, s‐AASI, and ET‐1 levels than non–salt‐sensitive individuals, and greater beneficial effects of potassium supplementation on SBP, arterial stiffness, and endothelial function.
Excessive salt intake can markedly increase BP and have other harmful cardiovascular effects independent of and additive to its effect on BP.2, 5 High‐salt intake has significant direct effects that increase arterial stiffness and damage endothelial function,42, 43 and effects increase in proportion to dietary salt levels.4, 44 When effects of salt loading on pulse wave velocity were studied in 34 hypertensive patients, pulse wave velocity increased significantly (0.35–0.39 m/s) from baseline after 4 weeks on high‐salt diets.45 Evaluation of associations between salt intake levels and arterial stiffness revealed a positive correlation (r=0.256) between 24‐hour urinary sodium excretion and pulse wave velocity after adjustment for age and BP.6 Conversely, low dietary sodium decreases arterial stiffness, rapidly improving large elastic artery compliance in older adults with systolic hypertension.46 A meta‐analysis of 38 studies on effects of dietary and nutritional interventions on arterial stiffness found consistent evidence suggesting that salt restriction (Cohen's d=0.28–0.37) decreased arterial stiffness.47 In the present study, using AASI and s‐AASI as indicators of arterial stiffness, these parameters increased markedly after high‐salt intervention compared with low‐salt intervention, demonstrating that excessive sodium intake increases arterial stiffness.
Endothelial dysfunction, a clinically relevant marker of early target‐organ damage, is reported to be associated with high‐salt intake and/or salt sensitivity.44 A direct effect of salt intake on the endothelium is mediated through changes in shear stress, which influences production of ET‐1. Salt loading is reported to increase medullary ET‐1 mRNA in rats and to increase collecting‐duct ET‐1 excretion associated with natriuresis.48, 49 Our results showed a significant elevation of plasma ET‐1 when participants received a high‐sodium diet, and a marked decrease in plasma ET‐1 after low‐salt intervention. These results indicate a deleterious effect of high‐salt intake on vascular function and that a major benefit of low‐salt intake may be to improve endothelial function.
Correlation analysis between change ratios for ET‐1 vs change ratios for AASI and s‐AASI revealed no obvious correlation between ET‐1 and AASI change ratios in response to high‐salt intervention, but a significant positive correlation was identified between ET‐1 and s‐AASI change ratios. This indicates that high‐salt intake increases arterial stiffness and damages endothelial function, while suggesting that a vicious cycle may exist between endothelial dysfunction and increased arterial stiffness.
Salt sensitivity is prognostic for cardiovascular risk independent of other factors and is associated with more severe target organ damage and higher mortality.11 A close relationship is shown between ET‐1 and development and maintenance of salt‐sensitive hypertension.50 The greater degree of endothelial dysfunction in salt‐sensitive hypertensive patients may underlie increases in target‐organ damage and cardiovascular risk compared with that found in salt‐resistant hypertensive patients.8 In the present study, change ratios for SBP, DBP, AASI, s‐AASI, and ET‐1 levels in response to high‐salt intervention were greater in the salt‐sensitive group than the non–salt‐sensitive group, suggesting more serious deleterious effects of high‐salt intake on arterial and endothelial function in salt‐sensitive individuals.
High levels of dietary potassium tend to be associated with lower BP and better endothelial function. High‐potassium intake helps to offset high‐sodium–induced increases in BP by increasing sodium excretion, indirectly improving endothelial function.6, 42 He and colleagues17 reported that an increase in potassium intake significantly improved endothelial function and increased arterial compliance in mildly hypertensive patients, even in individuals already on relatively low‐salt and high‐potassium diets. In the present study, SBP and DBP were reduced after participants received supplemental potassium on top of high‐salt intake, and AASI, s‐AASI, and ET‐1 plasma levels also decreased. These results were more pronounced in salt‐sensitive participants. Also, change ratios for SBP, s‐AASI, and ET‐1 in response to potassium supplementation were markedly higher in salt‐sensitive participants than in non–salt‐sensitive participants, agreeing with other investigators that increased potassium intake may reduce sodium sensitivity and improve negative effects of high‐salt intake on arterial compliance and endothelial function.12
Limitations
This study has limitations. First, we used AASI and s‐AASI as indirect indicators of arterial stiffness, rather than direct measuring techniques such as pulse wave velocity and flow‐mediated dilation. However, while AASI may exhibit a strong inverse relationship with degree of nocturnal BP fall,19, 30 heart rate,31 and ambulatory monitoring,32 it is widely applied as a measure of arterial stiffness/compliance,22, 23, 24 and correlates with classical measures of arterial stiffness such as pulse wave velocity,20, 25 central and peripheral pulse pressure,26 and systolic augmentation index.27 Results of s‐AASI are reported to be more clinically relevant with greater predictive power than AASI.19, 33, 34 Plasma ET‐1 levels, used in this study as an index of endothelial function, is an indirect surrogate, not a direct measurement. Because ET‐1 increases with natriuresis,48, 49 interpretation of plasma ET‐1 levels may be limited. Second, due to short 7‐day dietary interventions, changes in arterial stiffness and endothelial function may not have been obvious or had sufficient time to develop fully. Drastic changes in NaCl intake, from 51.3 to 307.7 mmol/d (3–18 g/d) may stimulate the renin‐angiotensin axis and the sympathetic nervous system,41 and activation of these systems may reduce the magnitude of change in arterial stiffness and endothelial function in response to salt loading. Also, salt loading results may be influenced by changes in plasma volume, and the included baseline weight data (Table 1) were not compared with postintervention weights. Although we identified significant cardiovascular benefits of potassium supplementation, we evaluated only a single daily dose. Future studies should explore a range of daily potassium supplements to help determine optimal intake. Finally, baseline dietary salt intake was not controlled, and change ratios in response to low‐salt intervention were not analyzed, although effects of low‐salt intervention are revealed to some extent by high‐salt intervention change ratios.
Conclusions
Excessive salt intake is important in the development of arterial stiffness and endothelial dysfunction in normotensive to mild hypertensive individuals. Restricted dietary salt intake and supplemental potassium can reduce BP and improve arterial compliance and endothelial function, reversing negative effects of dietary high salt. Effects of all measures are more pronounced in salt‐sensitive individuals than non–salt‐sensitive individuals.
Disclosures
The authors have no financial conflicts of interest.
Conflict of interest
The authors declare no conflicts of interest exist.
Acknowledgments
None.
Sources of Funding
This work was supported by the Natural Science Foundation of Shandong Province, China (No. ZR2009CL029 and No. ZR2011HQ053), and by the Shandong Science and Technology Development Program, China (No. 2011GSF11822).
J Clin Hypertens (Greenwich). 2013;15:485–496. © 2013 Wiley Periodicals, Inc.23815537
References
- 1. Kanbay M, Chen Y, Solak Y, Sanders PW. Mechanisms and consequences of salt sensitivity and dietary salt intake. Curr Opin Nephrol Hypertens. 2011;20:37–43. [DOI] [PMC free article] [PubMed] [Google Scholar]
- 2. Mohan S, Campbell NR. Salt and high blood pressure. Clin Sci (Lond). 2009;117:1–11. [DOI] [PubMed] [Google Scholar]
- 3. Elliott P, Walker LL, Little MP, et al. Change in salt intake affects blood pressure of chimpanzees: implications for human populations. Circulation. 2007;116:1563–1568. [DOI] [PubMed] [Google Scholar]
- 4. He J, Gu D, Chen J, et al. Gender difference in blood pressure responses to dietary sodium intervention in the GenSalt study. J Hypertens. 2009;27:48–54. [DOI] [PMC free article] [PubMed] [Google Scholar]
- 5. Penner SB, Campbell NR, Chockalingam A, et al. Dietary sodium and cardiovascular outcomes: a rational approach. Can J Cardiol. 2007;23:567–572. [DOI] [PMC free article] [PubMed] [Google Scholar]
- 6. Polonia J, Maldonado J, Ramos R, et al. Estimation of salt intake by urinary sodium excretion in a Portuguese adult population and its relationship to arterial stiffness. Rev Port Cardiol. 2006;25:801–817. [PubMed] [Google Scholar]
- 7. Sanders PW. Dietary salt intake, salt sensitivity, and cardiovascular health. Hypertension. 2009;53:442–445. [DOI] [PMC free article] [PubMed] [Google Scholar]
- 8. Bragulat E, de la Sierra A. Salt intake, endothelial dysfunction, and salt‐sensitive hypertension. J Clin Hypertens (Greenwich). 2002;4:41–46. [DOI] [PMC free article] [PubMed] [Google Scholar]
- 9. Avolio A. Salt sensitivity and arterial structure and function. J Hypertens. 2003;21:251–253. [DOI] [PubMed] [Google Scholar]
- 10. Liu FQ, Mu JJ, Liu ZQ, et al. Endothelial dysfunction in normotensive salt‐sensitive subjects. J Hum Hypertens. 2012;26:247–252. [DOI] [PubMed] [Google Scholar]
- 11. Franco V, Oparil S. Salt sensitivity, a determinant of blood pressure, cardiovascular disease and survival. J Am Coll Nutr. 2006;25(3 suppl):247S–255S. [DOI] [PubMed] [Google Scholar]
- 12. Adrogue HJ, Madias NE. Sodium and potassium in the pathogenesis of hypertension. N Engl J Med. 2007;356:1966–1978. [DOI] [PubMed] [Google Scholar]
- 13. Cunha AR, Umbelino B, Correia ML, Neves MF. Magnesium and vascular changes in hypertension. Int J Hypertens. 2012;2012:754250. [DOI] [PMC free article] [PubMed] [Google Scholar]
- 14. Yamori M, Njelekela M, Mtabaji J, et al. Hypertension, periodontal disease, and potassium intake in nonsmoking, nondrinker African women on no medication. Int J Hypertens. 2011;2011:695719. [DOI] [PMC free article] [PubMed] [Google Scholar]
- 15. Tobian L. Dietary sodium chloride and potassium have effects on the pathophysiology of hypertension in humans and animals. Am J Clin Nutr. 1997;65(2 suppl):606S–611S. [DOI] [PubMed] [Google Scholar]
- 16. Ma G, Srivastava NT, Anderson PG, et al. Elevated potassium intake inhibits neointimal proliferation in the swine coronary artery. Am J Hypertens. 2001;14(9 Pt 1):879–886. [DOI] [PubMed] [Google Scholar]
- 17. He FJ, Marciniak M, Carney C, et al. Effects of potassium chloride and potassium bicarbonate on endothelial function, cardiovascular risk factors, and bone turnover in mild hypertensives. Hypertension. 2010;55:681–688. [DOI] [PubMed] [Google Scholar]
- 18. Berry SE, Mulla UZ, Chowienczyk PJ, Sanders TA. Increased potassium intake from fruit and vegetables or supplements does not lower blood pressure or improve vascular function in UK men and women with early hypertension: a randomised controlled trial. Br J Nutr. 2010;104:1839–1847. [DOI] [PubMed] [Google Scholar]
- 19. Gavish B, Ben‐Dov IZ, Bursztyn M. Linear relationship between systolic and diastolic blood pressure monitored over 24 h: assessment and correlates. J Hypertens. 2008;26:199–209. [DOI] [PubMed] [Google Scholar]
- 20. Gomez‐Marcos MA, Recio‐Rodriguez JI, Patino‐Alonso MC, et al. Ambulatory arterial stiffness indices and target organ damage in hypertension. BMC Cardiovasc Disord. 2012;12:1. [DOI] [PMC free article] [PubMed] [Google Scholar]
- 21. Gosse P, Papaioanou G, Coulon P, et al. Can ambulatory blood‐pressure monitoring provide reliable indices of arterial stiffness? Am J Hypertens. 2007;20:831–838. [DOI] [PubMed] [Google Scholar]
- 22. Dassie F, Grillo A, Carretta R, et al. Ambulatory arterial stiffness indexes in acromegaly. Eur J Endocrinol. 2012;166:199–205. [DOI] [PubMed] [Google Scholar]
- 23. Schillaci G, Parati G. Ambulatory arterial stiffness index: merits and limitations of a simple surrogate measure of arterial compliance. J Hypertens. 2008;26:182–185. [DOI] [PubMed] [Google Scholar]
- 24. Stergiou GS, Kollias A, Rarra VC, Roussias LG. Ambulatory arterial stiffness index: reproducibility of different definitions. Am J Hypertens. 2010;23:129–134. [DOI] [PubMed] [Google Scholar]
- 25. Hansen TW, Li Y, Staessen JA, et al. Independent prognostic value of the ambulatory arterial stiffness index and aortic pulse wave velocity in a general population. J Hum Hypertens. 2008;22:214–216. [DOI] [PubMed] [Google Scholar]
- 26. Laugesen E, Hansen KW, Knudsen ST, et al. Increased ambulatory arterial stiffness index and pulse pressure in microalbuminuric patients with type 1 diabetes. Am J Hypertens. 2009;22:513–519. [DOI] [PubMed] [Google Scholar]
- 27. Li Y, Wang JG, Dolan E, et al. Ambulatory arterial stiffness index derived from 24‐hour ambulatory blood pressure monitoring. Hypertension. 2006;47:359–364. [DOI] [PubMed] [Google Scholar]
- 28. Hansen TW, Staessen JA, Torp‐Pedersen C, et al. Ambulatory arterial stiffness index predicts stroke in a general population. J Hypertens. 2006;24:2247–2253. [DOI] [PubMed] [Google Scholar]
- 29. Dolan E, Thijs L, Li Y, et al. Ambulatory arterial stiffness index as a predictor of cardiovascular mortality in the Dublin Outcome Study. Hypertension. 2006;47:365–370. [DOI] [PubMed] [Google Scholar]
- 30. Vincenti M, von Vigier RO, Wuhl E, et al. The ambulatory arterial stiffness index is not affected by night‐time blood pressure characteristics. J Hum Hypertens. 2009;23:680–682. [DOI] [PubMed] [Google Scholar]
- 31. Kips JG, Vermeersch SJ, Reymond P, et al. Ambulatory arterial stiffness index does not accurately assess arterial stiffness. J Hypertens. 2012;30:574–580. [DOI] [PubMed] [Google Scholar]
- 32. Dechering DG, Adiyaman A, van der Steen M, Thien T. Interstudy variability in the ambulatory arterial stiffness index. Hypertension. 2007;50:e65; author reply e6. [DOI] [PubMed] [Google Scholar]
- 33. Ben‐Dov IZ, Gavish B, Kark JD, et al. A modified ambulatory arterial stiffness index is independently associated with all‐cause mortality. J Hum Hypertens. 2008;22:761–766. [DOI] [PubMed] [Google Scholar]
- 34. Robles NR, Mena C, Macias R, et al. Symmetrical ambulatory arterial stiffness index: relationship with microalbuminuria and renal function. Eur J Intern Med. 2010;21:118–122. [DOI] [PubMed] [Google Scholar]
- 35. Noshad H, Argani H, Nezami N, et al. Arterial atherosclerosis in patients with chronic kidney disease and its relationship with serum and tissue endothelin‐1. [corrected]. Iran J Kidney Dis. 2009;3:203–209. [PubMed] [Google Scholar]
- 36. Kohan DE. Endothelin, hypertension and chronic kidney disease: new insights. Curr Opin Nephrol Hypertens. 2010;19:134–139. [DOI] [PMC free article] [PubMed] [Google Scholar]
- 37. Zhao Q, Hixson JE, Rao DC, et al. Genetic variants in the apelin system and blood pressure responses to dietary sodium interventions: a family‐based association study. J Hypertens. 2010;28:756–763. [DOI] [PMC free article] [PubMed] [Google Scholar]
- 38. Strazzullo P. Compelling evidence for salt‐dependence of blood pressure from GENSALT. J Hypertens. 2009;27:22–23. [DOI] [PubMed] [Google Scholar]
- 39. Sullivan JM. Salt sensitivity. Definition, conception, methodology, and long‐term issues. Hypertension. 1991;17(1 suppl):I61–I68. [DOI] [PubMed] [Google Scholar]
- 40. Dolan E, Li Y, Thijs L, et al. Ambulatory arterial stiffness index: rationale and methodology. Blood Press Monit. 2006;11:103–105. [DOI] [PubMed] [Google Scholar]
- 41. Liu Z, Hesse C, Curry TB, et al. Ambulatory arterial stiffness index is not correlated with the pressor response to laboratory stressors in normotensive humans. J Hypertens. 2009;27:763–768. [DOI] [PMC free article] [PubMed] [Google Scholar]
- 42. Fang Y, Mu JJ, He LC, et al. Salt loading on plasma asymmetrical dimethylarginine and the protective role of potassium supplement in normotensive salt‐sensitive asians. Hypertension. 2006;48:724–729. [DOI] [PubMed] [Google Scholar]
- 43. Sanders PW. Vascular consequences of dietary salt intake. Am J Physiol Renal Physiol. 2009;297:F237–F243. [DOI] [PMC free article] [PubMed] [Google Scholar]
- 44. Bragulat E, de la Sierra A, Antonio MT, Coca A. Endothelial dysfunction in salt‐sensitive essential hypertension. Hypertension. 2001;2:444–448. [DOI] [PubMed] [Google Scholar]
- 45. Todd AS, Macginley RJ, Schollum JB, et al. Dietary salt loading impairs arterial vascular reactivity. Am J Clin Nutr. 2010;91:557–564. [DOI] [PubMed] [Google Scholar]
- 46. Gates PE, Tanaka H, Hiatt WR, Seals DR. Dietary sodium restriction rapidly improves large elastic artery compliance in older adults with systolic hypertension. Hypertension. 2004;44:35–41. [DOI] [PubMed] [Google Scholar]
- 47. Pase MP, Grima NA, Sarris J. The effects of dietary and nutrient interventions on arterial stiffness: a systematic review. Am J Clin Nutr. 2011;93:446–454. [DOI] [PubMed] [Google Scholar]
- 48. Ahn D, Ge Y, Stricklett PK, et al. Collecting duct‐specific knockout of endothelin‐1 causes hypertension and sodium retention. J Clin Invest. 2004;114:504–511. [DOI] [PMC free article] [PubMed] [Google Scholar]
- 49. Lyon‐Roberts B, Strait KA, van Peursem E, et al. Flow regulation of collecting duct endothelin‐1 production. Am J Physiol Renal Physiol. 2011;300:F650–F656. [DOI] [PMC free article] [PubMed] [Google Scholar]
- 50. Elijovich F, Laffer CL, Amador E, et al. Regulation of plasma endothelin by salt in salt‐sensitive hypertension. Circulation. 2001;103:263–268. [DOI] [PubMed] [Google Scholar]