Abstract
The aim of this study was to investigate the association between geographic regions and ovarian cancer disparities in the United States. Data from the Surveillance, Epidemiology, and End Results (SEER) Program was used to identify women diagnosed with ovarian cancer. 18 registries were divided into two groups: South region and US14 region. Chi-Square tests were used to compare proportions, the logistic regression model to evaluate the association between 5-year survival and other variables, and the Cox proportional hazards model to estimate hazard ratios. The South region had a lower incidence rate than the US14 region (12.0 vs. 13.4 per 100,000), and a lower 5-year observed survival rate (37.5% vs. 39.8%). White women living in the US14 region had the best overall survival, compared to white women living in the South region, and black women living in both regions. Women in the South region were less likely to have insurance (6.6% vs. 2.7%, p<0.0001) and surgery (73.4% vs. 76.2%, p<0.0001). Women living in the South were 1.4 times more likely to die after five years of diagnosis than women living in the US14 region. The data confirmed regional disparities in ovarian cancer in the United States, showing women living in the South region were disadvantaged in ovarian cancer survival regardless of race, black or white. Future research focusing on the identification of contributing factors to regional disparity in ovarian cancer is necessary to develop practical approaches to improve health outcomes related to this lethal disease.
Keywords: Ovarian Cancer, Geographic Health Disparities, Survival
INTRODUCTION
Ovarian cancer is the tenth most common cancer and the fifth most lethal cancer among women in the United States. In 2017, there will be an estimated 22,440 new cases and 14,080 cancer deaths (ACS, 2014). A woman’s risk of getting invasive ovarian cancer during her lifetime is about 1 in 75, and the risk of dying from invasive ovarian cancer is about 1 in 100 (OCRFA).
Racial disparities in ovarian cancer have been well documented in the United States. For example, white women had higher incidence rates and higher mortality rates compared to black women. However, 5-year relative survival rate was lower in black women than in white women. The incidence of ovarian cancer was 12.2 in white women, and 9.4 in black women, and the number of deaths was 7.7 in white women and 6.4 in black women (per 100,000 women, 2010–2014) (OCRFA). The five-year relative survival rate in black women was 38%, compared with 46% in white women (2006–2012) (ACS, 2014). From 2003 to 2012, the incidence rate decreased by 2.1% per year among white women, while it only decreased by 1.3% among black women (CDC). During the same time period, the mortality rate decreased by 2.1% per year among white women comparing to 1.6% among black women(CDC). The five-year relative survival rate of ovarian cancer among white women increased from 35% (1975–1977) to 46% (2006–2012). However, the survival rate among black women decreased from 42% to 38%.
Studies about racial disparities in ovarian cancer have shown that the racial difference in survival rate is affected by multiple factors, such as receiving of guideline care, socioeconomic status, medical comorbidities, genetic differences, lifestyle, diet and more. It has been reported that black women are more likely to be diagnosed at advanced stages, less likely to receive guideline care (surgery and chemotherapy), and more likely to have comorbidities (Bristow et al., 2013), (Long et al., 2015), (Howell et al., 2013), (Srivastava et al., 2017), (Chase et al., 2012). However, after controlling for access to quality care, socioeconomic status, cancer stage and treatment, there was no difference in ovarian cancer survival between black and white women (Collins et al., 2014), (Terplan et al., 2008).
Contrary to well-studied racial disparities, there are few studies on regional differences in ovarian cancer that may be considered as a critical moderator to explain the unequal outcomes of the healthcare system. One study reported that ovarian cancer incidence rates were different among the four regions in the United States (Northeast, Midwest, West and South), showing the lower incidence rate for all races combined in the South than in any of the other 3 regions (Hall et al., 2003). Another study reported that the areas with the lowest rates of cancer-directed surgery were likely to be in more remote locations, addressing some relevance of the regional disparities to ovarian cancer mortality (Fairfield et al., 2010). Also, geographic proximity to high volume hospitals and travel distance to receive treatment were significantly associated with adherence to guideline care for advanced-stage ovarian cancer patients (Bristow et al., 2014a). Bristow, et al, reported the relationship between low SES and more limited access to high volume of healthcare and assumed disparities in ovarian cancer survival associated with race and SES resulted from unequal access to care (Bristow et al., 2014a). Hodeib and colleagues (Hodeib et al., 2015) also found the low SES was a significant and independent predictor of deviation from the NCCN guidelines for surgery, chemotherapy, and overall treatment in their study on patients with early-stage ovarian cancer.
Regional and racial/ethnic disparities in health outcomes are often associated with socioeconomic factors (Long et al., 2015), (Chase et al., 2012), (Collins et al., 2014). Black race and low SES were independently associated with an increased likelihood of treatment non-adherent to guidelines (Bristow et al., 2014b) (Bristow et al., 2015). The US Census Bureau reported in its annual population report on income and poverty that the South region continues to have the lowest median income and the highest poverty rate relative to the other regions (Chase et al., 2012). Considering the disproportionate number of African Americans in the South, geographic variations may be resulted from the combined effects of race and region on the outcomes of ovarian cancer that specifically living in the South is associated with greater racial disparity in ovarian cancer incidence and survival. Therefore, this study aimed to investigate the association between geographic regions and ovarian cancer disparities in the United States.
MATERIALS AND METHODS
Data from the Surveillance, Epidemiology, and End Results (SEER) 18 Program (2000–2014) was used that covered 28% of the US population. The SEER program collects data on patient demographics, primary tumor site, tumor morphology and stage at diagnosis, first course of treatment, and follow- up for vital status, supported by the National Cancer Institute. SEER 18 registries cover approximately 28% of the newly diagnosed cancer patients in the United States.
To compare regional differences, we divided the 18 registries into two groups: South region and US14 region. The registries included in the South region are: Louisiana; Metropolitan Atlanta, Georgia; Rural Georgia; and Greater Georgia. The registries included in the US14 region are: Connecticut; Hawaii; Iowa; New Mexico; Utah; California excluding San Francisco, San Jose-Monterey, and Los Angeles; Kentucky; New Jersey; San Francisco-Oakland Metropolitan Statistical Area, California; Metropolitan Detroit, Michigan; Seattle (Puget Sound), Washington; San Jose-Monterey, California; Los Angeles, California; and Alaska Natives.
Only non-Hispanic white (NHW) and non-Hispanic black (NHB) women were included in this analysis. Ovarian cancer stages were identified according to the 3rd and 6th editions of staging manual of American Joint Committee on Cancer (AJCC) and compared at stages: 0, I, II, III, IV, and unstaged. The stages were also combined into three groups: Stage 0-II (non-advanced stage), Stage III-IV (advanced stage), and unstaged. Insurance status includes two categories: insured (including any Medicaid and insured) and uninsured. Age-adjusted incidence rates and mortality rates were calculated by SEER*STAT. Incidence under 25 cases and mortality under 15 cases are suppressed. Five-year survival rates were calculated by SAS 9.2. Chi-Square tests were performed when comparing proportions. A logistic regression model was built to evaluate the association between 5-year survival and other variables: age, cancer stage, and health insurance. The Sidak adjusted log-rank test was applied to compare multiple survival curves. The Cox proportional hazards model was used to estimate hazard ratios.
RESULTS
A total of 43,637 women with ovarian cancer were included in this study. 36,182 were in US14 region and 7,455 were in the South region (Table 1). Among the women in the US14 region, 33,813 (93.4%) were non-Hispanic white (US14-NHW) and 2,369 (6.6 %) were non-Hispanic black (US14-NHB). In the South region, 5,834 (78.3%) were non-Hispanic white (South-NHW) and 1,621 (31.7%) were non-Hispanic black (South-NHB) (Table 2). Average age at diagnosis in the US14 region was 63.4, which was older than 62.5 in the South region (p<0.0001). There was no significant difference between age at diagnosis for both races living in the US14 or the South region (NHW: p=0.15 and NHB: p=0.22).
Table 1.
Patient characteristics by region.
| Characteristics | Total (N=43,637) | Region | p-value | ||
|---|---|---|---|---|---|
| US14 (N=36,182) | South (N=7,455) | ||||
| Age at diagnosis (%) | |||||
| Mean (SD) | 63.3 (15.8) | 63.4 (15.7) | 62.5 (15.9) | <0.0001 | |
| Median (IQR) | 64.0 (53,76) | 64 (53, 76) | 63 (52, 75) | ||
| > 65 | 21,034 (48.2) | 48.4% | 47.0% | 0.03 | |
| < 65 | 22,603 (51.8) | 51.6% | 53.0% | ||
| Cancer stage (%) | <0.0001 | ||||
| 0 | 81 (0.2) | 68 (0.2) | 13 (0.2) | ||
| I | 8,447 (19.6) | 7,062 (19.8) | 1,385 (18.9) | ||
| II | 3,001 (7.0) | 2,441 (6.8) | 560 (7.6) | ||
| III | 13,008 (30.2) | 10,779 (25.3) | 2,229 (30.4) | ||
| IV | 11,036 (25.7) | 9,028 (25.3) | 2,008 (27.4) | ||
| Unstaged | 7,445 (17.3) | 6,302 (17.7) | 1,143 (15.6) | ||
| Grouped Cancer stage (%) | <0.0001 | ||||
| Stage 0–II | 11,529 (26.8) | 9,571 (26.8) | 1,958 (26.7) | ||
| Stage III–IV | 24,044 (55.9) | 19,807 (55.5) | 4,237 (57.7) | ||
| Unstaged | 7,445 (17.3) | 6,302 (17.7) | 1,143 (15.6) | ||
| Surgery | <0.0001 | ||||
| Yes | 32,786 (75.7) | 27,347 (76.2) | 5,439 (73.4) | ||
| No | 10,529 (24.3) | 8,558 (23.8) | 1,971 (26.6) | ||
| Insurance (%) ‡ | |||||
| Insured | 8,703 (96.6) | 7,154 (97.3) | 1,549(93.4) | ||
| Uninsured | 306 (3.4) | 197 (2.7) | 109 (6.6) | ||
| 5-year survival◊ | <0.0001 | ||||
| Yes | 17,331 (39.7) | 14,575 (40.3) | 2,756 (37.0) | ||
| No | 26,306 (60.3) | 21,607 (59.7) | 4,699 (63.0) | ||
Only available for cases diagnosed after 2007
Table 2.
Patient characteristics by region and race (2000–2008).
| Characteristics | Total (N=43,637) | White (N=39,647) | Black (N=3,990) | ||||
|---|---|---|---|---|---|---|---|
| US14 (N=33,813) | South (N=5,834) | p-value | US14 (N=2,369) | South (N=1,621) |
p-value | ||
| Age at diagnosis (%) | |||||||
| Mean (SD) | 63.3 (15.8) | 63.6 (15.6) | 63.3 (15.2) | 0.15 | 60.2 (16.8) | 59.5 (17.6) | 0.22 |
| Median (IQR) | 64.0 (53,76) | 64 (53, 76) | 64 (54, 75) | 61 (49, 73) | 60 (49, 73) | ||
| ≥ 65 | 21,034 (48.2) | 16,521 (48.9) | 2,847 (48.8) | 0.93 | 1,006 (42.5) | 660 (40.7) | 0.27 |
| < 65 | 22,603 (51.8) | 17,292 (51.1) | 2,987 (51.2) | 1,363 (57.5) | 961 (59.3) | ||
| Cancer stage (%) | 0.0009 | 0.01 | |||||
| 0 | 81 (0.2) | 65 (0.2) | 9 (0.2) | 3 (0.1) | 4 (0.3) | ||
| I | 8,447 (19.6) | 6,648 (19.9) | 1,104 (19.2) | 414 (17.9) | 281 (17.7) | ||
| II | 3,001 (7.0) | 2,298 (6.9) | 450 (7.8) | 143 (6.2) | 110 (6.9) | ||
| III | 13,008 (30.2) | 10,220 (30.6) | 1,795 (31.2) | 559 (24.2) | 434 (27.4) | ||
| IV | 11,036 (25.7) | 8,283 (24.8) | 1,493 (26.0) | 745 (32.3) | 515 (32.5) | ||
| Unstaged | 7,445 (17.3) | 5,856 (17.6) | 902 (15.7) | 446 (19.3) | 241 (15.2) | ||
| Grouped Cancer stage (%) | 0.002 | 0.004 | |||||
| Stage 0–II | 11,529 (26.8) | 9,011 (27.0) | 1,563 (27.2) | 560 (24.2) | 395 (24.9) | ||
| Stage III–IV | 24,044 (55.9) | 18,503 (55.5) | 3,288 (57.2) | 1,304 (56.5) | 949 (59.9) | ||
| Unstaged | 7,445 (17.3) | 5,856 (17.6) | 902 (15.7) | 446 (19.3) | 241 (15.2) | ||
| Surgery | 0.13 | 0.51 | |||||
| Yes | 32,786 (75.7) | 25,822 (77.0) | 4,413 (76.1) | 1,525 (64.8) | 1,026 (63.8) | ||
| No | 10,529 (24.3) | 7,731 (23.0) | 1,389 (23.9) | 827 (35.2) | 528 (36.2) | ||
| Insurance (%) ‡ | <0.0001 | 0.02 | |||||
| Insured | 8,703 (96.6) | 6,654 (97.6) | 1,229 (94.6) | 500 (93.6) | 320 (89.1) | ||
| Uninsured | 306 (3.4) | 163 (2.4) | 70 (5.4) | 34 (6.37) | 39 (10.9) | ||
| 5-year survival◊ | 0.0004 | 0.5 | |||||
| Yes | 17,331 (39.7) | 13,787 (40.8) | 2,235 (38.3) | 788 (33.3) | 521 (32.1) | ||
| No | 26,306 (60.3) | 20,026 (59.2) | 3,599 (61.7) | 1,581 (66.7) | 1,100 (67.9) | ||
Only available for cases diagnosed after 2007
Over half of the women in this data (55.9%) were diagnosed with advanced ovarian cancer stage (stage III and IV). Women in the South region were more likely to be diagnosed at an advanced stage (57.7% vs. 55.5%, p<0.0001). This result was consistent within each race (57.2% vs. 55.5% for NHW, p=0.0002; 59.9% vs. 56.5% for NHB, p=0.004). NHW and NHB had different regional differences in cancer stage distributions: South-NHW had higher proportion in stage IV compared to US14-NHW (26.0% vs. 24.8%), whereas South-NHB had higher proportion in stage III compared to US14-NHB (27.4% vs. 24.2%). In addition, the South region had lower proportion of unstaged patients (15.7% vs. 17.6 for NHW and 15.2% vs. 19.3% for NHB).
Overall, there were 75.7% ovarian cancer patients who had any surgery on the primary cancer site. Women in the US14 region were more likely to have surgery compared to women in south region (76.2% vs. 73.4%, p<0.0001). There were no significant regional differences comparing the US14 region with the South region within each race, (NHW: 76.1% vs. 77.0%, p=0.13; NHB: 64.8% vs. 63.8%, p=0.51).
In SEER data, insurance information was only available for patients diagnosed in 2007 and after. Among a total of 96.6% women who were insured, women in the South region were less likely to have insurance (93.4% vs. 97.3%, p<0.0001). US14-NHW and US14-NHB had a higher proportion of being insured than South-NHW and South-NHB (97.6% vs. 94.6%, p<0.0001; 93.6% vs. 89.1%, p=0.02, respectively). The overall 5-year survival rate was 39.7% from 2000–2008. The South region had a significantly lower 5-year survival rate than the US14 region (37.0% vs. 40.3%, p<0.0001). The 5-year survival rate of South-NHW was significantly lower than that of US14-NHW (38.3% vs. 40.8%, p=0.0004). South-NHB had the lowest 5-year survival rate (32.1%).
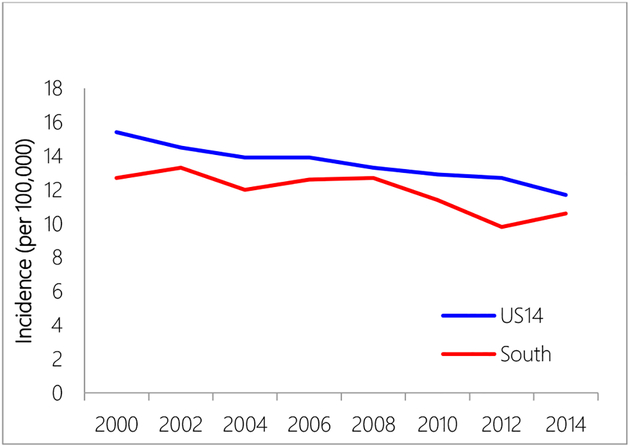
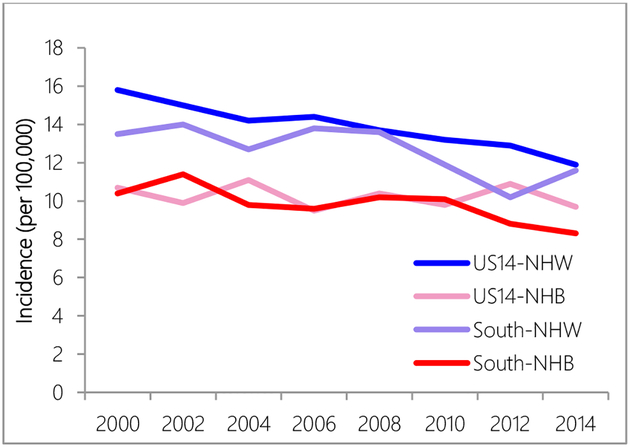
The South region constantly had lower age-adjusted incidence rates than the US14 region during the study period 2000–2014 (2000: 12.7 vs. 15.4, per 100,000; 2014: 10.6 vs. 11.7, per 100,000) (Figure 1). White women (US14-NHW and South-NHW) had higher incidence rates than black women (US14-NHB and South-NHB) (Figure 2). While NHW in US14 had higher incidence rates than NHW in South, NHB in US14 region and NHB in the South region had similar incidence rates except for years after 2010, when NHB in the US14 started to have higher incidence rates than NHB in the South region.
Figure 1.
Incidence rate comparison between US14 and South region.
Figure 2.
Incidence rate comparison between US14 and South region by race.
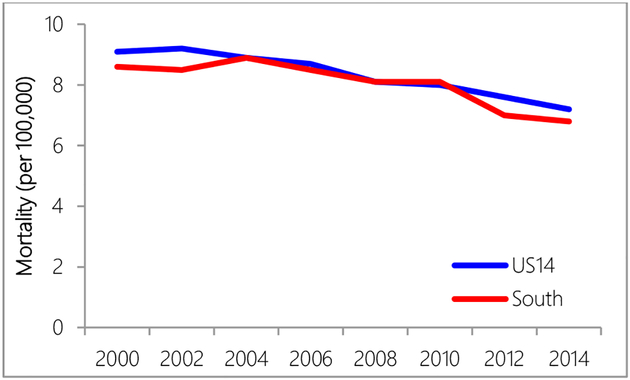
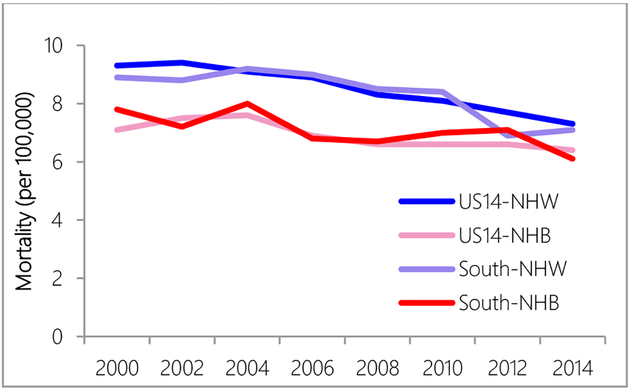
Regional differences in mortality rates were observed in years 2000 to 2004 and years 2010 to 2014, when the US14 region had higher mortality rates than the South region (Figure 3). NHW women had higher mortality rates than NHB women over all years (Figure 4).
Figure 3.
Mortality rate comparison between US14 and South region.
Figure 4.
Mortality rate comparison between US14 and South region by race.
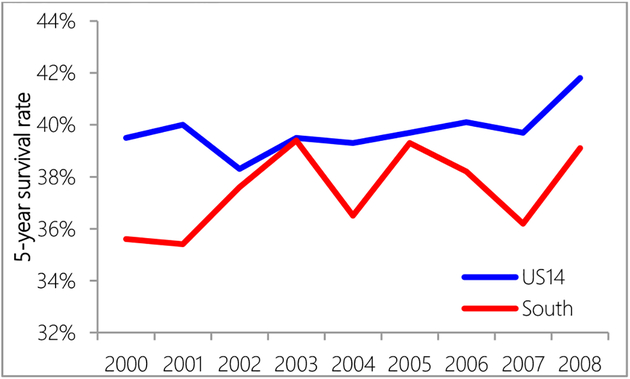
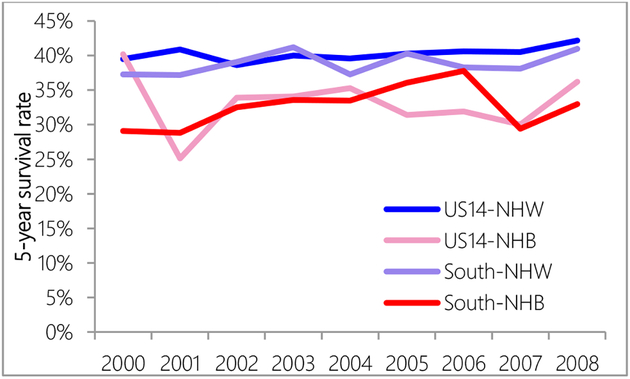
The US14 region had higher 5-year survival than the South region (Figure 5). Compared with the US14 region, 5-year survival rates in the South region were very unsteady. NHW women had higher 5-year observed survival rates than NHB women (Figure 6). A logistic regression model showed that after controlling for surgery, women in the South region were still 1.4 times more likely to die 5-years after diagnosis (95% CI: 1.2–1.6). Controlling for age, race, cancer stage and insurance, women in the South region were 1.2 times less likely to receive surgery (95% CI: 1.03–1.4).
Figure 5.
Five-year survival rate comparison between US14 and South region.
Figure 6.
Five-year survival rate comparison between US14 and South region by race.
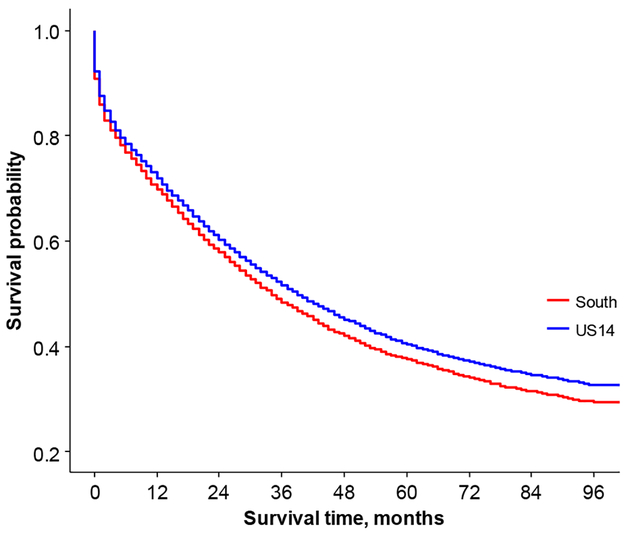
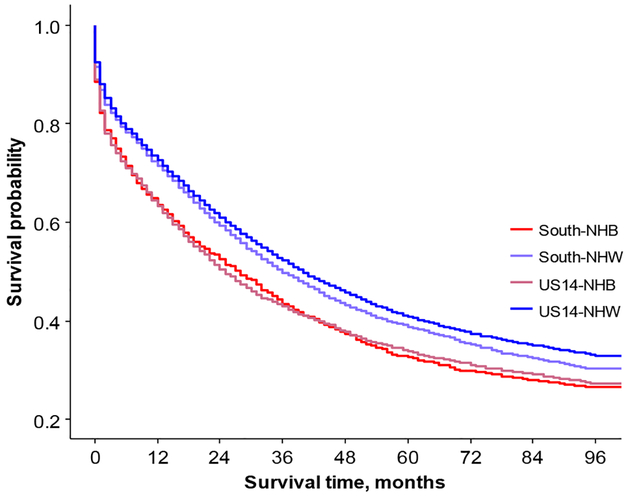
Women in the South region had significantly shorter survival times than women in the US14 region (Figure 7). NHW in the US14 region had significantly longer survival time compared to NHW in the South region, NHB in the US14 region, and NHB in South region (p<0.0001 for all three comparisons, Figure 8). After adjusting for surgery, compared with the US14 region, the hazard ratio of death for the South region was 2.6 times higher for age group 20–34 (95% CI: 1.4–4.9), 1.5 times higher for age group 45–54 (95% CI: 1.2–1.8), 1.4 times higher for age group 75–84 (95% CI: 1.2–1.6), and 1.3 times higher for women older than 84 years old (95% CI: 1.1–1.7) (Table 3).
Figure 7.
Overall survival comparison between US14 and South region.
Figure 8.
Overall survival comparison between US14 and South region by race.
Table 3.
Hazard ratio of death comparing the South region to the US14 region for patients who had surgery.
| HR | 95% CI | |
|---|---|---|
| Age | ||
| ≤ 20 | 2.076 | (0.106, 40.485) |
| 20–34 | 2.567* | (1.351, 4.879) |
| 35–44 | 1.304 | (0.945, 1.789) |
| 45–54 | 1.472* | (1.223, 1.771) |
| 55–64 | 1.048 | (0.908, 1.208) |
| 65–74 | 1.054 | (0.911, 1.220) |
| 75–84 | 1.363* | (1.162, 1.599) |
| ≥ 84 | 1.341* | (1.052, 1.709) |
p<0.05
DISCUSSION
The racial disparities among women with ovarian cancer in the United States are well-known. However, not much research has been done on the regional differences of this lethal disease. One study published in 2003 confirmed that the ovarian cancer incidence rate varied among the four regions in the United States: Northeast, Midwest, West and South (Hall et al., 2003). They found that black women in the South region had the second lowest incidence rates (10 per 100,000), compared with 9.7 for the black women in the West region. Their comparisons were limited to incidence rates only.
Results from this study confirmed that regional differences existed in incidence rates, with the South region having the lower incidence rate (12.0 vs. 13.4, per 100,000 2000–2014) compared to the US14 region (data not shown). Additionally, regional variation in 5-year survival (37.5% vs. 39.8%, 2000–2014) and overall survival (Figure 5) was identified. The association between survival and age at diagnosis, race, region, cancer stage, surgery and health insurance was further analyzed. The results indicated that women with ovarian cancer in the South region had significantly poorer survival compared to the US14 region. Especially, among white women, those who live in the South region had worse survival outcome.
Black women were known to have lower incidence rates, lower mortality rates, and lower survival than white women (Howell et al., 2013; Srivastava et al., 2017); (Moorman et al., 2009); (Kim et al., 2010); (Chan et al., 2008); (Terplan, 2012); (Park et al., 2017; Stewart et al., 2017). Ross and colleagues reported a survival disadvantage was still observed in black women with ovarian cancer in the deep South after controlling for clinical and environmental factors (Ross et al., 2017).
Rationale behind these racial disparities is acknowledged to be multifaceted and intertwined. Black women tend to be diagnosed at advanced cancer stages, and were less likely to receive standard treatment, including surgery and chemotherapy, according to the guideline (Barber et al., 2017; Bristow et al., 2013; Howell et al., 2013; Kim et al., 2010; Terplan et al., 2012). Disparities in ovarian cancer treatment and survival persisted, resulting in black women, even among women with equal access to care, experiencing poorer survival (Bandera et al., 2016).
Therefore, the higher proportion of black population in the South region (21.7% in the South, 6.5% in the US14 region) may partially contribute to the regional differences in incidence and mortality rates, and survival. However, region was identified as an independent predictor of ovarian cancer survival, too. For example, after accounting for race, age, cancer stage, insurance and surgery, women in the South region were still 1.4 times more likely to die 5-years after diagnosis. Also women in the South region were 1.2 times less likely to receive surgery.
Socioeconomic status (SES) is also important factor which affects health outcomes. According to the 2014 Report of Income and Poverty in the United States from the US Department of Commerce, the South region (including Georgia and Louisiana) had the lowest income and highest poverty rate among the regions in the United States (Northeast, Midwest, West and South). Studies have shown that lower SES status is associated with lower insurance participating rates, limited access to high volume hospitals, and poorer survival in ovarian cancer (Brewer et al., 2015; Bristow et al., 2015). We identified the South region had lower insurance participating rate and lower surgery rate, compared to the US14 region, which are consistent with these findings resulting in worse survival. As another factor that may contribute to these regional disparities, regional differences in numbers and distributions of high volume hospitals and surgeons need to be considered. For example, density of oncology hospitals could affect chemotherapy use (Polsky et al., 2006).
Further study is needed to identify possible reasons for unsteady 5-year survival rates in the South region, especially what factors contribute to increasing 5-survival rates in this region. This may help identify possible solutions to decrease regional disparities in Ovarian Cancer in the United States.
This study has some limitations related to data used for analysis. The SEER research data did not provide the information on insurance and SES, thus the analysis in this study was limited and could not be done to analyze the impact of insurance status in detail and the association between SES status and other variables.
Acknowledgements
This article was partially supported by the National Cancer Institute (P30 CA013148, 2U54 CA118948), National Institute on Minority Health and Health Disparities (U54MD008176) The contents of this article are solely the responsibility of the authors and do not necessarily represent the official views of the funding agency, NIH.
Footnotes
Conflict of interest statement
The author has declared that no competing or conflict of interests exist. The funders had no role in study design, writing of the manuscript and decision to publish.
REFERENCES
- ACS (2014). Cancer Facts & Figures 2014 (Atlanta: American Cancer Society; ). [Google Scholar]
- Bandera EV, Lee VS, Rodriguez-Rodriguez L, Powell CB, and Kushi LH (2016). Racial/Ethnic Disparities in Ovarian Cancer Treatment and Surviva. Clin Cancer Res 22, 5909–5914. [DOI] [PMC free article] [PubMed] [Google Scholar]
- Barber EL, Dusetzina SB, Stitzenberg KB, Rossi EC, Gehrig PA, Boggess JF, and Garrett JM (2017). Variation in neoadjuvant chemotherapy utilization for epithelial ovarian cancer at high volume hospitals in the United States and associated survival. Gynecologic oncology 145, 500–507. [DOI] [PMC free article] [PubMed] [Google Scholar]
- Brewer KC, Peterson CE, Davis FG, Hoskins K, Pauls H, and Joslin CE (2015). The influence of neighborhood socioeconomic status and race on survival from ovarian cancer: a population-based analysis of Cook County, Illinois. Annals of epidemiology 25, 556–563. [DOI] [PMC free article] [PubMed] [Google Scholar]
- Bristow RE, Chang J, Ziogas A, Anton-Culver H, and Vieira VM (2014a). Spatial analysis of adherence to treatment guidelines for advanced-stage ovarian cancer and the impact of race and socioeconomic status. Gynecologic oncology 134, 60–67. [DOI] [PMC free article] [PubMed] [Google Scholar]
- Bristow RE, Chang J, Ziogas A, Campos B, Chavez LR, and Anton-Culver H (2015). Sociodemographic disparities in advanced ovarian cancer survival and adherence to treatment guidelines. Obstetrics and gynecology 125, 833–842. [DOI] [PMC free article] [PubMed] [Google Scholar]
- Bristow RE, Chang J, Ziogas A, Randall LM, and Anton-Culver H (2014b). High-volume ovarian cancer care: survival impact and disparities in access for advanced-stage disease. Gynecol Oncol 132, 403–410. [DOI] [PubMed] [Google Scholar]
- Bristow RE, Powell MA, Al-Hammadi N, Chen L, Miller JP, Roland PY, Mutch DG, and Cliby WA (2013). Disparities in ovarian cancer care quality and survival according to race and socioeconomic status. Journal of the National Cancer Institute 105, 823–832. [DOI] [PMC free article] [PubMed] [Google Scholar]
- CDC. Ovarian Cancer Trends (Centers for Disease Control and Prevention; ). [Google Scholar]
- Chan JK, Zhang M, Hu JM, Shin JY, Osann K, and Kapp DS (2008). Racial disparities in surgical treatment and survival of epithelial ovarian cancer in United States. Journal of surgical oncology 97, 103–107. [DOI] [PubMed] [Google Scholar]
- Chase DM, Fedewa S, Chou TS, Chen A, Ward E, and Brewster WR (2012). Disparities in the allocation of treatment in advanced ovarian cancer: are there certain patient characteristics associated with nonstandard therapy? Obstetrics and gynecology 119, 68–77. [DOI] [PubMed] [Google Scholar]
- Collins Y, Holcomb K, Chapman-Davis E, Khabele D, and Farley JH (2014). Gynecologic cancer disparities: a report from the Health Disparities Taskforce of the Society of Gynecologic Oncology. Gynecologic oncology 133. [DOI] [PMC free article] [PubMed] [Google Scholar]
- Fairfield KM, Lucas FL, Earle CC, Small L, Trimble EL, and Warren JL (2010). Regional variation in cancer-directed surgery and mortality among women with epithelial ovarian cancer in the Medicare population. Cancer 116, 4840–4848. [DOI] [PubMed] [Google Scholar]
- Hall HI, Tung KH, Hotes J, and Logan P (2003). Regional variations in ovarian cancer incidence in the United States, 1992–1997. Cancer 97, 2701–2706. [DOI] [PubMed] [Google Scholar]
- Hodeib M, Chang J, Liu F, Ziogas A, Dilley S, Randall LM, Anton-Culver H, and Bristow RE (2015). Socioeconomic status as a predictor of adherence to treatment guidelines for early-stage ovarian cancer. Gynecol Oncol 138, 121–127. [DOI] [PMC free article] [PubMed] [Google Scholar]
- Howell EA, Egorova N, Hayes MP, Wisnivesky J, Franco R, and Bickell N (2013). Racial disparities in the treatment of advanced epithelial ovarian cancer. Obstetrics and gynecology 122, 1025–1032. [DOI] [PMC free article] [PubMed] [Google Scholar]
- Kim S, Dolecek TA, and Davis FG (2010). Racial differences in stage at diagnosis and survival from epithelial ovarian cancer: a fundamental cause of disease approach. Social science & medicine 71, 274–281. [DOI] [PMC free article] [PubMed] [Google Scholar]
- Long B, Chang J, Ziogas A, Tewari KS, Anton-Culver H, and Bristow RE (2015). Impact of race, socioeconomic status, and the health care system on the treatment of advanced-stage ovarian cancer in California. American journal of obstetrics and gynecology 212, e461–469. [DOI] [PubMed] [Google Scholar]
- Moorman PG, Palmieri RT, Akushevich L, Berchuck A, and Schildkraut JM (2009). Ovarian cancer risk factors in African American and white women. American journal of epidemiology 170, 598–606. [DOI] [PMC free article] [PubMed] [Google Scholar]
- OCRFA. Statistics (Ovarian Cancer Research Fund Alliance; ). [Google Scholar]
- Park HK, Ruterbusch JJ, and Cote ML (2017). Recent Trends in Ovarian Cancer Incidence and Relative Survival in the United States by Race/Ethnicity and Histologic Subtypes. Cancer Epidemiol Biomarkers Prev 26. [DOI] [PMC free article] [PubMed] [Google Scholar]
- Polsky D, Armstrong KA, Randall TC, Ross RN, Even-Shoshan O, Rosenbaum PR, and Silber JH (2006). Variation in chemotherapy utilization in ovarian cancer: the relative contribution of geography. Health services research 41, 2201–2218. [DOI] [PMC free article] [PubMed] [Google Scholar]
- Ross J, Braswell KV, Madeira da Silva L, Mujica F, Stutsman S, Finan MA, Nicolson W, Harmon MD, Missanelli M, Cohen A, et al. (2017). Unraveling the etiology of ovarian cancer racial disparity in the deep south: Is it nature or nurture?. Gynecol Oncol 145, 329–333. [DOI] [PubMed] [Google Scholar]
- Srivastava SK, Ahmad A, Miree O, Patel GK, Singh S, Rocconi RP, and Singh AP (2017). Racial health disparities in ovarian cancer: not just black and white. Journal of ovarian research 10, 58. [DOI] [PMC free article] [PubMed] [Google Scholar]
- Stewart SL, Harewood R, Matz M, Rim SH, Sabatino SA, Ward KC, and Weir H (2017). Disparities in ovarian cancer survival in the United States (2001–2009): Findings from the CONCORD-2 study. Cancer 123, 5138–5159. [DOI] [PMC free article] [PubMed] [Google Scholar]
- Terplan M, Schluterman N, McNamara EJ, Tracy JK, and Temkin SM (2012). Have racial disparities in ovarian cancer increased over time? An analysis of SEER data. Gynecologic oncology 125, 19–24. [DOI] [PubMed] [Google Scholar]
- Terplan M, Temkin S, Tergas A, and Lengyel E (2008). Does equal treatment yield equal outcomes? The impact of race on survival in epithelial ovarian cancer. Gynecologic oncology 111, 173–178. [DOI] [PMC free article] [PubMed] [Google Scholar]


