Summary paragraph
There is an urgent need to create novel models using human disease-relevant cells to study SARS-CoV-2 biology and to facilitate drug screening. As SARS-CoV-2 primarily infects the respiratory tract, we developed a lung organoid model using human pluripotent stem cells (hPSC-LOs). The hPSC-LOs, particularly alveolar type II-like cells, are permissive to SARS-CoV-2 infection, and showed robust induction of chemokines upon SARS-CoV-2 infection, similar to what is seen in COVID-19 patients. Nearly 25% of these patients also have gastrointestinal manifestations, which are associated with worse COVID-19 outcomes1. We therefore also generated complementary hPSC-derived colonic organoids (hPSC-COs) to explore the response of colonic cells to SARS-CoV-2 infection. We found that multiple colonic cell types, especially enterocytes, express ACE2 and are permissive to SARS-CoV-2 infection. Using hPSC-LOs, we performed a high throughput screen of FDA-approved drugs and identified entry inhibitors of SARS-CoV-2, including imatinib, mycophenolic acid (MPA), and quinacrine dihydrochloride (QNHC). Treatment at physiologically relevant levels of these drugs significantly inhibited SARS-CoV-2 infection of both hPSC-LOs and hPSC-COs. Together, these data demonstrate that hPSC-LOs and hPSC-COs infected by SARS-CoV-2 can serve as disease models to study SARS-CoV-2 infection and provide a valuable resource for drug screening to identify candidate COVID-19 therapeutics.
The development of anti-SARS-CoV-2 drugs could change the scope of the ongoing COVID-19 pandemic. While this strategy is being pursued, high throughput screens are typically performed in transformed cell lines which fail to capture the physiologically relevant dynamics of human SARS-CoV-2 infection. To overcome limitations of these cell lines, several adult organoid models have been developed to study SARS-CoV-22–4. Here, we developed human pluripotent stem cell-derived lung and colonic organoids (hPSC-LOs and hPSC-COs) optimized as in vitro platforms for high throughput drug screening.
hPSC-LOs are permissive to SARS-CoV-2.
We differentiated hPSCs to lung organoids (hPSC-LOs) based on previously reported stepwise strategies5–13 (Extended Data Fig. 1a–1c). qRT-PCR and RNA-seq profiling validates the expression of alveolar type II (AT2) cell markers in the hPSC-LOs (Extended Data Fig. 1d, 1e). Intra-cellular flow cytometry further confirmed the presence of Pro-SP-C+ cells in hPSC-LOs (Extended Data Fig. 1f). Single cell transcriptomic profiles of hPSC-LOs identified AT2-like cells, which were enriched for adult human lung AT2 cell markers (Fig. 1a–1c and Extended Data Fig. 2a–2c). Correlation analysis of signature genes further validated the AT2-like cell population in hPSC-LOs showing high similarity to adult human lung AT2 cells (Fig. 1d). The key factors involved in SARS-CoV-2 entry, ACE214, the SARS-CoV-2 receptor, TMPRSS214, a protease involved in viral entry, and FURIN15, a pro-protein convertase pre-activating SARS-CoV-2, were enriched in AT2-like cells (Fig. 1e). Immunostaining analysis further validates that ACE2 is expressed in Pro-SP-B+SP-B+Pro-SP-C+SP-C+AT2-like cells (Fig. 1f and Extended Data Fig. 2d).
Figure 1. hPSC-LOs are permissive to SARS-CoV-2 virus infection both in vitro and in vivo.
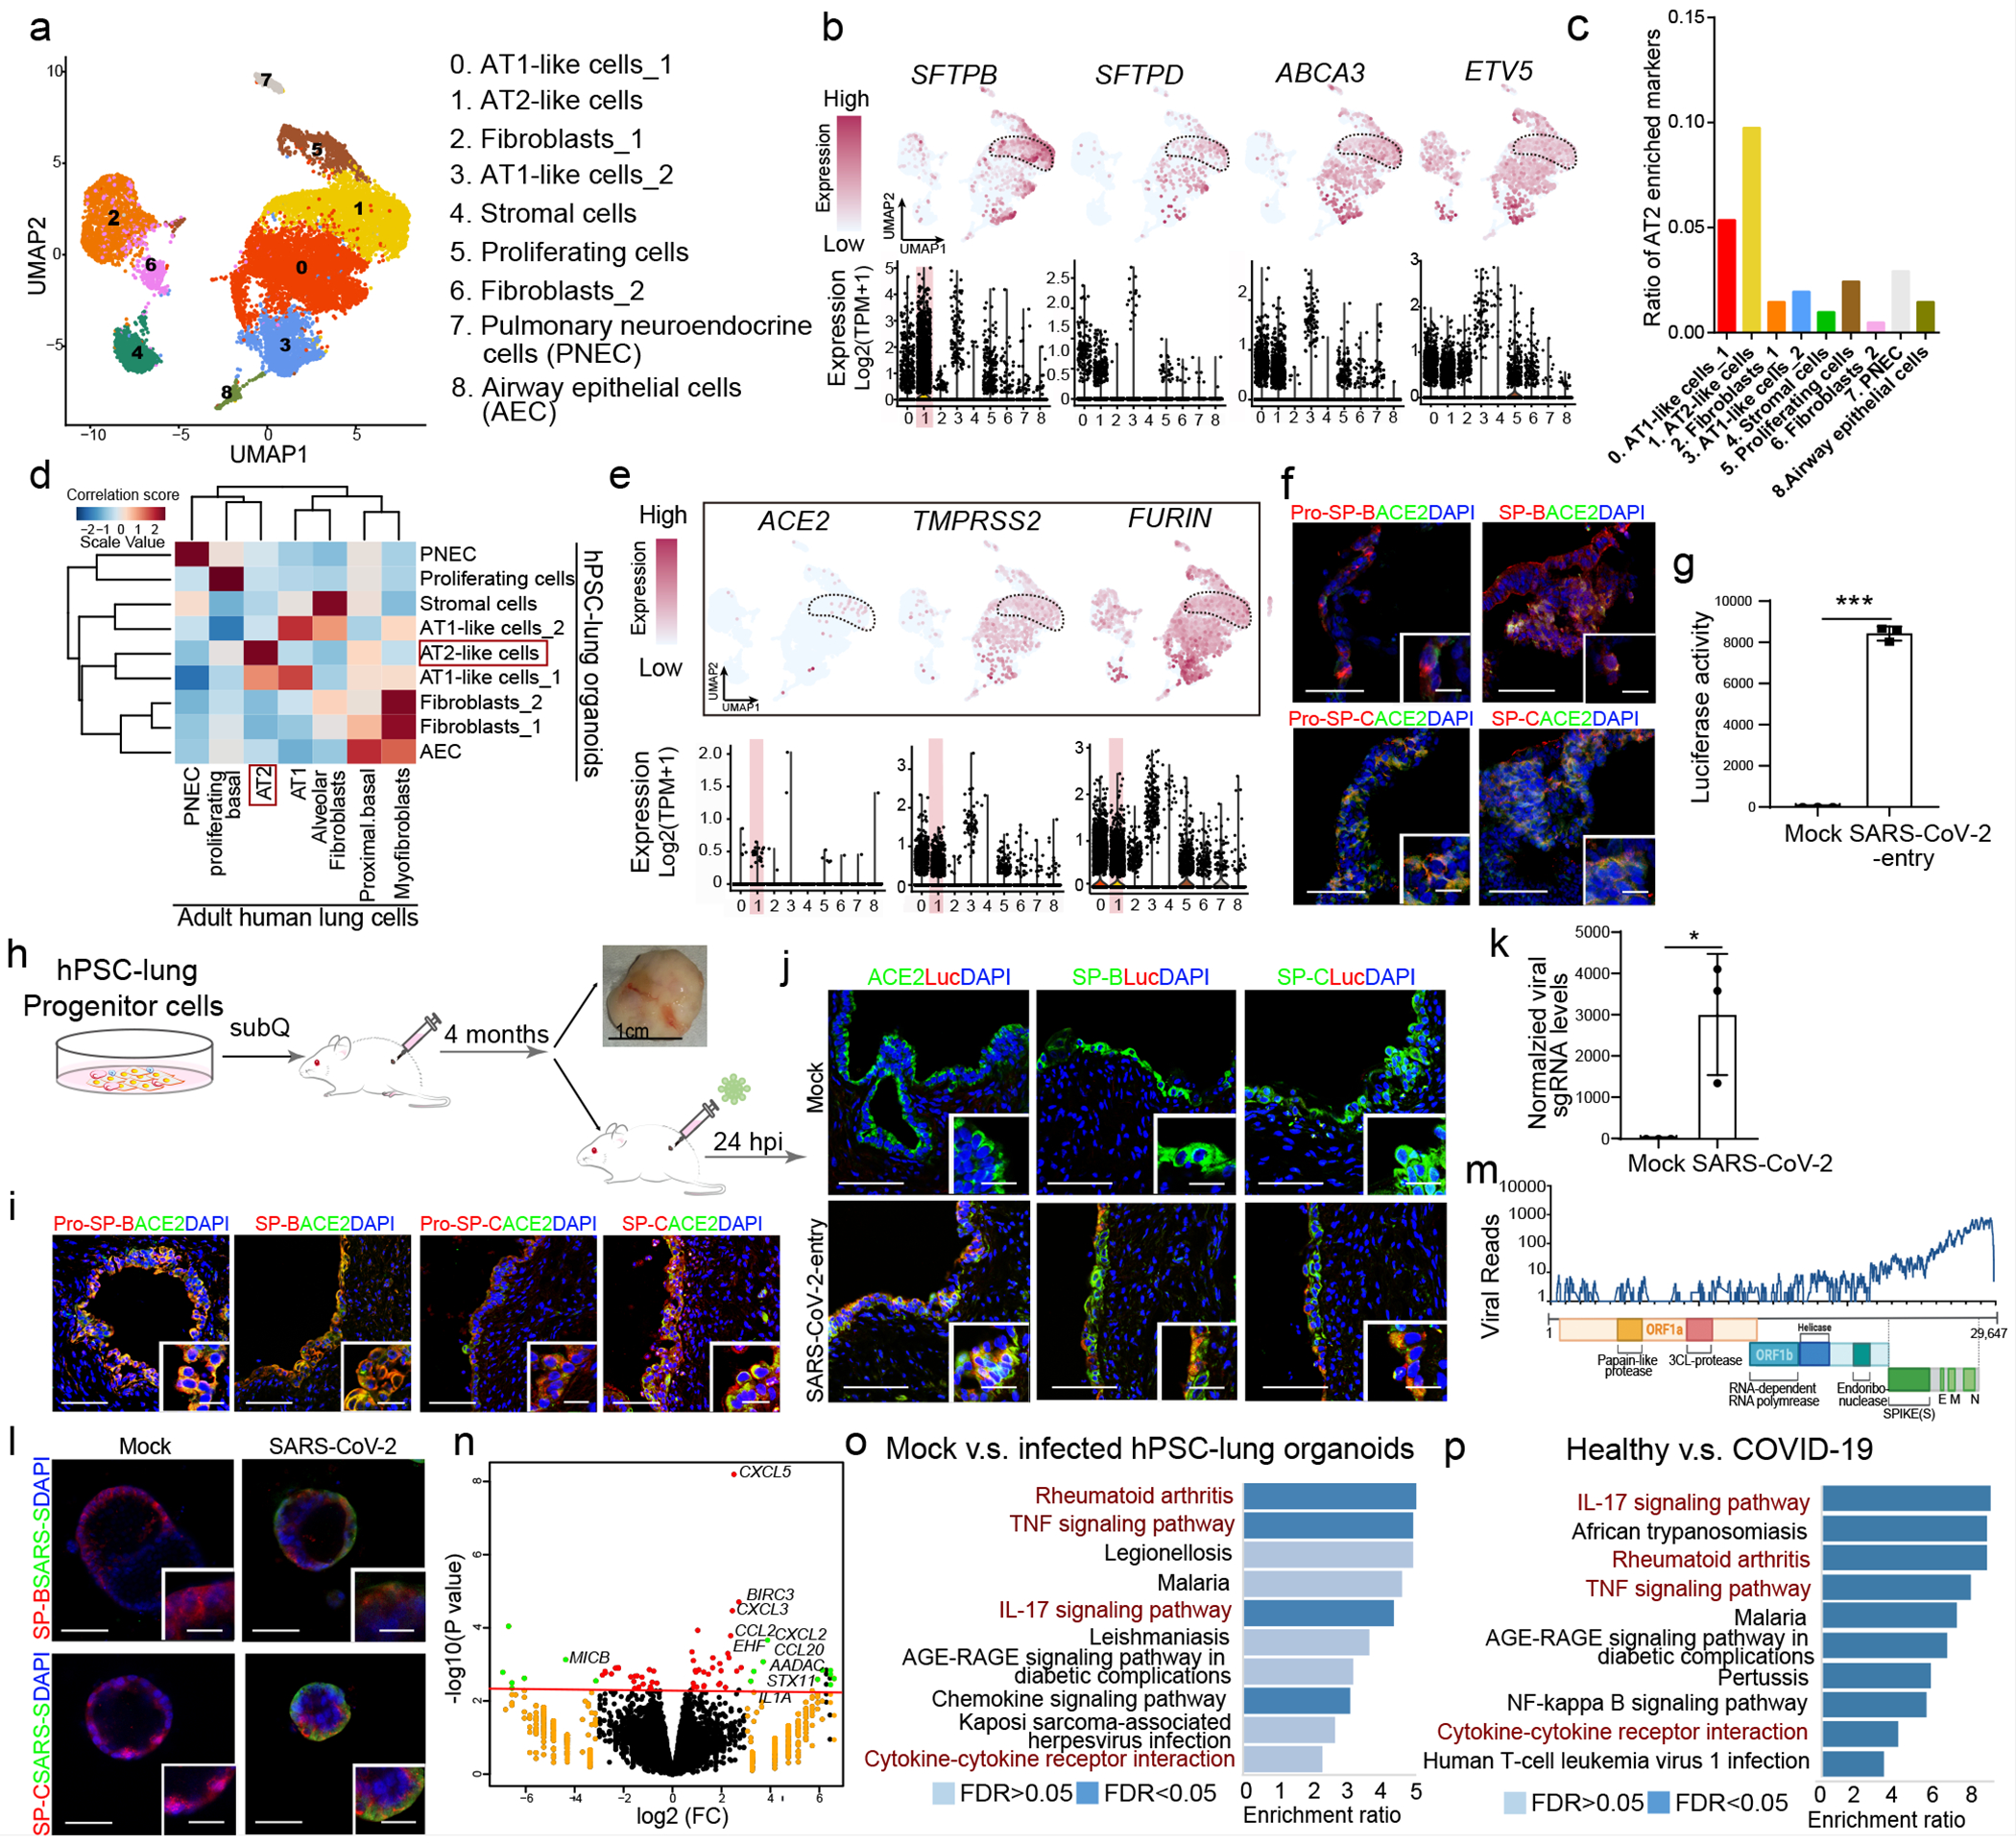
a. UMAP of hPSC-LOs. b. AT2 cell markers in each cluster in UMAPs. c. Enrichment analysis of hPSC-LOs using genes highly expressed in adult human AT2 cells. d. Correlation analysis of genes with cell fates in hPSC-LOs and adult human lung cells. e. UMAP of ACE2, TMPRSS2 and FURIN expression in hPSC-LOs. f. Immunostaining of hPSC-LOs. Scale bars= 30 μm. Microscale bars=10 μm. g. Luciferase activity at 24 hpi of hPSC-LOs either mock-infected or SARS-CoV-2-entry virus infected (MOI=0.01). n=3 biological independent experiments. ***P=1.62E-06. h. Schematic of in vivo transplantation of hPSC-derived lung xenografts. i, Immunostaining of hPSC-derived lung xenografts. Scale bars=75 μm. Microscale bars=10 μm. j, Immunostaining of hPSC-derived lung xenografts at 24 hpi (1X10⁴ FFU). Scale bars= 75 μm. Microscale bars=10 μm. k, qRT-PCR analysis of total RNA extracted from infected hPSC-LOs (24 hpi, MOI=0.01) for viral N sgRNA. n=3 biological independent experiments. *P=0.0236. l, Immunostaining of hPSC-LOs at 24 hpi (SARS-CoV-2, MOI=0.01). Scale bars= 50 μm. Microscale bars=10 μm. m, Alignment of the transcriptome with the viral genome in SARS-CoV-2 infected hPSC-LOs. Schematic below shows the SARS-CoV-2 genome. n, Volcano plot analysis of differential expression of SARS-CoV-2 infected hPSC-LOs versus mock infection. Red line indicates p-adjusted value<0.05. o, Gene over-representation analysis using KEGG pathway database of SARS-CoV-2 infected hPSC-LOs versus mock infection. n=3 biological independent experiments. p. Gene over-representation analysis using KEGG pathway database of lung autopsy tissues from COVID-19 versus healthy patients. n=3 patients for each group. *P < 0.05 and ***P< 0.001. Data were analyzed by an unpaired two-tailed Student’s t-test and shown as mean ± STDEV. Data are representative of at least three independent experiments.
To determine the permissiveness of hPSC-LOs to SARS-CoV-2 entry, we first used a vesicular stomatitis ΔG-luciferase virus pseudo-typed with the SARS-CoV-2 Spike protein (SARS-CoV-2-entry virus)16,17. Robust luciferase activity was readily detected in hPSC-LOs infected with SARS-CoV-2-entry virus (Fig. 1g).
To generate an in vivo model using hPSC-LOs, we subcutaneously implanted lung progenitor cells into immuno-deficient NOD-scid IL2Rgnull (NSG) mice (Fig. 1h). The xenografts developed organized distal lung-like structures with AT2-like cells expressing ACE2 (Fig. 1i). At 24 hours after intra-xenograft inoculation with SARS-CoV-2-entry virus, luciferase was mainly detected in AT2-like cells (Fig. 1j).
Next, hPSC-LOs were infected with SARS-CoV-2 (USA-WA1/2020). At 24 hours post infection (hpi), qRT-PCR confirmed significant amounts of viral replication in infected hPSC-LOs (Fig. 1k). Immunostaining for the Spike protein confirmed robust SARS-CoV-2 infection of hPSC-LOs (Fig. 1l and Extended Data Fig. 2e). The viral infection was further confirmed by RNA-seq analysis (Fig. 1m). Moreover, principle component analysis (PCA) demonstrated that the infected hPSC-LOs occupied a distinct transcriptional space compared to mock-infected hPSC-LOs (Extended Data Fig. 2f). Volcano plots of mock versus SARS-CoV-2 infected hPSC-LOs revealed robust induction of chemokine transcripts (Fig. 1n). Gene set enrichment analysis (GSEA) revealed over-represented pathway networks including rheumatoid arthritis, TNF signaling, IL-17 signaling, and cytokine-cytokine receptor interaction (Fig. 1o), which is similar to the pathways enriched in lung autopsy tissues of COVID-19 patients18 (Fig. 1p, Supplementary Table 1).
hPSC-COs are permissive to SARS-CoV-2.
As gastrointestinal complications are associated with worse outcomes of COVID-19 patients1, we examined whether SARS-CoV-2 can infect colonic cells. First, immunohistochemistry confirmed ACE2 expression in keratin 20 (KRT20)+ enterocytes of human colon tissue (Extended Data Fig. 3a). Pathological analysis of colonoscopy samples from COVID-19 patients detected significant damage to the colon mucosa marked by injury to the luminal epithelial cells and goblet cell depletion (Fig. 2a), SARS-CoV-2 infection was confirmed by in-situ hybridization for viral RNA (Fig. 2b) and by electron microscopy (Fig. 2c).
Figure 2. hPSC-COs are permissive to SARS-CoV-2 virus infection.
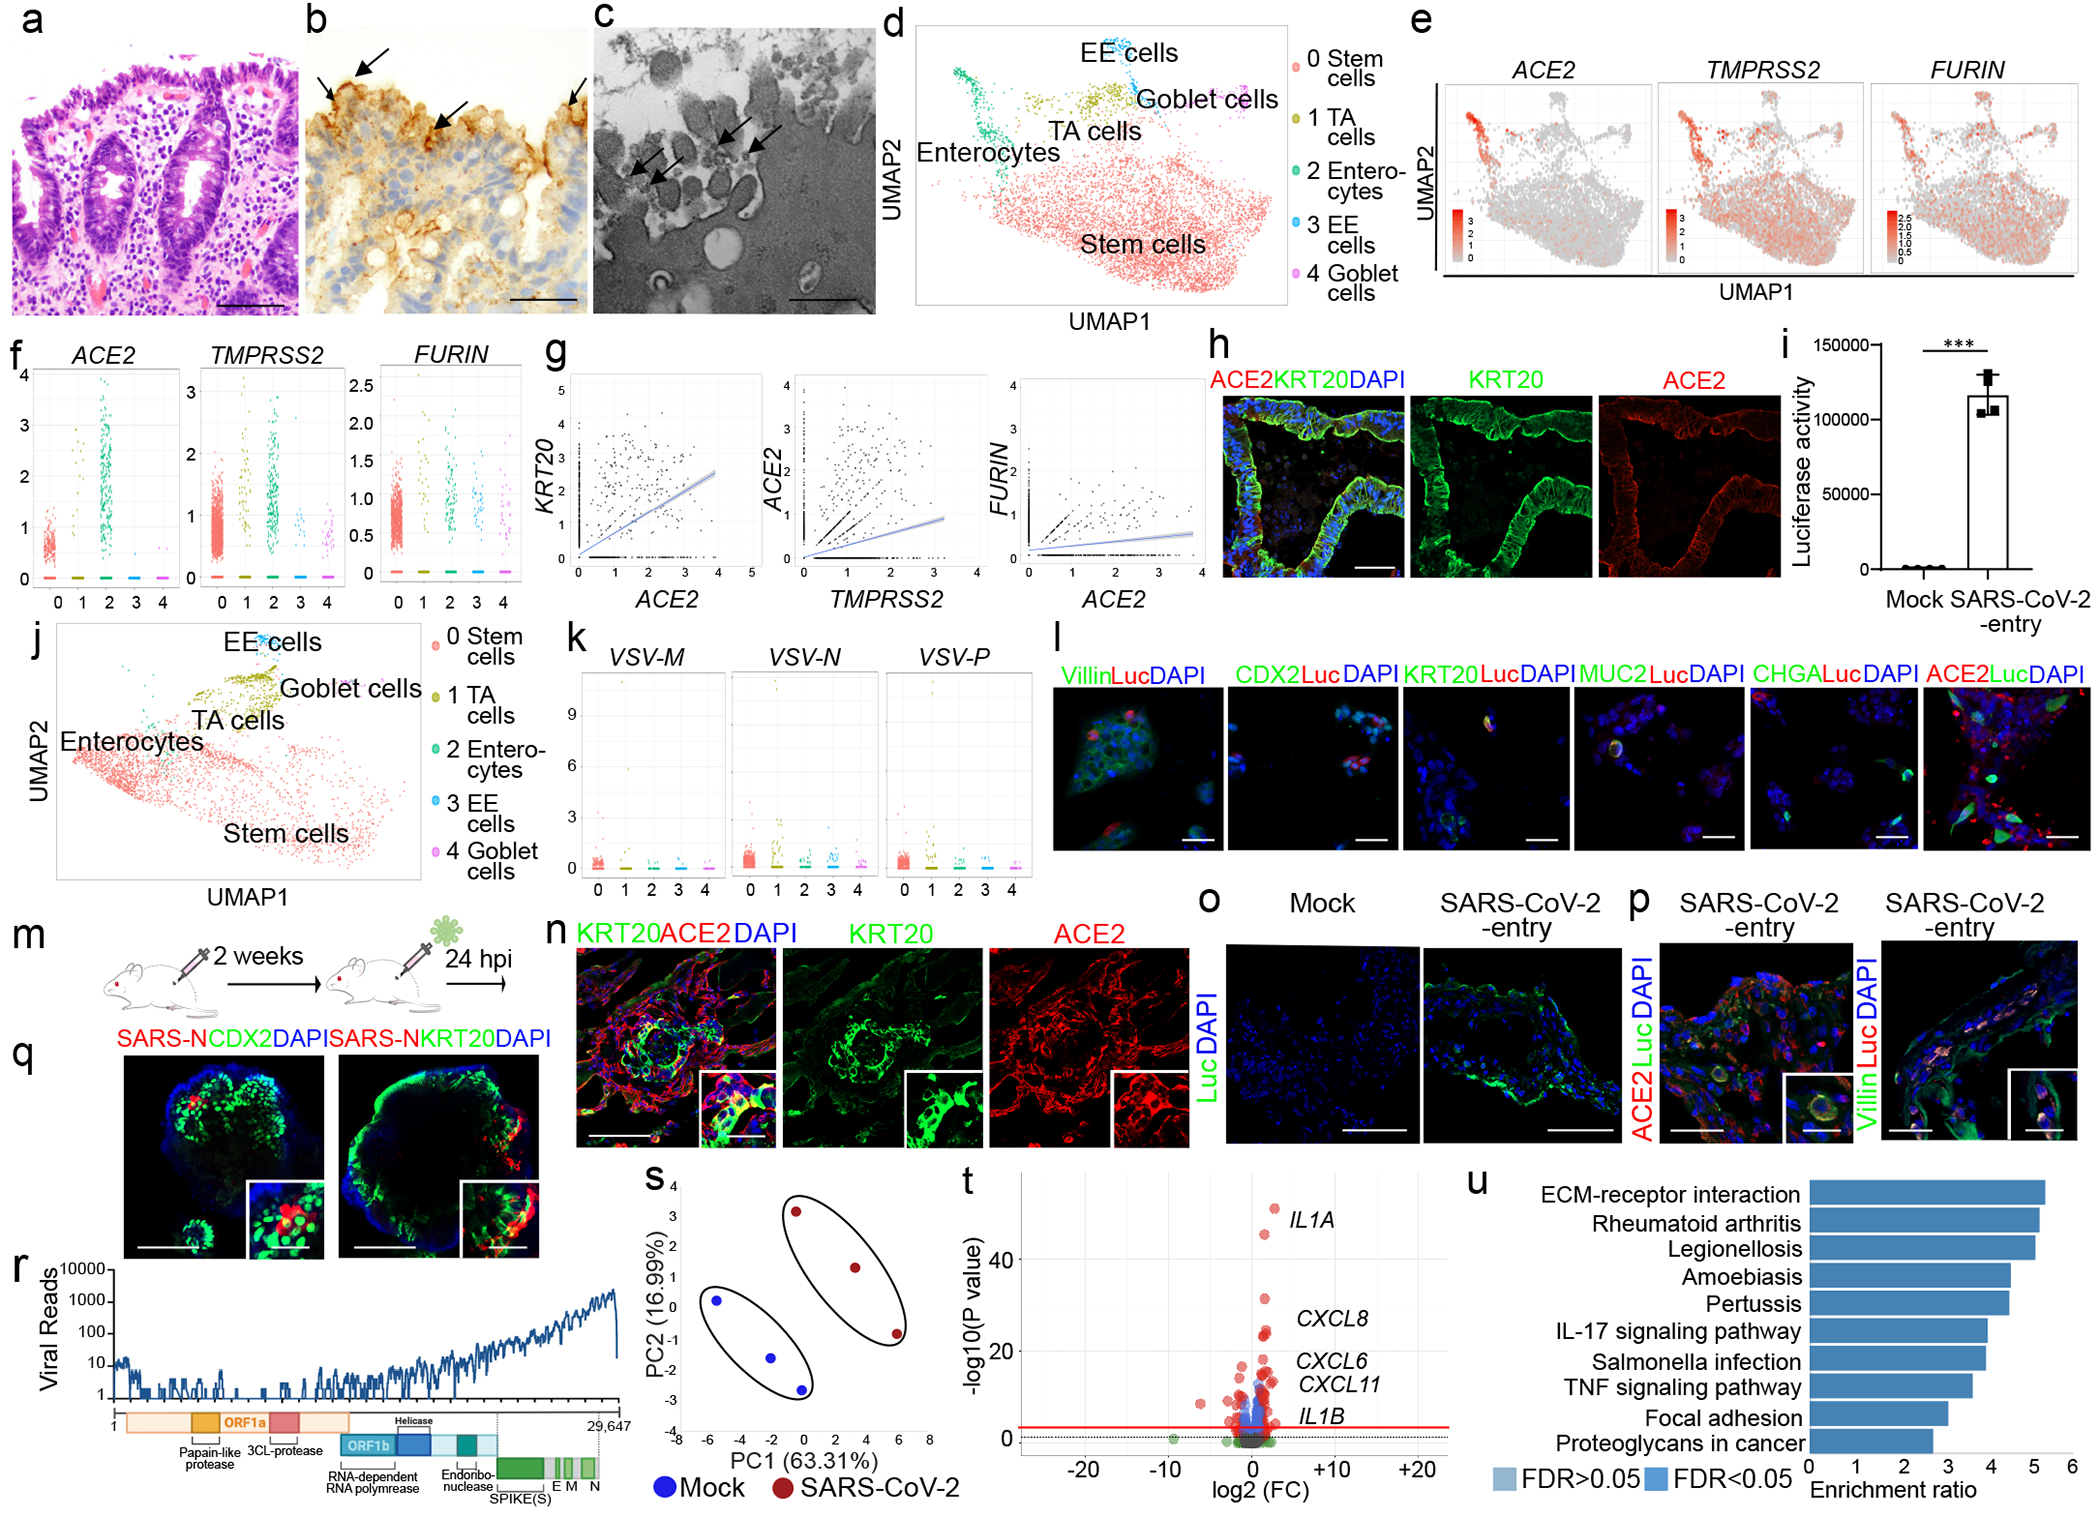
a-c, Hematoxylin and Eosin staining (a), in-situ hybridization staining for SARS-CoV-2 RNA (b) and electron microscopy (c) of colonoscopy biopsy tissue from a COVID-19 patient. Scale bar= 50 μm (a), 25 μm (b), 1 μm (c). The arrows indicate SARS-CoV-2 RNA (b), or SARS-CoV-2 viral particles (c). d, UMAP of hPSC-CO cell types. e, f, UMAP (e), and jitter plot (f) of ACE2, TMPRSS2 and FURIN. g, Correlation of expression levels for KRT20 with ACE2, TMPRSS2 and FURIN. h, Confocal images of hPSC-COs. Scale bar= 100 μm. i, j Luciferase activity (i) and UMAP (j) of COs infected with SARS-CoV-2-entry virus (24 hpi, MOI=0.01). n=4 biological independent experiments (i). ***P=2.25E-06. k, Jitter plots of VSV-M, VSV-N and VSV-P transcript levels. l, Immunostaining of hPSC-COs infected with SARS-CoV-2-entry virus (MOI=0.01). Scale bar= 50 μm. m, Schematic of the in vivo infection. n, Confocal image of colonic xenograft. Scale bar= 100 μm. Microscale bars= 30 μm. o, p, Confocal image of colonic xenograft 24 hpi (1X10³ FFU) stained with antibodies against luciferase (o) and ACE2 or Villin (p). Scale bar= 75 μm. Microscale bars= 25 μm. q, Immunostaining to detect SARS-CoV-2-nucleocapsid protein (SARS-N) in hPSC-COs. Scale bar= 100 μm. Microscale bars= 40 μm. r, RNA-seq read coverage of the viral genome in infected hPSC-COs (24 hpi, MOI=0.1). s-u, PCA plot (s), volcano plot (t), GSEA pathway analysis (u) of gene expression profiles from mock and SARS-CoV-2-infected hPSC-COs at 24 hpi (MOI=0.1). n=3 biological independent experiments. Red line indicates p=0.05. ***P < 0.001. Data were analyzed by an unpaired two-tailed Student’s t-test and shown as mean ± STDEV. Data are representative of at least three independent experiments.
We next derived hPSC-COs from HUES8 using the previous established stratagies19, 20 (Extended Data Fig. 3b–3e). Using single cell RNA-seq, five cell clusters were identified including KRT20+ enterocytes, MUC2+ goblet cells, EPHB2+ transit-amplifying (TA) cells, CHGA+ enteroendocrine (EE) cells, and LGR5+ or BMI1+ stem cells, and most cells expressed CDX2 and VIL1 (Fig. 2d, Extended Data Fig. 4a–4c). ACE2, TMPRSS214 and FURIN are also expressed in all five cell clusters, but highly enriched and correlated in KRT20+ enterocytes (Fig. 2e–2g). ACE2 expression in KRT20+ enterocytes was further validated by immunostaining (Fig. 2h).
To test the permissiveness of hPSC-COs to SARS-CoV-2, hPSC-COs were infected with SARS-CoV-2-entry virus, and showed strong luciferase activity 24 hpi (Fig. 2i and Extended Data Fig. 5a). Single cell RNA-seq of the infected hPSC-COs revealed the same five cell populations as in the uninfected condition (Fig. 2j and Extended Data Fig. 5b–d). However, after infection, the KRT20+ enterocyte population decreased significantly (Fig. 2j). This corresponded with increased cellular apoptosis (Extended Data Fig. 5e) and the depletion of the ACE2+ population (Extended Data Fig. 5c–d). Viral RNA from the SARS-CoV-2-entry virus was detected in all five cell populations after SARS-CoV-2-entry virus infection (Fig. 2k), but not in the uninfected hPSC-COs (Extended Data Fig. 5f), suggesting that all cell types within hPSC-COs were permissive to SARS-CoV-2-entry virus. This was also confirmed by detection of luciferase expression in ACE2+, Villin+, CDX2+, KRT20+, and MUC2+ cells (Fig. 2l). ACE2+TMPRSS2+, ACE2+ and TMPRSS2+ cells were all detected in the population of VSV+ cells (Extended Data Fig. 5g). However, the failure to measure ACE2 or TMPRSS2 transcripts might reflect limitations in detection sensitivity using the 10X Genomics scRNA-seq platform. Based on immunostaining, all Luc+ cells are ACE2+ (Fig. 2l).
Humanized mice carrying hPSC-COs in vivo provide a unique platform for modeling COVID-19. In brief, hPSC-COs were transplanted under the kidney capsule of NSG mice (Fig. 2m). Consistent with in vitro culture, ACE2 was detected in hPSC-derived KRT20+ enterocytes (Fig. 2n). 24 hours after intra-xenograft inoculation with SARS-CoV-2-entry virus, luciferase was detected in the infected xenografts (Fig. 2o), in particular in ACE2+ and Villin+ colonic cells, suggesting these cells are permissive to SARS-CoV-2-entry virus in vivo (Fig. 2p).
Next, hPSC-COs were infected with SARS-CoV-2 virus and viral Nucleocapsid protein was detected in the infected hPSC-COs 24 hpi, partially co-localizing with CDX2 and KRT20 (Fig. 2q and Extended Data Fig. 5h). Bulk RNA sequencing confirmed robust viral infection of hPSC-COs (Fig. 2r), distinct transcriptional profiles of mock and infected hPSC-COs (Fig. 2s) and striking differential gene expression of cytokines and chemokines (Fig. 2t). GSEA revealed over-represented pathway networks in hPSC-COs similar to the SARS-CoV-2 infected hPSC-LOs and lung autopsy tissues of COVID-19 patients18 (Fig. 2u).
A hPSC-LOs-based anti-SARS-CoV-2 screen.
To identify drug candidates capable of inhibiting SARS-CoV-2 entry, hPSC-LOs were treated with a library of FDA-approved drugs, followed by infection with SARS-CoV-2-entry virus. At 24 hpi, the organoids were analyzed for luciferase activity. Compounds with a Z score<−2 were chosen as primary hit drugs (Fig. 3a). Four drugs were confirmed to block luciferase activity in a dose-dependent manner, independent of cytotoxicity, including imatinib (EC50=4.86 μM, CC50=37.3 μM Fig. 3b, 3e), mycophenolic acid (MPA, EC50=0.15 μM, Fig. 3c, 3f), quinacrine dihydrochloride (QNHC, EC50=2.83 μM, CC50=22 μM, Fig. 3d, 3g), and chloroquine (EC50=3.85 μM) (Extended Data Fig. 6a). Immunostaining confirmed a significant reduction of luciferase+ cells detected among SP-B+SP-C+ AT2-like cells in hPSC-LOs treated with 10 μM imatinib, 3 μM MPA or 4.5 μM QNHC (Fig. 3h and Extended Data Fig. 6b). None of the tested drugs showed toxicity-independent inhibition of VSV-G luciferase virus, suggesting that imatinib, MPA and QNHC specifically block SARS-CoV-2-entry virus infection in hPSC-LOs, instead of inhibiting luciferase activity (Extended Data Fig. 6c). Imatinib, MPA and QNHC also inhibited SARS-CoV-1-entry virus infection in a dose-dependent manner (imatinib: IC50=0.17 μM; MPA: IC50=0.7 μM; QNHC: IC50=0.30 μM, Extended Data Fig. 6d).
Figure 3. A hPSC-LO-based high throughput chemical screen identifies three FDA-approved drug candidates that block SARS-CoV-2 entry.
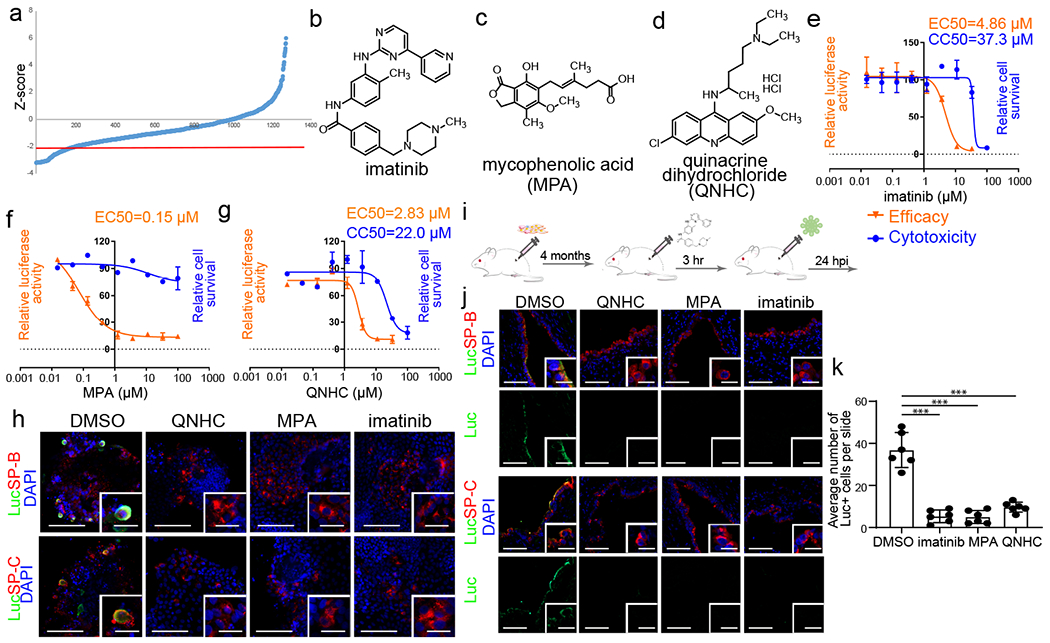
a, Primary screening results. Red line is Z-score <−2, which means the luminescent signal is lower than average-2xSTDEV. b-d, Chemical structure of imatinib (b), MPA (c), and QNHC (d). e-g, Efficacy and toxicity curves of imatinib (e), MPA (f), and QNHC (g). n=3 biological independent experiments. h, Immunofluorescent staining of luciferase (Luc)+ cells in imatinib, MPA, and QNHC-treated hPSC-LOs at 24 hpi (MOI=0.01). Scale bar= 50 μm. Microscale bars= 10 μm. i, Scheme of in vivo drug treatment. j-k, Immunostaining (j) and quantification (k) of hPSC-derived lung xenografts of mice treated with 400 mg/kg imatinib mesylate, 50 mg/kg MPA, and 25 mg/kg QNHC at 24 hpi (1X10⁴ FFU). Scale bars= 100 μm. Microscale bars= 10 μm. n=6 xenografts for each group. ***P=5.54E-06, ***P=5.19E-06, ***P=1.66E-05. ***P< 0.001. Data were analyzed by an unpaired two-tailed Student’s t-test and shown as mean ± STDEV. Data are representative of at least three independent experiments.
To evaluate the drug activities in vivo, we treated humanized mice carrying hPSC-derived lung xenografts with imatinib mesylate, MPA or QNHC prior to intra-xenograft inoculation with SARS-CoV-2-entry virus (Fig. 3i). Similar to results observed in hPSC-LOs, luciferase staining was significantly decreased in SP-B+SP-C+ AT2-like cells treated with imatinib mesylate, MPA or QNHC (Fig. 3j–k).
Drugs block SARS-CoV-2 infection.
We next treated hPSC-LOs or hPSC-COs with 10 μM imatinib, 3 μM MPA or 4.5 μM QNHC and infected each culture with SARS-CoV-2. At 24 hpi, all three drugs block SARS-CoV-2 infection in a dose-dependent manner (Extended Data Fig. 7a, and Supplementary Table 2). In hPSC-LOs, drug treatment prior to infection resulted in significantly reduced levels of viral sgRNA (Fig. 4a), as well as Spike protein expression (Fig. 4b, 4c and Extended Data Fig. 7b). Drug treatment prior to infection of hPSC-COs also led to significantly reduced viral sgRNA levels (Fig. 4d and Extended Data Fig. 7c), as well as nucleocapsid protein expression (Fig. 4e, 4f and Extended Data Fig. 7d). As most studies on SARS-CoV-2 are performed in the African green monkey Vero E6 cell line, we verified that imatinib, MPA and QNHC block SARS-CoV-2 infection in a toxicity-independent manner in Vero E6 cells similar to hPSC-LOs and hPSC-COs (Extended Data Fig. 8, 9 and Supplementary Table 2).
Figure 4. Imatinib, mycophenolic acid, and quinacrine dihydrochloride each block the entry of SARS-CoV-2 virus in both hPSC-derived LOs and COs.
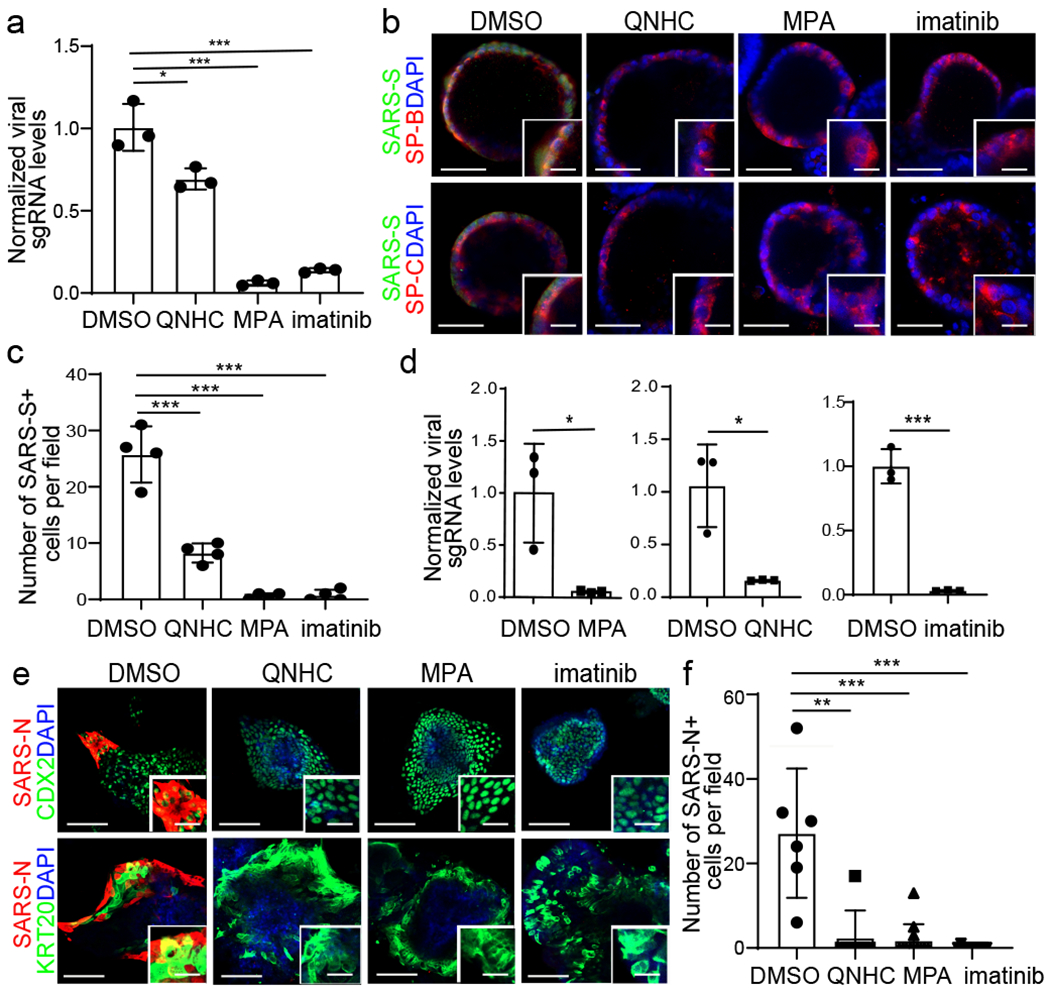
a-c, qRT-PCR analysis of total RNA extracted from infected hPSC-LOs for viral N sgRNA (a, n=3 biological independent experiments, *P=0.0256, ***P=0.000333, ***P=0.000461), immunofluorescent staining (b) and quantification (c, n=4 biological replicates for each group, ***P=6.36E-05, ***P=5.63E-05, ***P=0.000566) of SARS-CoV-2 Spike protein (SARS-S) and SP-B/SP-C in imatinib, MPA, or QNHC treated hPSC-LOs at 24 hpi (MOI=0.5). Scale bar= 50 μm. Microscale bar= 15 μm. d-f, qRT-PCR analysis of total RNA extracted from infected hPSC-COs for viral N sgRNA (d, n=3 biological independent experiments, ***P=0.0260, ***P=0.0166, ***P=0.000235), immunofluorescent staining (e) and quantification (f, n=6 biological independent experiments, **P=0.00242, ***P=4.34E-05, ***P=5.26E-05) of SARS-CoV-2 nucleocapsid protein (SARS-N) of imatinib, MPA, or QNHC-treated hPSC-COs at 24 hpi (MOI=0.5). Scale bar= 50 μm. Microscale bars=15 μm. *P < 0.05, **P < 0.01, and ***P < 0.001. Data were analyzed by an unpaired two-tailed Student’s t-test and shown as mean ± STDEV. Data are representative of at least three independent experiments.
We briefly explored the impact of imatinib, MPA and QNHC on the key steps of SARS-CoV-2 entry. Surface plasmon resonance binding analysis suggested that both imatinib and QNHC bind with ACE2 (Extended Data Fig. 10a). MPA and QNHC treatment decrease the expression levels of FURIN (Extended Data Fig. 10b, 10c). To explore the inhibitory mechanism of imatinib, RNA-seq analysis of DMSO and imatinib-treated hPSC-LOs was performed, showing distinct transcriptional profiles (Extended Data Fig. 10d). Volcano plots and GSEA analysis highlighted the change of pathways caused by imatinib, related to fatty acid biosynthesis, steroid biosynthesis, and fatty acid metabolism (Extended Data Fig. 10e, 10f). Viruses have been known to target lipid signaling, synthesis, and metabolism to remodel their host cells into an optimal environment for replication.
Discussion.
Here, we present an hPSC-LOs platform, including AT2-like cells that express ACE2, the receptor for SARS-CoV-2. RNA-seq analysis of infected organoids revealed upregulation of cytokine/chemokine signaling with only a modest interferon signature, which mimics the inflammatory changes observed in primary human COVID-19 pulmonary infections18. We also showed that multiple cell types in hPSC-COs can be infected by SARS-CoV-2. Finally, we used the hPSC-LOs in a high throughput screen of FDA-approved drugs. We identified several drugs that inhibit SARS-CoV-2 entry, including imatinib, MPA and QNHC, both in vitro and in vivo. The anti-viral activities of these drugs were further validated with live SARS-CoV-2. MPA is widely and safely used as an immunosuppressive drug to prevent organ rejection and to treat autoimmune diseases. A recent study predicted that MPA modulates the interaction between inosine-5′-monophosphate dehydrogenase 2 and SARS-CoV-2 nonstructural protein 1421. Imatinib has been shown as a potent inhibitor of SARS-CoV and MERS-CoV fusion proteins. Very recently, five clinical trials have been registered to apply imatinib to treat COVID-19 patients. Together, we established hPSC-derived LO and CO models that can be applied to screen for drug candidates for COVID-19 patients.
Online Methods.
Data availability.
RNA-seq data of hPSC-LOs and lung autopsy samples is publicly available on the GEO repository database under the accession number GSE155241. scRNA-seq data of hPSC-LOs is publicly available on the GEO repository database under the accession number GSE148113. scRNA-seq data of hPSC-COs are publicly available on the GEO repository database, accession number GSE147975. RNA-seq of hPSC-derived endocrine cells and liver organoids are available on the GEO repository database, accession number GSE151803.
Source Data behind Figs. 1c, d, g, k; 2i; 3a, e, k; 4a, c, g, i; Extended Data Figs 1d, e; 5a; 6a, c, d; 7a, c; 8a, c, e; 9a, d; 10a, c, are available within the manuscript files.
Code availability.
Code for processing scRNAseq data is available in github at https://github.com/shuibingchen/SARS_COV2.
hPSC culture.
RUES2 hESCs (provided by WiCell) were cultured on irradiated mouse embryonic fibroblasts (Global Stem, cat. no. GSC-6001G) at a density of 20,000– 25,000 cells/cm2 in a medium of DMEM/F12, 20% knockout serum replacement (Life Technologies), 0.1 mM β-mercaptoethanol (Sigma Aldrich) and 20 ng/ml bFGF (R&D Systems), and medium was changed daily. hESC cultures were maintained in an undifferentiated state at 37 °C in a 5% CO2/air environment until stem cells reached about 90% confluence. H1 hESCs (provided by WiCell) and HUES8 hESCs (provided by Harvard University) were grown and maintained on 1% Matrigel (Corning)-coated six-well plates in StemFlex medium (Gibco) at 37°C with 5% CO2.
hPSC lung differentiation.
Protocols for maintenance of hPSCs and generation of lung organoids were slightly modified from previous studies6,13. hPSC differentiation into endoderm was performed in serum-free differentiation (SFD) medium of DMEM/F12 (3:1) (Life Technologies) supplemented with 1×N2 (Life Technologies), 1×B27 (Life Technologies), 50 μg/ml ascorbic acid, 2 mM Glutamax (Gibco), 0.4 μM monothioglycerol, 0.05% BSA at 37 °C in a 5% CO2/5% O2/95% N2 environment. hPSCs were treated with Accutase and plated onto low attachment 6-well plates (Corning), re-suspended in endoderm induction medium containing 10 μM Y-27632, 0.5 ng/ml human BMP4 (R&D Systems), 2.5 ng/ml human bFGF, 100 ng/ml human Activin A (R&D Systems), for 72–76 hours dependent on the formation rates of endoderm cells. On day 3 or 3.5, the endoderm bodies were dissociated into single cells using 0.05% Trypsin/0.02% EDTA and plated onto fibronectin-coated, 24-well tissue culture plates (~100,000–150,000 cells/well). For induction of anterior foregut endoderm, the endoderm cells were cultured in SFD medium supplemented with 1.5 μM dorsomorphin dihydrochloride (R&D Systems) and 10 μM SB431542 (R&D Systems) for 36 hours, and then switched to 36 hours of 10 μM SB431542 and 1 μM IWP2 (R&D Systems) treatment. For induction of early stage lung progenitor cells (day 6–15), the resulting anterior foregut endoderm was treated with 3 μM CHIR99021 (CHIR, Stem-RD), 10 ng/ml human FGF10, 10 ng/ml human KGF, 10 ng/ml human BMP4 and 50–60 nM all-trans retinoic acid (ATRA), in SFD medium for day 8–10. The day 10–15 culture was maintained in a 5% CO2/air environment. On days 15 and 16, the lung field progenitor cells were replated after one minute trypsinization onto fibronectin-coated plates, in the presence of SFD containing 3 μM CHIR99021, 10 ng/ml human FGF10, 10 ng/ml human FGF7, 10 ng/ml human BMP4, and 50 nM ATRA. Day 16–25 cultures of late stage lung progenitor cells were maintained in SFD media containing 3 μM CHIR99021, 10 ng/ml human FGF10, 10 ng/ml human KGF, in a 5% CO2/air environment. For differentiation of mature lung cells (day 25 to 55) in 3D culture, cultures were re-plated and embedded in 90% Matrigel after brief trypsinization in SFD media containing maturation components containing 3 μM CHIR99021, 10 ng/ml human FGF10; 10 ng/ml human KGF, 50 nM Dexamethasone, 0.1 mM 8-bromo-cAMP (Sigma Aldrich) and 0.1 mM IBMX (3,7-dihydro-1-methyl-3-(2-methylpropyl)-1H-purine-2,6-dione, Sigma Aldrich).
hPSC colonic lineage differentiation.
For definitive endoderm (DE) differentiation, hPSCs were cultured to achieve 80–90% confluency, and treated with 3 μM CHIR99021 and 100 ng/ml Activin A in basal medium RPMI1640 (Cellgro) supplemented with 1×Pen-Strep (Gibco) for 1 day, and changed to the basal medium containing 100 ng/ml Activin A the next day. To induce CDX2+ hindgut endoderm, DE were treated with 3 μM CHIR99021 and 500 ng/ml FGF4 (Peprotech) in RPMI1640 supplemented with 1×B27 supplement and 1×Pen-Strep for 4 days with daily changing of fresh media. The hindgut endoderm was then subjected to colonic lineage induction by treatment with 100 ng/ml BMP2 (Peprotech), 3 μM CHIR99021 and 100 ng/ml hEGF (Peprotech) in Advance DMEM F12 medium supplemented with 1×B27 supplement, 1xGlutaMax, 10 mM HEPES (Gibco) and 1×Pen-Strep for 3 days with daily changing of fresh medium. The colon progenitor organoids were collected from the initial 2D cultures and embedded in a 100% Matrigel dome in a 24-well plate. Differentiation to mature colonic cell types was achieved by culturing these colon progenitor organoids in differentiation medium containing 600 nM LDN193189 (Axon), 3 μM CHIR99021 and 100 ng/ml hEGF in Advance DMEM F12 medium supplemented with 1×B27 supplement, 1×GlutaMax, 10 mM HEPES and 1xPen-Strep. The differentiation medium was refreshed every 3 days for at least 40 days to achieve full colonic differentiation. The hPSC-COs were passaged and expanded every 10–14 days at 1:6 density. To passage the organoids, the Matrigel domes containing the organoids were scrapped off the plate and resuspended in cold splitting media (Advance DMEM F12 medium supplemented with 1xGlutaMax, 10 mM HEPES and 1×Pen-Strep). The organoids were mechanically dislodged from the Matrigel dome and fragmented by pipetting in cold splitting media. The old Matrigel and splitting media were removed after pelleting cells and the organoids were resuspended in 100% Matrigel. 50 μL Matrigel containing fragmentized colon organoids were plated in one well of a pre-warmed 24-well plate.
Cell Lines.
HEK293T (human [Homo sapiens] fetal kidney) and Vero E6 (African green monkey [Chlorocebus aethiops] kidney) were obtained from ATCC. Cells were cultured in Dulbecco’s Modified Eagle Medium (DMEM) supplemented with 10% FBS and 100 I.U./mL penicillin and 100 μg/mL streptomycin. All cell lines were incubated at 37°C with 5% CO2.
SARS-CoV-2-entry Viruses.
Recombinant Indiana VSV (rVSV) expressing SARS-CoV-1 or SARS-CoV-2 spikes were generated as previously described22. HEK293T cells were grown to 80% confluency before transfection with pCMV3-SARS-CoV-1-spike and pCMV3-SARS-CoV-2-spike (kindly provided by Dr. Peihui Wang, Shandong University, China) using FuGENE 6 (Promega). Cells were cultured overnight at 37°C with 5% CO2. The next day, medium was removed and VSV-G pseudo-typed ΔG-luciferase (G*ΔG-luciferase, Kerafast) was used to infect the cells in DMEM at an MOI of 3 for 1 hour before washing the cells with 1×DPBS three times. DMEM supplemented with anti-VSV-G antibody (I1, mouse hybridoma supernatant from CRL-2700; ATCC) was added to the infected cells and they were cultured overnight as described previously23. The next day, the supernatant was harvested and clarified by centrifugation at 300 g for 10 minutes and aliquots stored at −80°C.
hPSC-LOs or hPSC-COs were seeded in 24-well plates, SARS-CoV-2-entry virus was added at the indicated MOIs and centrifuged the plate at 1200 g for 1 hour. Then, the organoids were cultured at 37°C with 5% CO2. At 24 hpi, organoids were fixed for immunohistochemistry or harvested for luciferase assay following the Luciferase Assay System protocol (E1501, Promega)
SARS-CoV-2 virus infections.
SARS-CoV-2, isolate USA-WA1/2020 (NR-52281) was deposited by the Center for Disease Control and Prevention and obtained through BEI Resources, NIAID, NIH. SARS-CoV-2 was propagated in Vero E6 cells in DMEM supplemented with 2% FBS, 4.5 g/L D-glucose, 4 mM L-glutamine, 10 mM Non-Essential Amino Acids, 1 mM Sodium Pyruvate and 10 mM HEPES as described previously24.
All work involving live SARS-CoV-2 was performed in the CDC/USDA-approved BSL-3 facility of the Global Health and Emerging Pathogens Institute at the Icahn School of Medicine at Mount Sinai in accordance with institutional biosafety requirements.
hPSC-LOs or hPSC-COs were infected with SARS-CoV-2 at the indicated MOI and incubated for 24 hours at 37°C. hPSC-LOs or hPSC-COs were pretreated with DMSO, imatinib, MPA or QNHC at the indicated concentration for 4 hours prior to infection. At 24 hpi, hPSC-LOs or hPSC-COs were washed three times in PBS and lysed in TRIzol for RNA analysis or fixed for 24 hours in 5% formaldehyde for immunofluorescence staining.
Approximately 2.5 × 10⁵ Vero E6 cells were treated with DMSO, imatinib, MPA or QNHC at the indicated concentration, followed by infection with SARS-CoV-2 at an MOI of 0.01 in DMEM supplemented with 2% FBS, 4.5 g/L D-glucose, 4 mM L-glutamine, 10 mM non-essential amino acids, 1 mM sodium pyruvate and 10 mM HEPES. At 24 hpi, cells were washed three times in PBS and lysed in TRIzol for RNA analysis, lysed in RIPA buffer for protein analysis, or fixed for 24 hours in 5% formaldehyde for immunofluorescence staining.
Xenograft formation.
1 million hPSC-derived cells at lung progenitor stage (at day 25) were subcutaneously injected into 6–8 weeks old NOD.Cg-Prkdcscid Il2rgtm1WjI/SzJ (NSG) mice (Jackson Laboratory). The mice were hosted at 22°C with 40–60% humidity and 12 light/12 dark cycle. Four months later, the mice were used for drug evaluation.
To determine drug activity in vivo, the mice were treated with 400 mg/kg imatinib mesylate, 50 mg/kg MPA and 25 mg/kg QNHC in (10%DMSO/90% corn oil) by intraperitoneal injection. Four hours after drug administration, SARS-CoV-2-entry virus was inoculated directly to the xenograft at 1x10³ FFU. At 24 hpi, the mice were euthanized and used for immunohistochemistry analysis.
All animal work was conducted in agreement with NIH guidelines and approved by the WCM Institutional Animal Care and Use Committee (IACUC) and the Institutional Biosafety Committee (IBC).
Immunohistochemistry.
Histology on tissues from mice was performed on paraffin-embedded or frozen sections from xenografts. Tissues were fixed overnight in 10% buffered formalin and transferred to 70% ethanol, followed by paraffin embedding, or tissues were fixed in 10% buffered formalin and transferred to 30% sucrose, followed by snap frozen in O.C.T (Fisher Scientific, Pittsburgh, PA). Adjacent sections stained with Hematoxylin and Eosin were used for comparison. Living cells in culture were directly fixed in 4% paraformaldehyde for 25 minutes, followed with 15 minutes permeabilization in 0.1% Triton X-100. Formalin-fixed paraffin-embedded human colon tissue for ACE2 staining was purchased from VitroVivo Biotech (SKU# HuPS-07005A). For immunofluorescence, cells or tissue sections were immuno-stained with primary antibodies at 4°C overnight and secondary antibodies at RT for 1 hour. The information for primary antibodies and secondary antibodies are provided in Supplementary Table 3. Nuclei were counterstained by DAPI. The figures were processed using Adobe Illustrator CC2017.
Intracellular flow cytometry analysis.
Flow cytometry intracellular staining was performed following the instruction of usual manual of Fixation/Permeabilization Solution Kit (BD Biosciences). Briefly, resuspend cells in Fixation/Permeabilization solution at 4°C for 20 minutes, then wash twice in 1×Perm/Wash buffer. Incubate with primary antibody at 4°C for 30 minutes in the dark, wash twice and then incubate with secondary antibody at 4°C for 30 minutes in the dark. Wash cells twice and then do flow cytometry analysis. The information for primary antibodies and secondary antibodies are provided in Supplementary Table 3.
Western blot.
Protein was extracted from cells in Radioimmunoprecipitation assay (RIPA) lysis buffer containing 1×Complete Protease Inhibitor Cocktail (Roche) and 1×Phenylmethylsulfonyl fluoride (Sigma Aldrich) prior to safe removal from the BSL-3 facility. Samples were analysed by SDS-PAGE and transferred onto nitrocellulose membranes. Proteins were detected using rabbit polyclonal anti-GAPDH (Sigma Aldrich, G9545, 1:1000), mouse monoclonal anti-SARS-CoV-2 Nucleocapsid [1C7] (1:1000 )and mouse monoclonal anti-SARS-CoV-2 Spike [2B3E5] protein (1:1000) (a kind gift by Dr. T. Moran, Center for Therapeutic Antibody Discovery at the Icahn School of Medicine at Mount Sinai). Endogenous TMPRSS2 and FURIN were detected using TMPRSS2 Antibody (H-4) (Santa Cruz, sc-515727, 1:500) and Anti-FURIN antibody (Abcam, ab183495, 1:1000). Primary antibodies were detected using Fluorophore-conjugated secondary goat anti-mouse (IRDye 680RD, 926–68070, 1:25000) and goat anti-rabbit (IRDye 800CW, 926–32211, 1:25000) antibodies. Antibody-mediated fluorescence was detected on a LI-COR Odyssey CLx imaging system and analyzed using Image Studio software (LI-COR).
Surface plasmon resonance.
The binding of imatinib, MPA and QHC to human ACE2 protein was detected by Biacore T200 surface plasmon resonance system (Cytiva). All experiments were performed at 25°C in HBS-EP+ buffer (10 mM HEPES, pH 7.4; 150 mM NaCl; 3.4 mM EDTA; 0.005% (v/v) surfactant P20). The human ACE2 protein, diluted at 50 μg/mL in 10 mM sodium acetate, pH 4.5, were immobilized on the surface of CM5 sensor chip using amine coupling method and served as the active surface. A blank immobilized flow cell was used as the reference surface. Then 1.5-fold dilutions of compound concentrations from 30 to 1.17 μM were injected over the reference and active surfaces, and the surface was regenerated after each concentration using 10 mM glycine pH 1.5. Background binding to reference flow cells was subtracted and compound binding levels to ACE2 were calculated using Biacore T200 evaluation software.
qRT-PCR.
Total RNA samples were prepared from cells/organoids using TRIzol and Direct-zol RNA Miniprep Plus kit (Zymo Research) according to the manufacturer’s instructions. To quantify viral replication, measured by the accumulation of subgenomic N transcripts, one-step quantitative real-time PCR was performed using SuperScript III Platinum SYBR Green One-Step qRT-PCR Kit (Invitrogen) with primers specific for the TRS-L and TRS-B sites for the N gene as well as ACTB as an internal reference as described previously25. Quantitative real-time PCR reactions were performed on a LightCycler 480 Instrument II (Roche). Delta-delta-cycle threshold (ΔΔCT) was determined relative to the ACTB and mock infected/treated samples. Error bars indicate the standard deviation of the mean from three biological replicates. The sequences of primers/probes are provided in Supplementary Table 4.
Single cell colonic organoid preparation for scRNA-sequencing.
hPSC-COs cultured in Matrigel domes were dissociated into single cells using 0.25% Trypsin (Gibco) at 37°C for 10 minutes, and the trypsin was then neutralized with DMEM F12 supplemented with 10% FBS. The dissociated organoids were pelleted and resuspended with L15 Medium (Gibco) supplemented with 10 mM HEPES, and 10 ng/ml DNaseI (Sigma). The resuspended organoids were then placed through a 40 μm filter to obtain a single cell suspension, and stained with DAPI followed by sorting of live cells using an ARIA II flow cytometer (BD Biosciences). The live colonic single cell suspension was proceeded with the Chromium Single Cell 3’ Reagent Kit v3 (10x Genomics, product code # 1000075) using 10X Genomics Chromium Controller. A total of 10,000 cells were loaded into each channel of the Single-Cell A Chip to target 8,000 cells. Briefly, according to manufacturer’s instruction, the sorted cells were washed with 1xPBS + 0.04% BSA, counted by a Bio-Rad TC20 Cell Counter, and cell viability was assessed and visualized. A total of 10,000 cells and Master Mixes were loaded into each channel of the cartridge to generate the droplets on Chromium Controller. Beads-in-Emulsion (GEMs) were transferred and GEMs-RT was undertaken in droplets by PCR incubation. GEMs were then broken and pooled fractions recovered. After purification of the first-strand cDNA from the post GEM-RT reaction mixture, barcoded, full-length cDNA was amplified via PCR to generate sufficient mass for library construction. Enzymatic fragmentation and size selection were used to optimize the cDNA amplicon size. TruSeq Read 1 (read 1 primer sequence) was added to the molecules during GEM incubation. P5, P7, a sample index, and TruSeq Read 2 (read 2 primer sequence) were added via End Repair, A-tailing, Adaptor Ligation, and PCR. The final libraries were assessed by Agilent Technology 2100 Bioanalyzer and sequenced on Illumina NovaSeq sequencer with pair-end 100 cycle kit (28+8+91).
Sequencing and gene expression UMI counts matrix generation
The FASTQ files were imported to a 10X Cell Ranger - data analysis pipeline (v3.0.2) to align reads, generate feature-barcode matrices and perform clustering and gene expression analysis. In a first step, cellranger mkfastq demultiplexed samples and generated fastq files; and in the second step, cellranger count aligned fastq files to the reference genome and extracted gene expression UMI counts matrix. In order to measure viral gene expression in colonic organoids, we built a custom reference genome by integrating the four virus genes and luciferase into the 10X pre-built human reference (GRCh38 v3.0.0) using cellranger mkref. The sequences of four viral genes (VSV-N VSV-P, VSV-M and VSV-L) were retrieved from NCBI (https://www.ncbi.nlm.nih.gov/nuccore/335873), and the sequence of the luciferase was retrieved from HIV-Luc. For lung organoids, we aligned reads to the 10X pre-built human reference (GRCh38 v3.0.0).
Single cell RNA-seq data analysis of hPSC-COs.
We filtered cells with less than 300 or more than 8000 genes detected as well as cells with mitochondria gene content greater than 30%, and used the remaining cells (6,175 cells for the uninfected sample and 2962 cells for the infected sample) for downstream analysis. We normalized the gene expression UMI counts for each sample separately using a deconvolution strategy26 implemented by the R scran package (v.1.14.1). In particular, we pre-clustered cells in each sample using the quickCluster function; we computed size factor per cell within each cluster and rescaled the size factors by normalization between clusters using the computeSumFactors function; and we normalized the UMI counts per cell by the size factors and took a logarithm transform using the normalize function. We further normalized the UMI counts across samples using the multiBatchNorm function in the R batchelor package (v1.2.1). We identified highly variable genes using the FindVariableFeatures function in the R Seurat (v3.1.0)27, and selected the top 3,000 variable genes after excluding mitochondria genes, ribosomal genes and dissociation-related genes. The list of dissociation-related genes was originally built on mouse data28, we converted them to human ortholog genes using Ensembl BioMart. We aligned the two samples based on their mutual nearest neighbors (MNNs) using the fastMNN function in the R batchelor package, this was done by performing a principle component analysis (PCA) on the highly variable genes and then correcting the principal components (PCs) according to their MNNs. We selected the corrected top 50 PCs for downstream visualization and clustering analysis. We ran the UMAP dimensional reduction using the RunUMAP function in the R Seurat27 package with training epochs setting to 2,000. We clustered cells into eight clusters by constructing a shared nearest neighbor graph and then grouping cells of similar transcriptome profiles using the FindNeighbors function and FindClusters function (resolution set to 0.2) in the R Seurat package. We identified marker genes for each cluster by performing differential expression analysis between cells inside and outside that cluster using the FindMarkers function in the R Seurat package. After reviewing the clusters, we merged four clusters that were likely from stem cell population into a single cluster (LGR5+ or BMI1+ stem cells) and kept the other four clusters (KRT20+ epithelial cells, MUC2+ goblet cells, EPHB2+ TA cells, and CHGA+ NE cells) for further analysis. We re-identified marker genes for the merged five clusters and selected the top 10 positive marker genes per cluster for heatmap plot using the DoHeatmap function in the R Seurat package27.
Single-cell RNA-seq data analysis for lung organoids.
For cell filtering, the cells for downstream analysis are required at least 200 and at most 6000 unique molecular identifiers (UMIs), genes detected (UMI count > 0) in less than two cells were removed. In addition, cells were excluded if more than 30% of sequences mapped to mitochondrial genes. In total, 14263 cells passed these filters for quality. Following the R Seurat package suggestions, we normalized the gene expression using the NormalizeData function, and the differentially expressed genes were found by “vst” method using the FindVariableFeatures function. The top 3,000 variable genes were selected for PCA analysis. We used an elbow plot to determine the number of PCs, and the top 20 PCs were used for each group of cells. Next, we scaled the data and performed linear dimensional reduction using the ScaleData and RunPCA functions, respectively. Clustering resolution was set at 0.2 using the FindClusters function. We determined the biomarkers in each cluster using the FindAllMarkers function and renamed the nine clusters as following cell types: AT1-like cells_1, AT2-like cells, fibroblast cells_1, AT1-like cells_2, stromal cells, proliferating cells, fibroblast cells_2, pulmonary neuroendocrine cells and airway epithelial cells. We re-identified marker genes and selected top differentially expressed marker genes per cluster for heatmap plot using the DoHeatmap function in the R Seurat package. UMAP plots and violin plots were generated by the Seurat toolkit FeaturePlot and VlnPlot functions.
Gene enrichment and correlation.
For Gene enrichment analysis, we compared the enriched genes in each cluster in hPSC-LOs to 205 marker genes were reported highly expressed in AT2 cells in the human lung cell dataset29. The bar graph was generated using the ratio of intersection genes in each cluster. For correlation analysis, we compared the marker genes in hPSC-LOs in each cluster (cluster 0.AT1-like cells_1 (171 genes), cluster 1. AT2-like cells (144 genes), cluster 2. fibroblast cells_1 (323 genes), cluster 3. AT1-like cells_2 (288 genes), cluster 4. stromal cells (261 genes), cluster 5. proliferating cells (332 genes), cluster 6.fibroblast cells_2 (157 genes), cluster 7.pulmonary neuroendocrine cells (PNEC,313 genes) and cluster 8.airway epithelial cells (206 genes) with the human lung cells (AT1 cells (1087 genes), AT2 cells (205 genes), Proliferating basal cells (984 genes), Proximal basal cells (630 genes), Alveolar Fibroblasts (423 genes), Myofibroblasts (290 genes), PNEC (1585 genes). The heatmap plot on correlation of genes with cell fate was generated using the R heatmap.2 package.
RNA-Seq before and following viral infections.
Organoid infections were performed at an indicated MOI and harvested at 24 hpi in DMEM supplemented with 0.3% BSA, 4.5 g/L D-glucose, 4 mM L-glutamine and 1 μg/ml TPCKtrypsin. Total RNA was extracted and DNase treated using TRIzol (Invitrogen) and Directzol RNA Miniprep Plus kit (Zymo Research) according to the manufacturer’s instructions. RNAseq libraries of polyadenylated RNA were prepared using the TruSeq RNA Library Prep Kit v2 (Illumina) or TruSeq Stranded mRNA Library Prep Kit (Illumina) according to the manufacturer’s instructions. cDNA libraries were sequenced using an Illumina NextSeq 500 platform. For viral RNA analysis, sequencing reads were aligned to the SARS-CoV-2/human/USA/WA-CDC-WA1/2020 genome (GenBank: MN985325.1) using Bowtie2 and visualized using IGV software.
After further filtering and quality control, R package edgeR30 was used to calculate RPKM and Log2 counts per million (CPM) matrices as well as perform differential expression analysis. Principal component analysis was performed using Log2 CPM values and gene set analysis was run with WebGestalt31. Heatmaps and bar plots were generated using Graphpad Prism software, version 7.0d. In volcano plot, differentially expressed genes (p-adjusted value < 0.05) with a log2 (Fold Change) > 2 are indicated in red. Non-significant differentially expressed genes with a log2 (Fold Change) > 2 are indicated in green.
High Throughput Chemical Screening.
hPSC-LOs were dissociated using TrypLE for 10 min in a 37℃ water bath and replated into 10% Matrigel-coated 384-well plates at 10,000 cells/40 μl medium/well. Six hours after plating, compounds from an in-house FDA-approved drug library (Prestwick) were added at 10 μM. DMSO treatment was used as a negative control. hPSC-LOs were further infected with SARS-CoV-2-entry virus (MOI=0.01). After 24 hpi, hPSC-LOs were harvested for luciferase assay following the Luciferase Assay System protocol (Promega).
To calculate EC50, luciferase activity was normalized to DMSO-treated condition. To calculate CC50, the cell survival was monitored by Cell-Titer Glo (Promaga) and normalized to DMSO-treated condition. The efficacy and cytotoxicity curves were calculated using Prism GrapdPad 7.0.
Human studies.
Tissue samples were provided by the Weill Cornell Medicine Department of Pathology. The Tissue Procurement Facility operates under Institutional Review Board (IRB) approved protocol and follows guidelines set by Health Insurance Portability and Accountability Act (HIPAA). Experiments using samples from human subjects were conducted in accordance with local regulations and with the approval of the IRB at the Weill Cornell Medicine. The colonoscopy sample was collected as part of a study on IBD. Colonoscopy tissue samples were collected, with informed consent, for the diagnosis of IBD under IRB protocol 1409015468. As standard clinical practice during the pandemic, patient stool samples were tested for SARS-CoV-2. Residual colonoscopy tissue was analysed for SARS-CoV-2 staining in patients whose stool sample was positive for the virus. No extra tissue was collected for this study.
Tissue specimens were fixed in 10% formalin or 2.5% glutaraldehyde for 48 to 72 hours before the following procedures. Hematoxylin and eosin were performed on sections from paraffin blocks.
RNA in situ hybridization.
7 μm formalin fixed paraffin embedded colon sections were prepared according to manufacturer’s instructions (Advanced Cell Diagnostics). The 2.5 HD Reagent Brown Kit was used for detection with probes directed against SARS-CoV-2 (MT020880.1, region 28274–28882) using DAB as chromogenic readout.
Electron Microscopy.
For Electron Microscopy examination, after osmium tetroxide post fixation and gradient dehydration “semi-thin” sections were examined, and selected areas were chosen for thin sections. Thin sections were then cut and stained with uranyl acetate and lead citrate. EM grids were then viewed with a transmission electron microscope.
Statistics and Reproducibility.
N=3 independent biological replicates were used for all experiments unless otherwise indicated. n.s. indicates a non-significant difference. P-values were calculated by unpaired two-tailed Student’s t-test unless otherwise indicated. *p<0.05, **p<0.01 and ***p<0.001. Three times each experiment was repeated independently with similar results. For Figs 1f, I, j, l; 3h, j; 4b, e, h, k and Extended Data Figs 1b, c; 2d, e; 3a, c–e; 5e, h; 6b; 7a–d; 8c, e; 10b, three times each experiment were repeated independently with similar results.
Extended Data
Extended Data Figure 1. Characterization of hPSC-LOs.
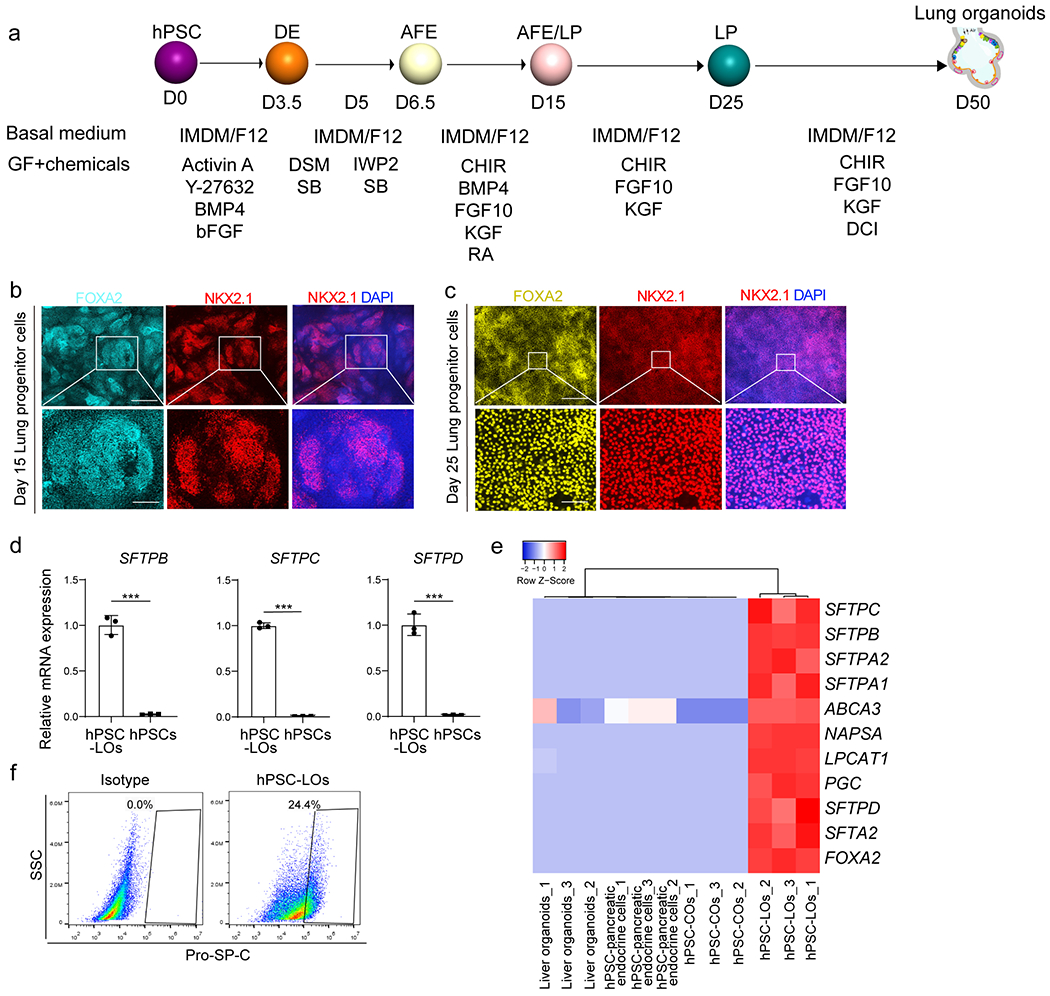
a, Scheme of protocol for differentiation of hPSCs to lung organoids. b, c, Immunostaining was performed in the hPSC-derived cell cultures at day 15 (b) and day 25 (c). Scale bars= 100 μm. Microscale bars= 20 μm. d, qRT-PCR of hPSCs and hPSC-LOs. n=3 biological independent experiments. ***P=8.44E-05, ***P=7.05E-07, ***P=0.000130. e, Heatmap from RNA-seq data of AT2 cell markers in hPSC-derived LOs, COs, pancreatic endocrine cells, and liver organoids. f, Intra-cellular flow cytometry analysis of Pro-SP-C expression in hPSC-LOs. ***P < 0.001. Data were analyzed by an unpaired two-tailed Student’s t-test and shown as mean ± STDEV. Data are representative of at least three independent experiments.
Extended Data Figure 2. Single cell RNA-seq of hPSC-LOs.
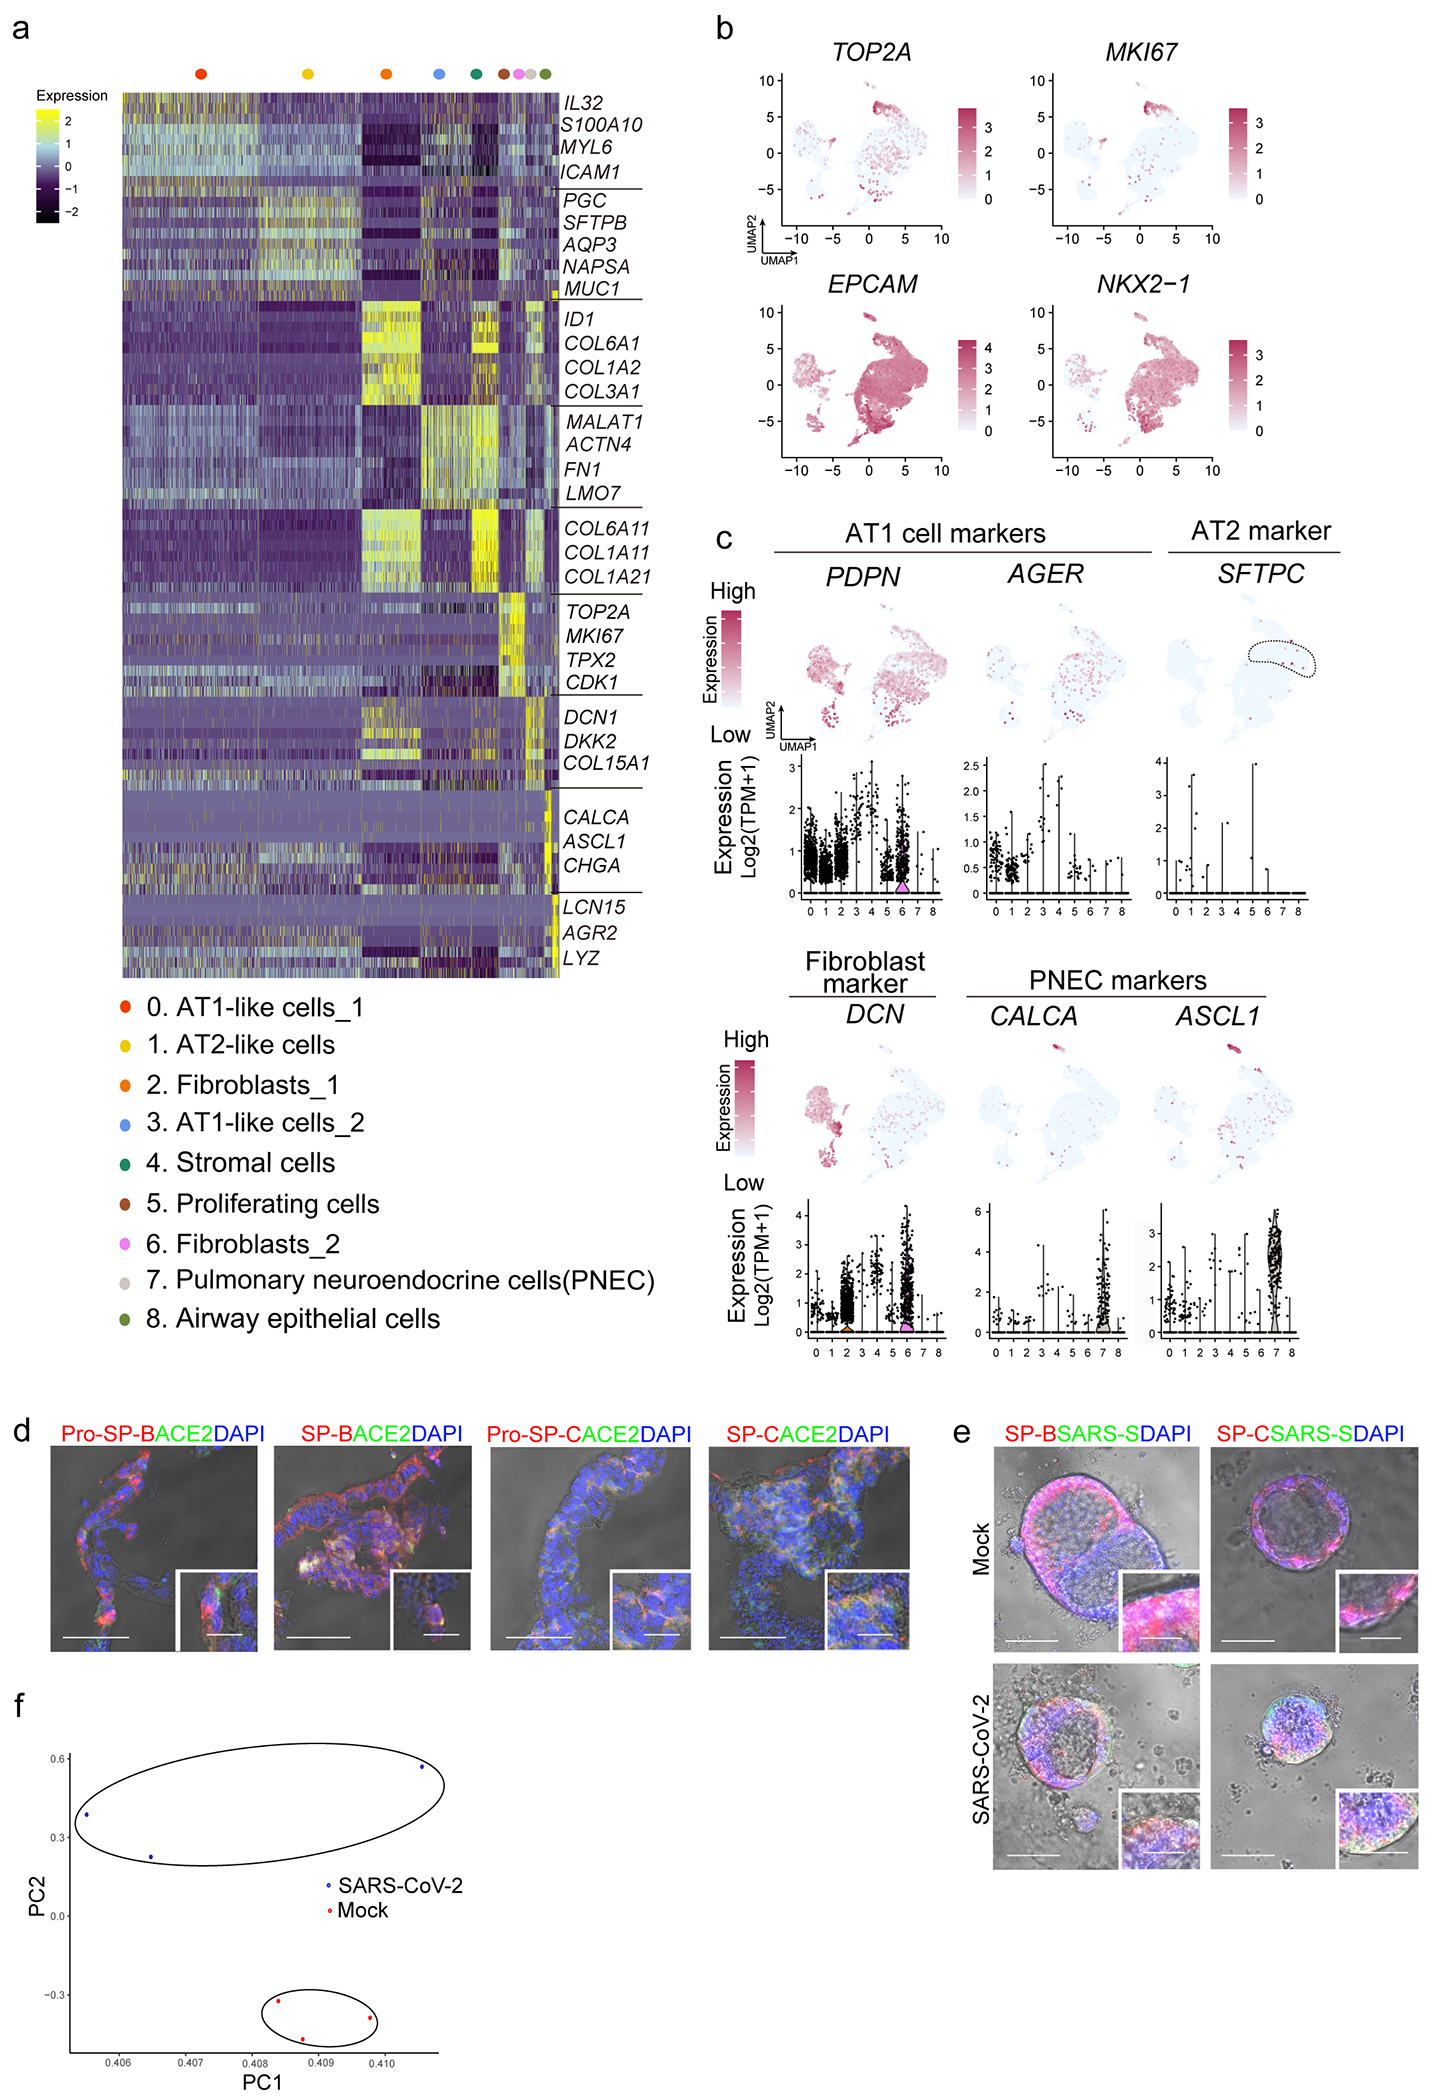
a, Heatmap of enriched genes in each cluster of scRNA profiles in hPSC-LOs. Each row represents one top differentially expressed gene and each column represents a single cell. b, UMAP of genes highly expressed in proliferating cells. c, Putative AT2, fibroblast and PNEC markers in each cluster in UMAPs. Relative expression level of each marker gene ranges from low (light blue) to high (pink) as indicated. Individual cells positive for lung cell markers are donated by red dots. The violin plot shows the expression level (log2(TPM+1)) of indicated gene in each cluster. d, Bright field+immunostaining images of cryo-section of hPSC-LOs. Scale bars= 30 μm. Microscale bars=10 μm. e, Bright field+immunostaining images of SARS-CoV-2 infected hPSC-LOs. Scale bars= 75 μm. Microscale bars= 25 μm. f, PCA plot of RNA-seq data from mock-infected or SARS-CoV-2 infected hPSC-LOs.
Extended Data Figure 3. Directed differentiation of hPSCs to COs.
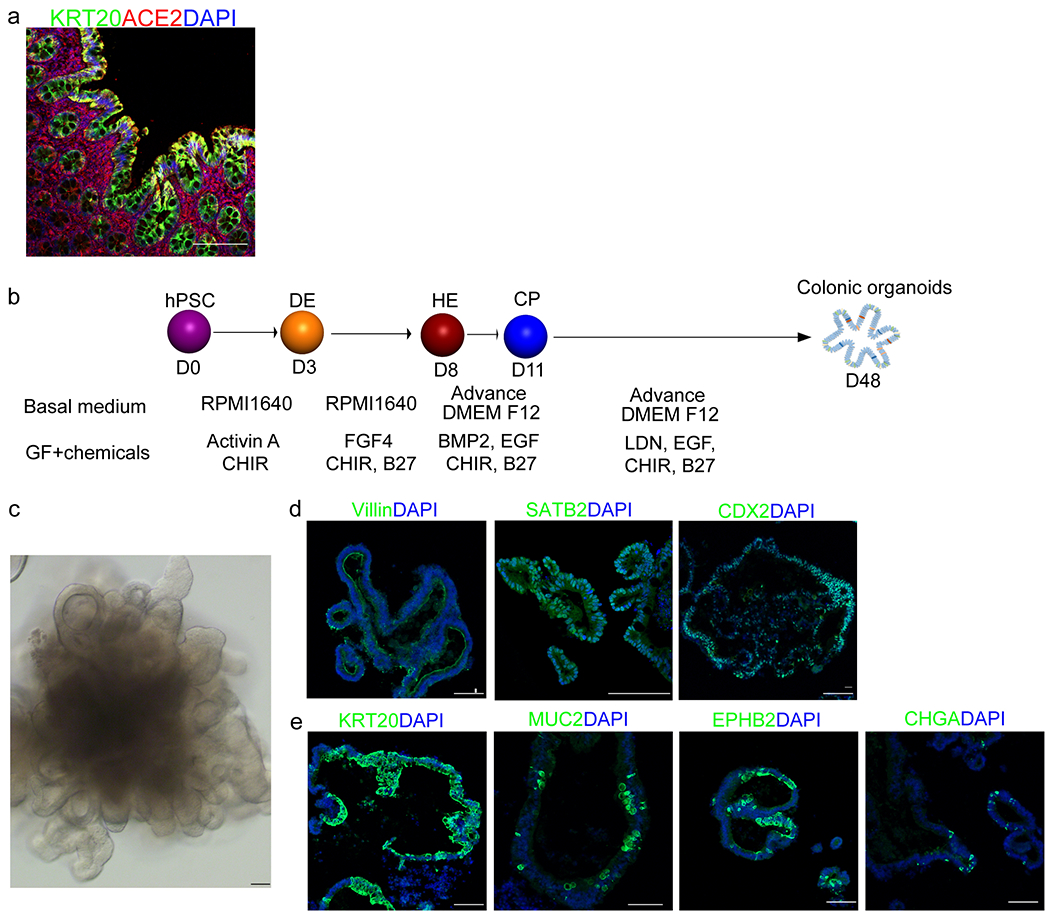
a, Immunohistochemistry staining of human colon tissue. Scale bar= 30 μm. b, Schematic of protocol and conditions for hPSC differentiation to generate colonic organoids. c, Phase contrast image of a representative hPSC-COs. Scale bar= 100 μm. d, e, Confocal imaging of hPSC-COs stained with antibodies against (d) markers for colon cell fate, including Villin, SATB2, CDX2, or (e) KRT20, MUC2, EPHB2, and CHGA; Scale bar= 100 μm.
Extended Data Figure 4. Single cell RNA-seq analysis of hPSC-COs.
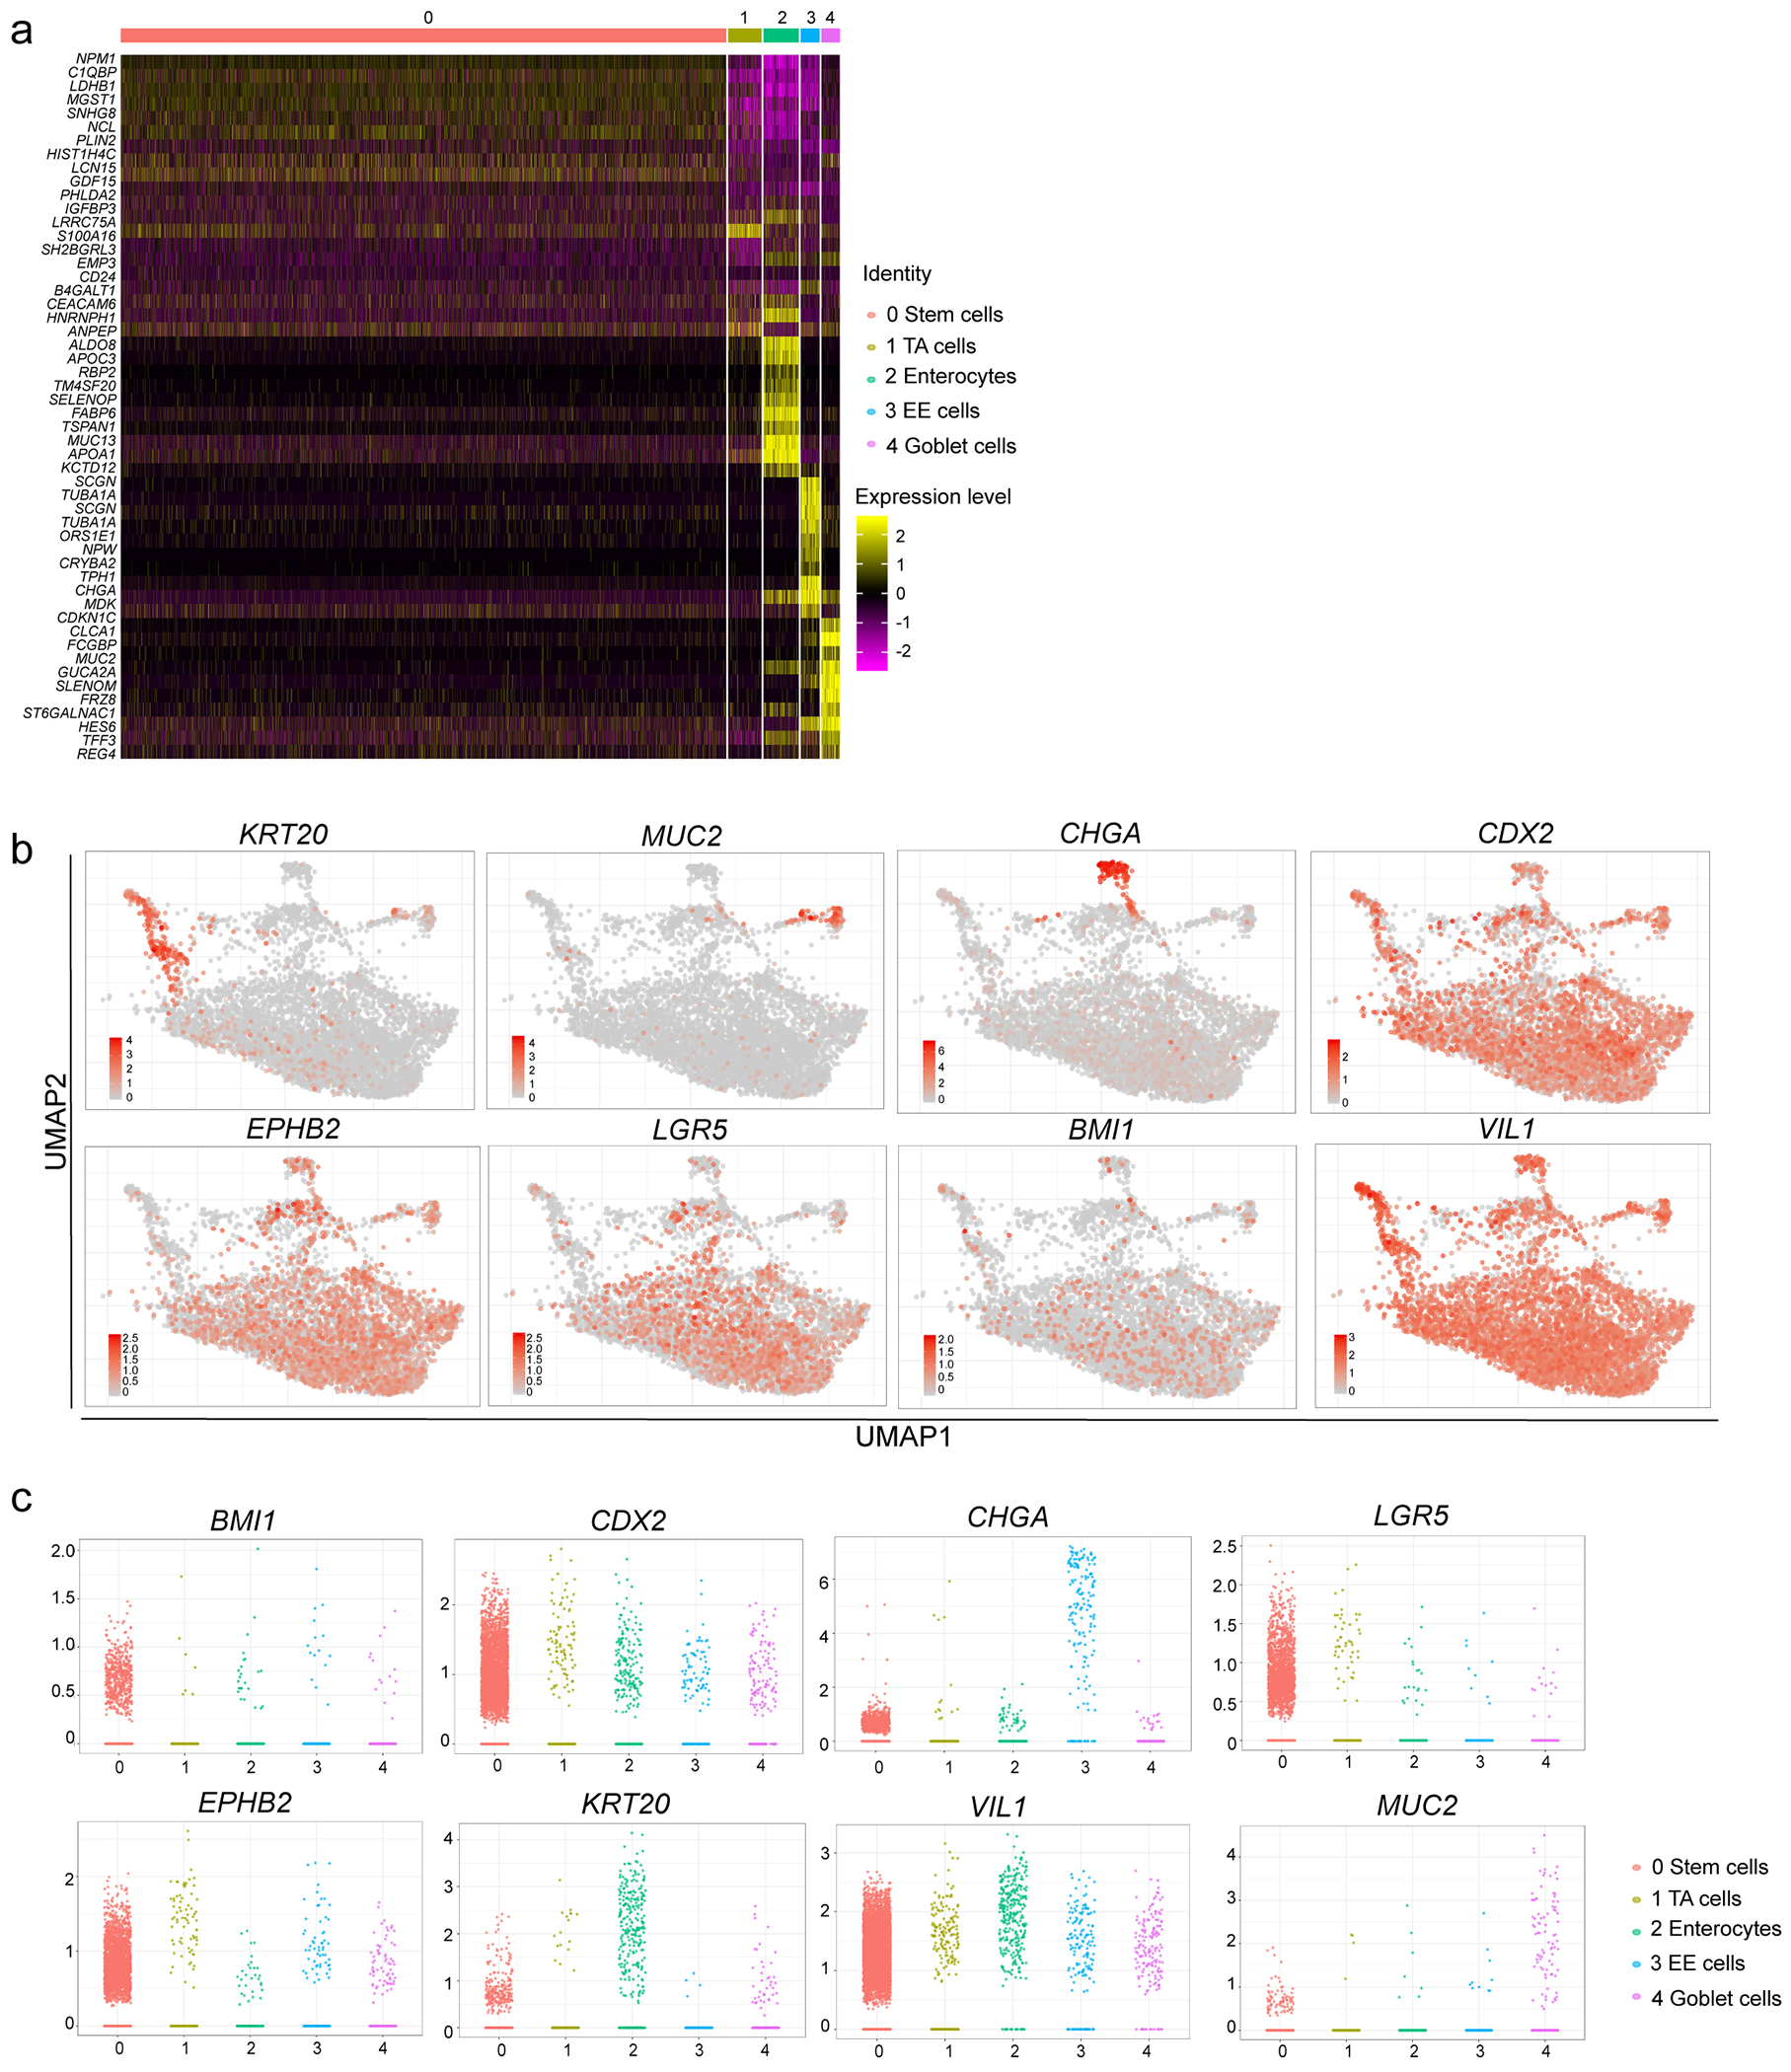
a, Heatmap of top 10 differentially expressed genes in each cluster of single cell RNA-seq data. b, UMAP of the expression levels of colonic cell markers. c, Jitter plots for expression levels of colonic cell markers.
Extended Data Figure 5. Single cell RNA-seq analysis of hPSC-COs at 24 hpi with SARS-CoV-2-entry virus.
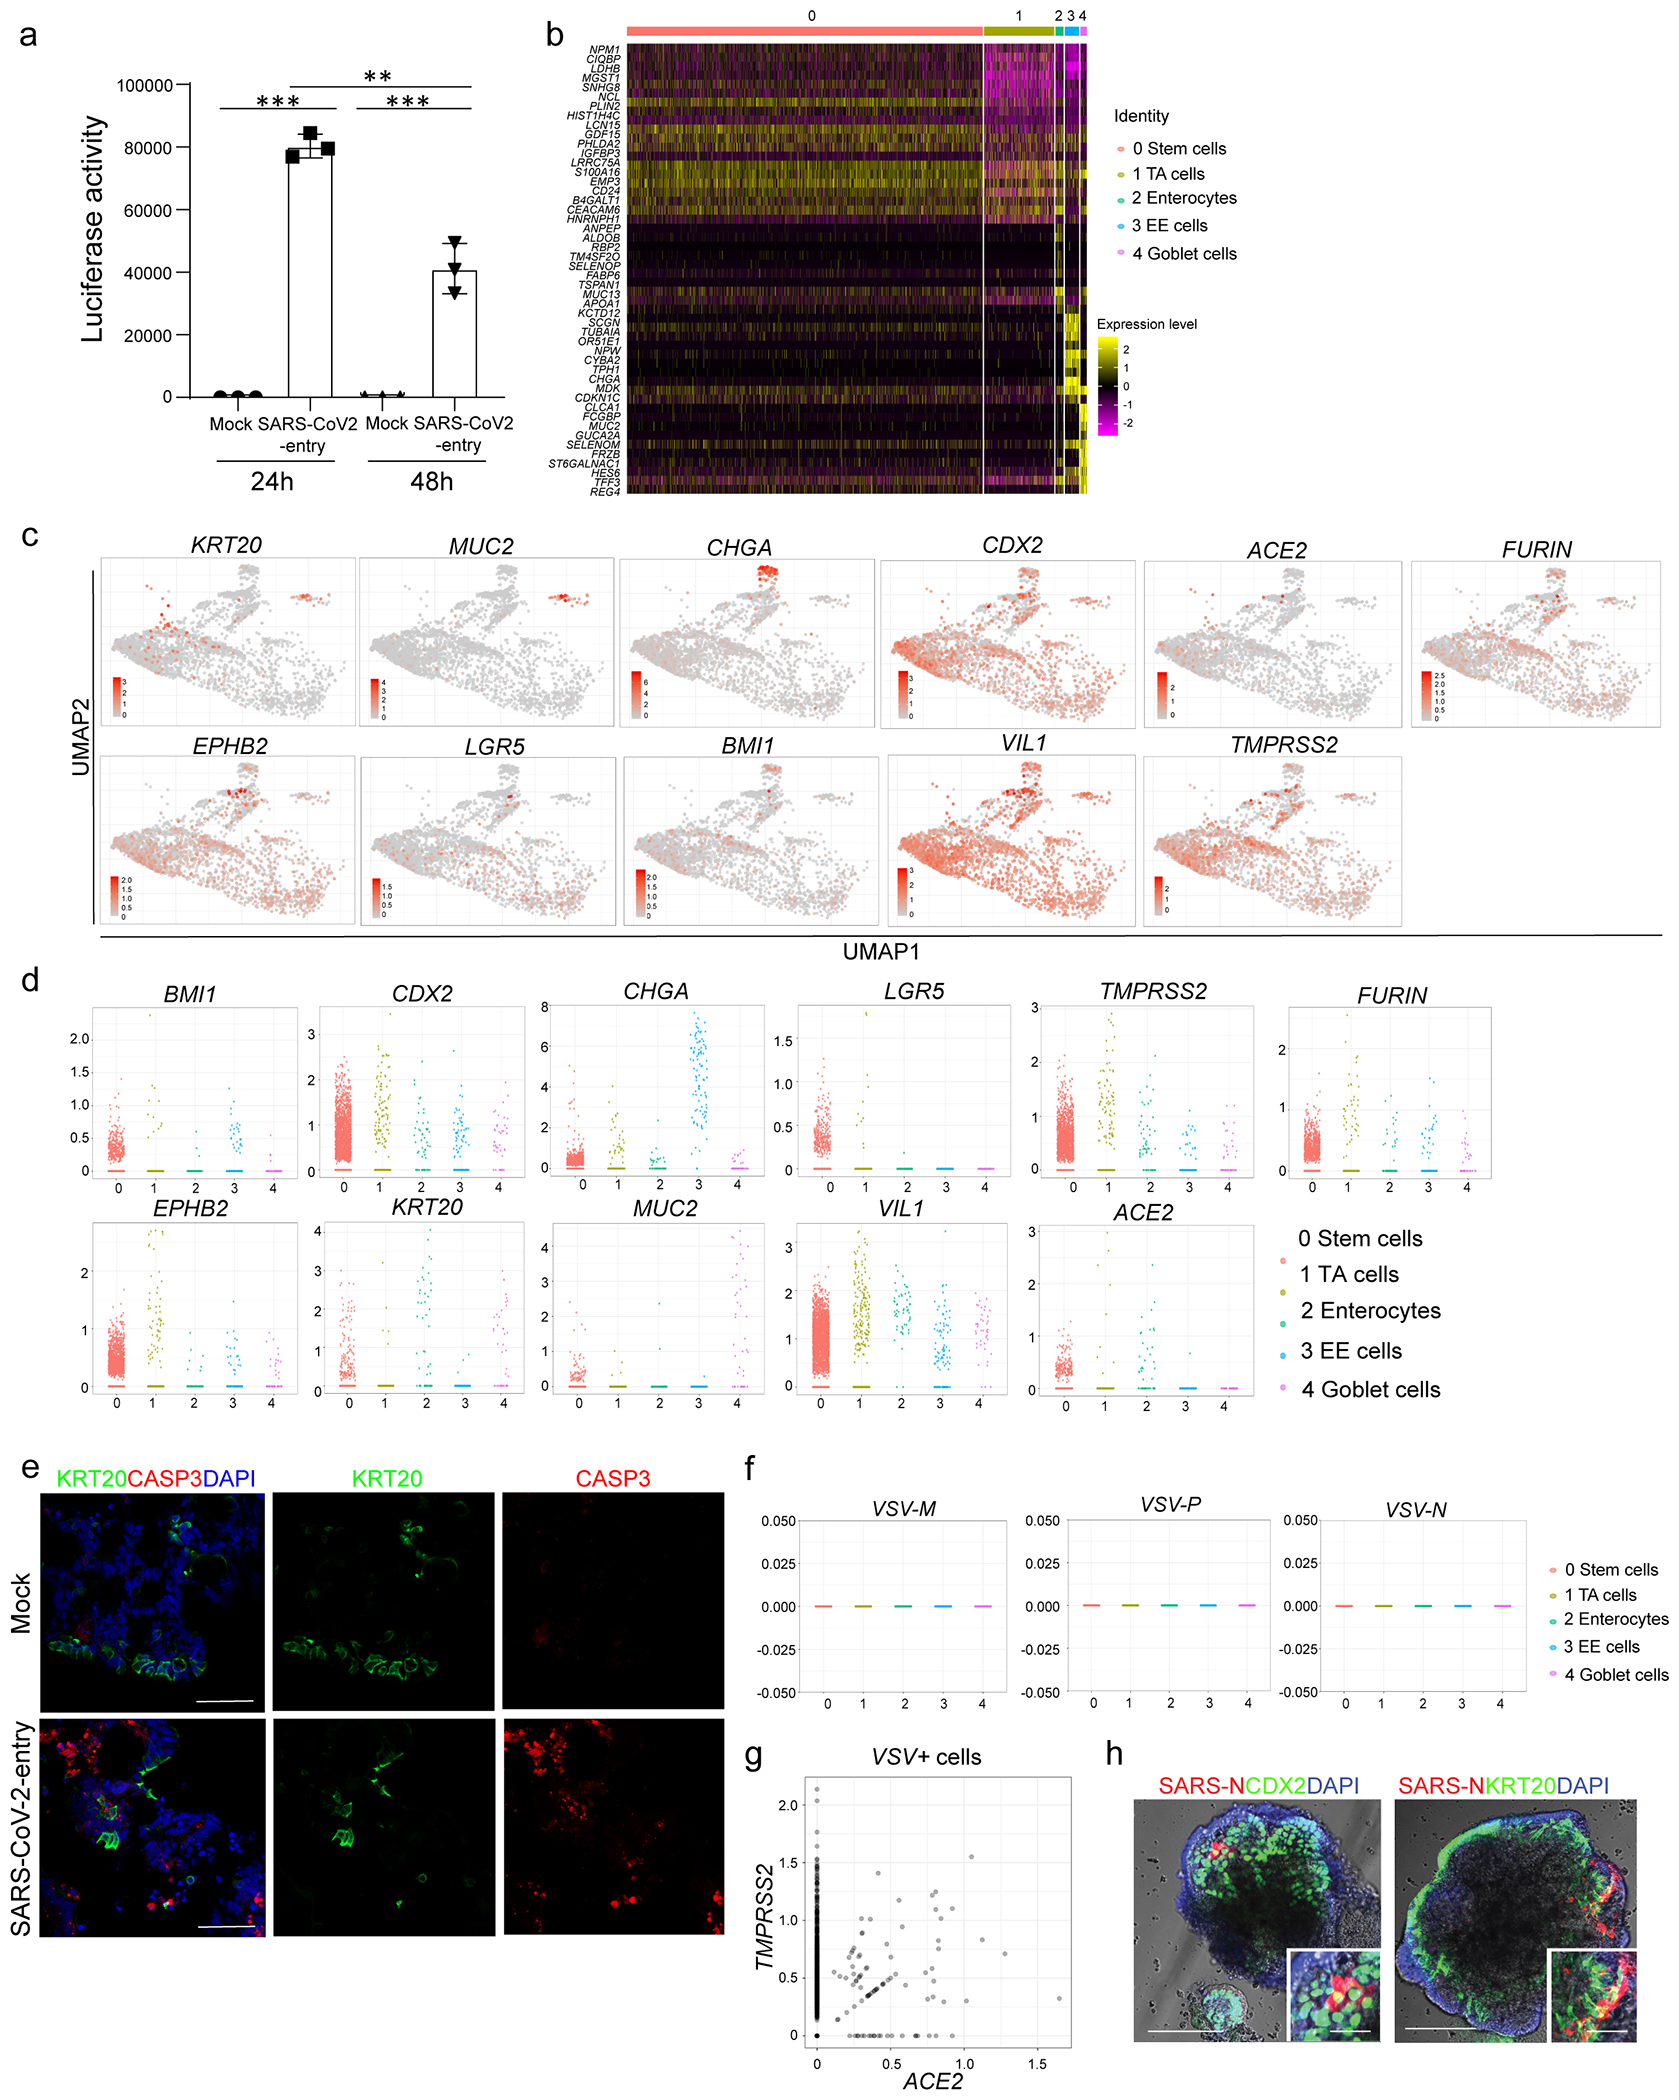
a, Relative luciferase levels in lysates derived from hPSC-COs inoculated with SARS-CoV-2-entry virus at 24 or 48 hpi (MOI=0.01). n=3 biological independent experiments. ***P=4.52E-08. Data were analyzed by ordinary one-way ANOVA and shown as Sidak’s multiple comparisons. b, Heatmap of top 10 differentially expressed genes in each cluster of single cell RNA-seq data. c, UMAP of ACE2, TMPRSS2, FURIN and colonic markers. d, Jitter plots for transcript levels of ACE2, TMPRSS2, FURIN and colonic markers. e, Representative immunostaining of infected hPSC-COs co-stained for KRT20 and CASP3. Scale bar= 50 μm. f, Jitter plots of transcript levels for VSV-M, VSV-N and VSV-P from hPSC-COs without SARS-COV-2 infection (mock). g, 2D correlation of expression levels for ACE2 and TMPRSS2 in VSV+ cells. h, Bright field+immunostaining images of SARS-CoV-2 infected hPSC-COs. Scale bars= 100 μm. Microcale bars= 40 μm. **P < 0.01, ***P< 0.001. Data are representative of at least three independent experiments.
Extended Data Figure 6. Efficacy curve of imatinib, MPA and QNHC comparing VSVG and SARS-CoV-1-entry virus on hPSC-LOs.
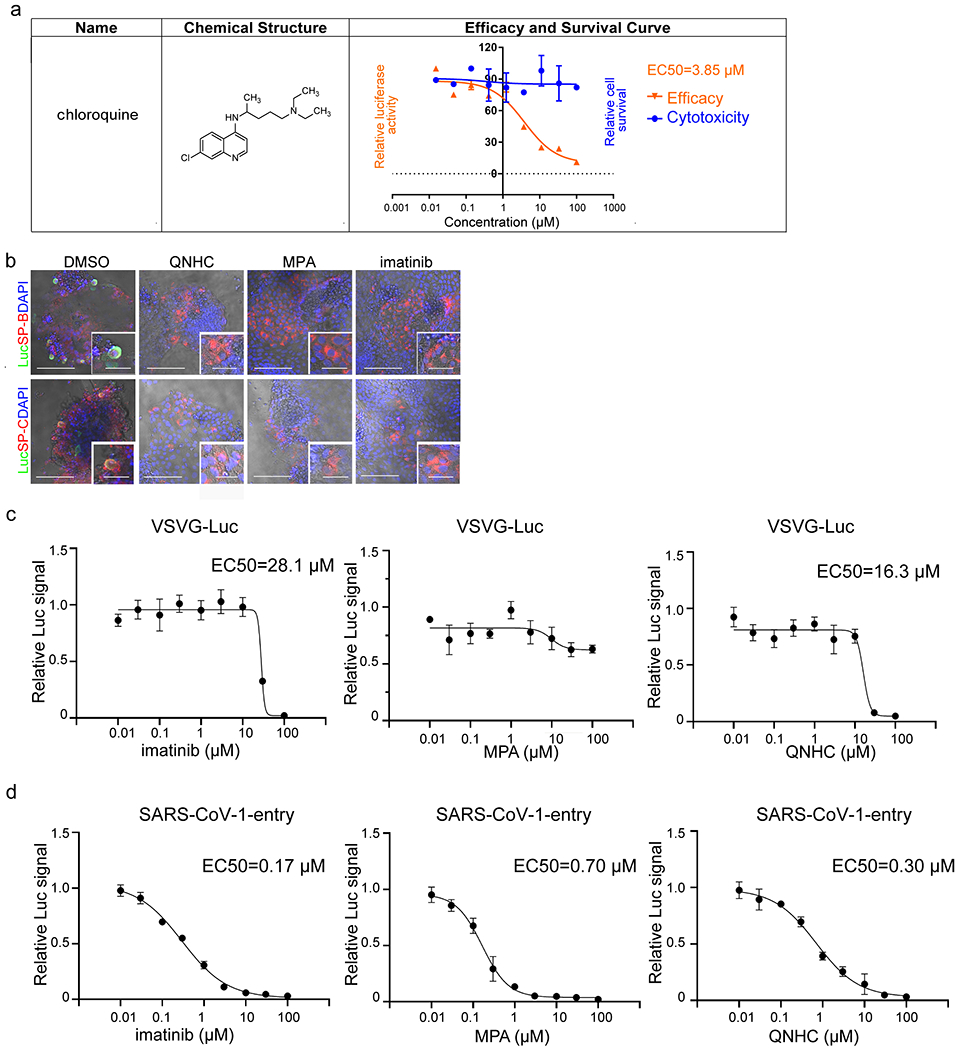
a, Chemical structure, efficacy curve and toxicity curve of two primary hit drug candidates, choloroquine and prochlorperazine. n=3 biological independent experiments. b, Bright field+immunostaining images of SARS-CoV-2-entry virus infected hPSC-LOs. Scale bars= 50 μm. Microscale bars= 10 μm. c, Efficacy curve of imatinib, MPA and QNHC on VSVG virus. n=3 biological independent experiments. d, Efficacy curve of imatinib, MPA and QNHC on SARS-CoV-1-entry virus. n=3 biological independent experiments. Data are representative of at least three independent experiments.
Extended Data Figure 7. Efficacy curve of imatinib, MPA and QNHC on hPSC-LOs and hPSC-COs.
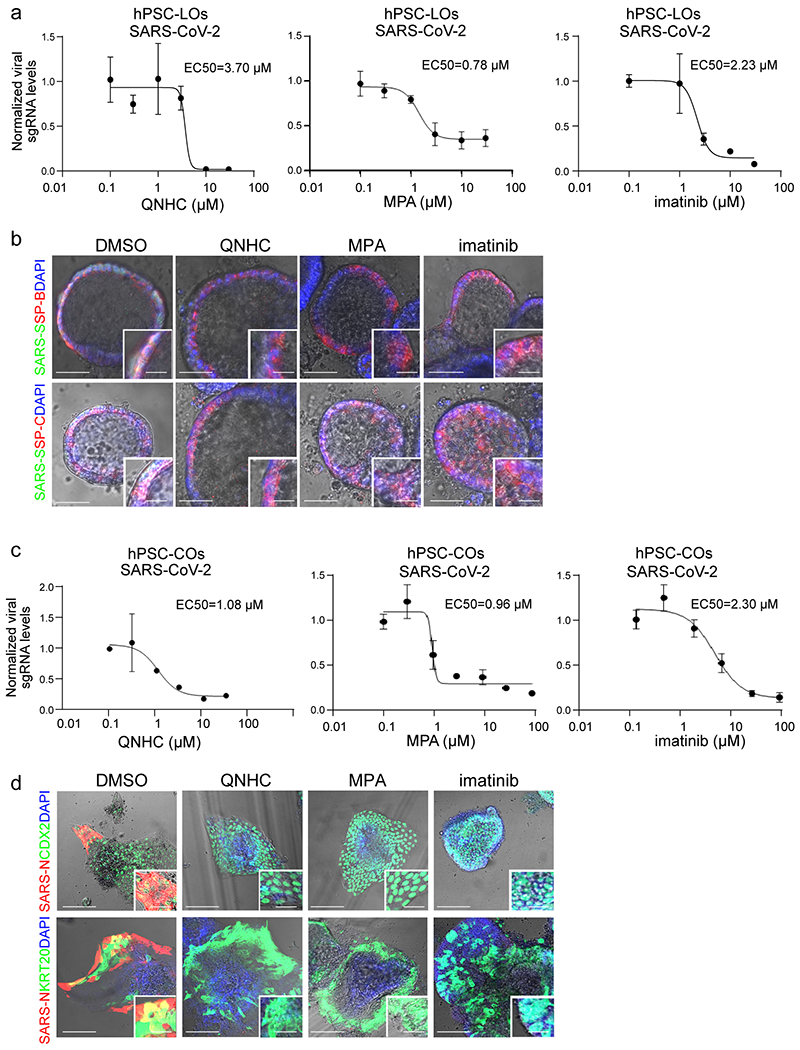
a, qRT-PCR based dose curve of imatinib, MPA, and QNHC on hPSC-LOs at 24 hours post-SARS-CoV-2 infection (SARS-CoV-2, MOI=0.1). n=3 biological independent experiments. b, Bright field+immunostaining images of SARS-CoV-2 Spike protein (SARS-S) and SP-B/SP-C in imatinib, MPA, or QNHC treated hPSC-LOs at 24 hpi (MOI=0.5). Scale bar = 50 μm. Microscale bars= 15 μm. c, qRT-PCR based dose curve of imatinib, MPA, and QNHC on hPSC-COs at 24 hpi of SARS-CoV-2 (SARS-CoV-2, MOI=0.1). n=3 biological independent experiments. d, Bright field+immunostaining images of SARS-S and SP-B/SP-C at 24 hpi of hPSC-COs infected with SARS-CoV-2 virus (MOI=0.5) and three hours later followed by 10 μM imatinib, 3 μM MPA or 4.5 μM QNHC treatment. Scale bar = 50 μm. Microscale bars= 15 μm. Data are representative of at least three independent experiments.
Extended Data Figure 8. Imatinib, MPA, and QNHC inhibit SARS-CoV-2 on Vero cells.
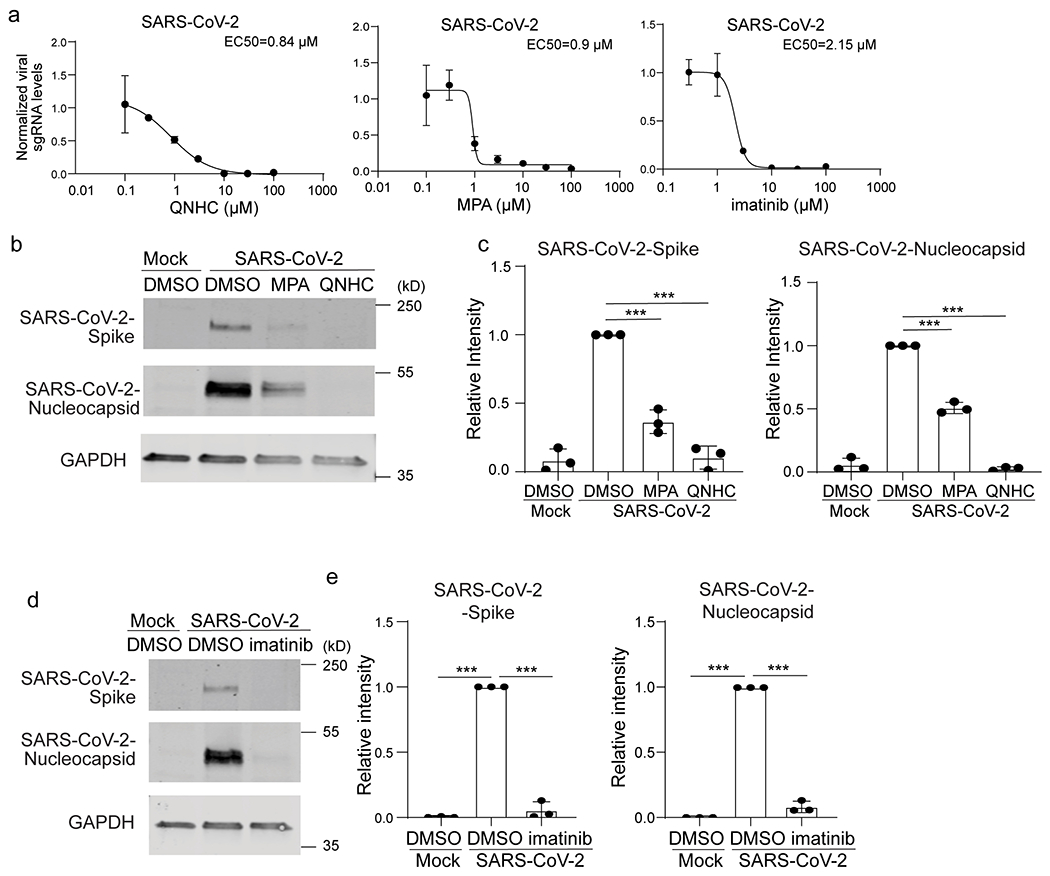
a. qRT-PCR based dose curve of imatinib, MPA and QNHC on Vero cells at 24 hours post-SARS-CoV-2 infection (SARS-CoV-2, MOI=0.01). n=3 biological independent experiments. b, c, Western blotting (b) and quantification (c) of 3 μM MPA, 4.5 μM QNHC or DMSO-treated Vero cells at 24 hours post-SARS-CoV-2 infection (SARS-CoV-2, MOI=0.01). n=3 biological independent experiments, ***P=0.000223, ***P=5.09E-05, ***P=4.32E-05. ***P=3.72E-08. d, e, Western blotting (d) and quantification (e) of DMSO or 10 μM imatinib treated Vero cells at 24 hpi (SARS-CoV-2, MOI=0.01). n=3 biological independent experiments, ***P=7.41E-18, ***P=8.06E-07, ***P=7.41E-18, ***P=3.39E-06. ***P<0.001. Data were analyzed by an unpaired two-tailed Student’s t-test and shown as mean ± STDEV. Data are representative of at least three independent experiments.
Extended Data Figure 9. Efficacy and survival curve of imatinib, MPA and QNHC on VSVG virus on Vero cells.
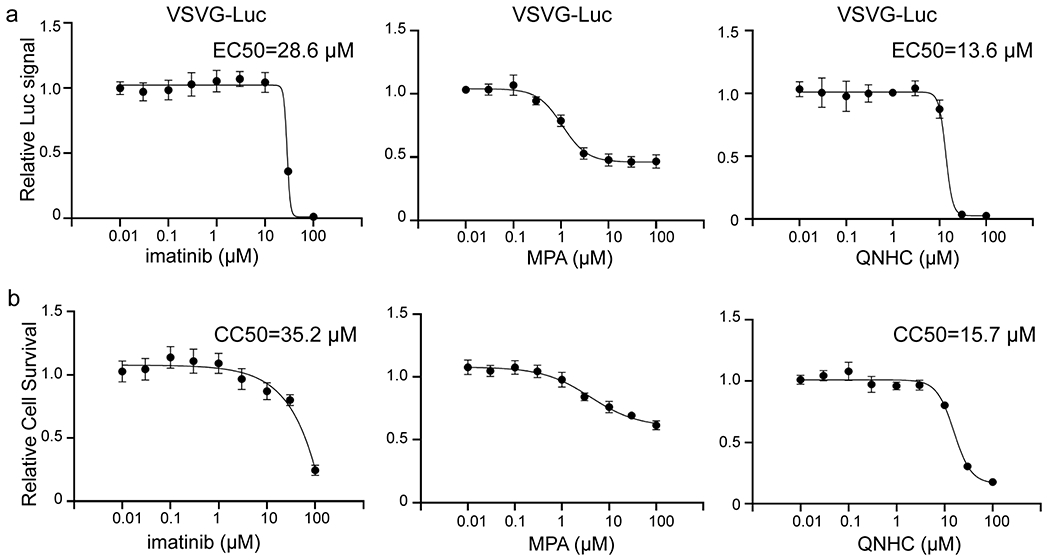
a, Inhibition curve of imatinib, MPA and QNHC on VSVG virus. n=3 biological independent experiments. b, Cell survival curve of imatinib, MPA and QNHC. n=3 biological independent experiments. Data are representative of at least three independent experiments.
Extended Data Figure 10. The impact of imatinib, MPA and QNHC on different steps of viral entry.
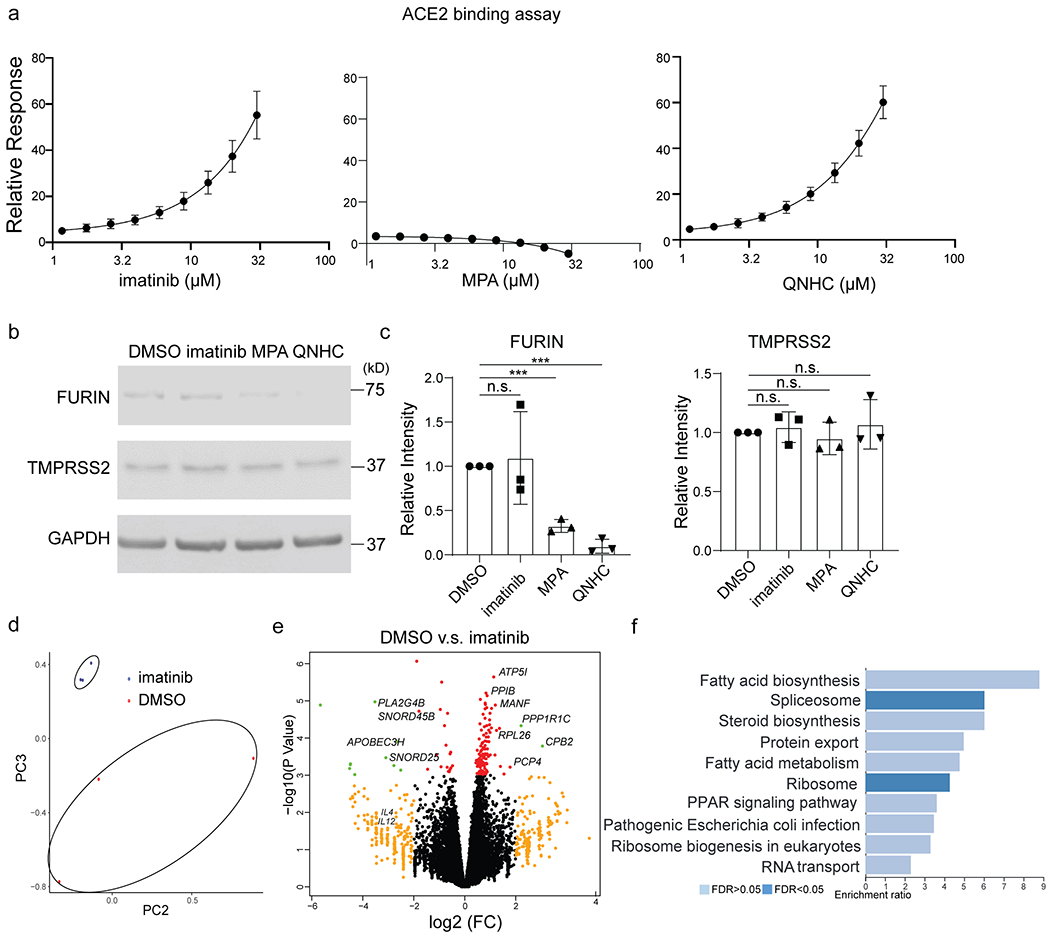
a. ACE2 binding assay. b, c, Western blotting (b) and quantification (c) of TMPRSS2 and FURIN of DMSO, imatinib, MPA and QNHC treated hPSC-LOs. n=3 biological independent experiments, P=0.771, ***P=8.86E-05, ***P=3.86E-05. d, PCA plot of RNA-seq data from hPSC-LOs treated with DMSO or 10 μM imatinib at 24 hpi of SARS-CoV-2 virus. e, Volcano plot analysis of differential gene expression of hPSC-LOs treated with DMSO or 10 μM imatinib at 24 hpi of SARS-CoV-2 virus. Individual genes are denoted by gene name. f, Gene over-representation analysis on KEGG pathway database of differential expression of hPSC-LOs pretreated with DMSO or 10 μM imatinib at 24 hpi of SARS-CoV-2 virus. n=3 biological independent experiments. ***P < 0.001. Data were analyzed by an unpaired two-tailed Student’s t-test and shown as mean ± STDEV. Data are representative of at least three independent experiments.
Supplementary Material
Acknowledgements.
This work was supported by the Department of Surgery, Weill Cornell Medicine (T.E., F.P, S.C.), American Diabetes Association (7–20-COVID-211 to S.C.), NIDDK (R01 DK124463, DP3 DK111907–01, R01 DK116075–01A1, R01 DK119667–01A1 to S.C.), NCI (R01), NIAID (2R01AI107301) and NIDDK (R01DK121072 and 1RO3DK117252), Department of Medicine, Weill Cornell Medicine (R.E.S.), by the Defense Advanced Research Projects Agency under Cooperative Agreements W911NF-16-C-0050 and the Marc Haas Foundation to (B.tO) and by the Jack Ma Foundation (D.D.H). S.C and R.E.S. are supported as Irma Hirschl Trust Research Award Scholars. V.G. is a Weill Cornell Department of Medicine Fund for the Future awardee, supported by the Kellen Foundation. The authors would like to thank Dr. Harold Varmus at Weill Cornell Medicine for his support and Dr. Tom Moran, Center for Therapeutic Antibody Discovery at the Icahn School of Medicine at Mount Sinai for providing anti-SARS-CoV-SPIKE antibody. The authors would like to thank Dr. Surya V. Shehan for completing the electron microscopy analysis and Bing He for performing the in situ hybridization. We are also very grateful for technical support and advice provided by Lee Cohen-Gould and Robert Lance Furler in the Cell Screening Core Facility of WCM.
Footnotes
Competing Interests.
R.E.S. is on the scientific advisory board of Miromatrix Inc. L.C.C. is a founder and member of the board of directors of Agios Pharmaceuticals and is a founder and receives research support from Petra Pharmaceuticals. L.C.C. is an inventor on patents (pending) for Combination Therapy for PI3K-associated Disease or Disorder, and The Identification of Therapeutic Interventions to Improve Response to PI3K Inhibitors for Cancer Treatment. L.C.C. is a co-founder and shareholder in Faeth Therapeutics. T.M.Y. is a stockholder and on the board of directors of DESTROKE, Inc., an early-stage start-up developing mobile technology for automated clinical stroke detection. The other authors declare no competing interests.
Main references
- 1.Pan L et al. Clinical Characteristics of COVID-19 Patients With Digestive Symptoms in Hubei, China: A Descriptive, Cross-Sectional, Multicenter Study. Am J Gastroenterol 115, 766–773, doi: 10.14309/ajg.0000000000000620 (2020). [DOI] [PMC free article] [PubMed] [Google Scholar]
- 2.Lamers MM et al. SARS-CoV-2 productively infects human gut enterocytes. Science, doi: 10.1126/science.abc1669 (2020). [DOI] [PMC free article] [PubMed] [Google Scholar]
- 3.Zhou J et al. Infection of bat and human intestinal organoids by SARS-CoV-2. Nat Med, doi: 10.1038/s41591-020-0912-6 (2020). [DOI] [PubMed] [Google Scholar]
- 4.Monteil V et al. Inhibition of SARS-CoV-2 Infections in Engineered Human Tissues Using Clinical-Grade Soluble Human ACE2. Cell 181, 905–913 e907, doi: 10.1016/j.cell.2020.04.004 (2020). [DOI] [PMC free article] [PubMed] [Google Scholar]
- 5.Chen YW et al. A three-dimensional model of human lung development and disease from pluripotent stem cells. Nat Cell Biol 19, 542–549, doi: 10.1038/ncb3510 (2017). [DOI] [PMC free article] [PubMed] [Google Scholar]
- 6.Huang SX et al. Efficient generation of lung and airway epithelial cells from human pluripotent stem cells. Nat Biotechnol 32, 84–91, doi: 10.1038/nbt.2754 (2014). [DOI] [PMC free article] [PubMed] [Google Scholar]
- 7.Jacob A et al. Differentiation of Human Pluripotent Stem Cells into Functional Lung Alveolar Epithelial Cells. Cell Stem Cell 21, 472–488 e410, doi: 10.1016/j.stem.2017.08.014 (2017). [DOI] [PMC free article] [PubMed] [Google Scholar]
- 8.Mou H et al. Generation of multipotent lung and airway progenitors from mouse ESCs and patient-specific cystic fibrosis iPSCs. Cell Stem Cell 10, 385–397, doi: 10.1016/j.stem.2012.01.018 (2012). [DOI] [PMC free article] [PubMed] [Google Scholar]
- 9.McCauley KB et al. Efficient Derivation of Functional Human Airway Epithelium from Pluripotent Stem Cells via Temporal Regulation of Wnt Signaling. Cell Stem Cell 20, 844–857 e846, doi: 10.1016/j.stem.2017.03.001 (2017). [DOI] [PMC free article] [PubMed] [Google Scholar]
- 10.Hurley K et al. Reconstructed Single-Cell Fate Trajectories Define Lineage Plasticity Windows during Differentiation of Human PSC-Derived Distal Lung Progenitors. Cell Stem Cell 26, 593–608 e598, doi: 10.1016/j.stem.2019.12.009 (2020). [DOI] [PMC free article] [PubMed] [Google Scholar]
- 11.Jacob A et al. Derivation of self-renewing lung alveolar epithelial type II cells from human pluripotent stem cells. Nat Protoc 14, 3303–3332, doi: 10.1038/s41596-019-0220-0 (2019). [DOI] [PMC free article] [PubMed] [Google Scholar]
- 12.Dye BR et al. In vitro generation of human pluripotent stem cell derived lung organoids. Elife 4, doi: 10.7554/eLife.05098 (2015). [DOI] [PMC free article] [PubMed] [Google Scholar]
- 13.Chen HJ et al. Generation of pulmonary neuroendocrine cells and SCLC-like tumors from human embryonic stem cells. J Exp Med 216, 674–687, doi: 10.1084/jem.20181155 (2019). [DOI] [PMC free article] [PubMed] [Google Scholar]
- 14.Hoffmann M et al. SARS-CoV-2 Cell Entry Depends on ACE2 and TMPRSS2 and Is Blocked by a Clinically Proven Protease Inhibitor. Cell, doi: 10.1016/j.cell.2020.02.052 (2020). [DOI] [PMC free article] [PubMed] [Google Scholar]
- 15.Shang J et al. Cell entry mechanisms of SARS-CoV-2. Proc Natl Acad Sci U S A 117, 11727–11734, doi: 10.1073/pnas.2003138117 (2020). [DOI] [PMC free article] [PubMed] [Google Scholar]
- 16.Whitt MA Generation of VSV pseudotypes using recombinant DeltaG-VSV for studies on virus entry, identification of entry inhibitors, and immune responses to vaccines. J Virol Methods 169, 365–374, doi: 10.1016/j.jviromet.2010.08.006 (2010). [DOI] [PMC free article] [PubMed] [Google Scholar]
- 17.Nie J et al. Establishment and validation of a pseudovirus neutralization assay for SARS-CoV-2. Emerg Microbes Infect 9, 680–686, doi: 10.1080/22221751.2020.1743767 (2020). [DOI] [PMC free article] [PubMed] [Google Scholar]
- 18.Blanco-Melo D et al. Imbalanced Host Response to SARS-CoV-2 Drives Development of COVID-19. Cell 181, 1036–1045 e1039, doi: 10.1016/j.cell.2020.04.026 (2020). [DOI] [PMC free article] [PubMed] [Google Scholar]
- 19.Crespo M et al. Colonic organoids derived from human induced pluripotent stem cells for modeling colorectal cancer and drug testing. Nat Med 23, 878–884, doi: 10.1038/nm.4355 (2017). [DOI] [PMC free article] [PubMed] [Google Scholar]
- 20.Munera JO et al. Differentiation of Human Pluripotent Stem Cells into Colonic Organoids via Transient Activation of BMP Signaling. Cell Stem Cell 21, 51–64 e56, doi: 10.1016/j.stem.2017.05.020 (2017). [DOI] [PMC free article] [PubMed] [Google Scholar]
- 21.Gordon DE et al. A SARS-CoV-2-Human Protein-Protein Interaction Map Reveals Drug Targets and Potential Drug-Repurposing. bioRxiv, doi: 10.1101/2020.03.22.002386 (2020). [DOI] [PMC free article] [PubMed] [Google Scholar]
- 22.Zhao X et al. Immunization-Elicited Broadly Protective Antibody Reveals Ebolavirus Fusion Loop as a Site of Vulnerability. Cell 169, 891–904 e815, doi: 10.1016/j.cell.2017.04.038 (2017). [DOI] [PMC free article] [PubMed] [Google Scholar]
- 23.Liu L et al. Potent neutralizing antibodies directed to multiple epitopes on SARS-CoV-2 spike. Nature, doi: 10.1038/s41586-020-2571-7 (2020). [DOI] [PubMed] [Google Scholar]
- 24.10.1016/j.cell.2020.04.026, h. D. [DOI]
- 25.Yang L et al. A Human Pluripotent Stem Cell-based Platform to Study SARS-CoV-2 Tropism and Model Virus Infection in Human Cells and Organoids. Cell Stem Cell 27, 125–136 e127, doi: 10.1016/j.stem.2020.06.015 (2020). [DOI] [PMC free article] [PubMed] [Google Scholar]
- 26.Lun AT, Bach K & Marioni JC Pooling across cells to normalize single-cell RNA sequencing data with many zero counts. Genome Biol 17, 75, doi: 10.1186/s13059-016-0947-7 (2016). [DOI] [PMC free article] [PubMed] [Google Scholar]
- 27.Stuart T et al. Comprehensive Integration of Single-Cell Data. Cell 177, 1888–1902 e1821, doi: 10.1016/j.cell.2019.05.031 (2019). [DOI] [PMC free article] [PubMed] [Google Scholar]
- 28.van den Brink SC et al. Single-cell sequencing reveals dissociation-induced gene expression in tissue subpopulations. Nat Methods 14, 935–936, doi: 10.1038/nmeth.4437 (2017). [DOI] [PubMed] [Google Scholar]
- 29.Travaglini KJ et al. A molecular cell atlas of the human lung from single cell RNA sequencing. bioRxiv, 742320, doi: 10.1101/742320 (2020). [DOI] [PMC free article] [PubMed] [Google Scholar]
- 30.Robinson MD, McCarthy DJ & Smyth GK edgeR: a Bioconductor package for differential expression analysis of digital gene expression data. Bioinformatics 26, 139–140, doi: 10.1093/bioinformatics/btp616 (2010). [DOI] [PMC free article] [PubMed] [Google Scholar]
- 31.Liao Y, Wang J, Jaehnig EJ, Shi Z & Zhang B WebGestalt 2019: gene set analysis toolkit with revamped UIs and APIs. Nucleic Acids Res 47, W199–W205, doi: 10.1093/nar/gkz401 (2019). [DOI] [PMC free article] [PubMed] [Google Scholar]
Associated Data
This section collects any data citations, data availability statements, or supplementary materials included in this article.
Supplementary Materials
Data Availability Statement
RNA-seq data of hPSC-LOs and lung autopsy samples is publicly available on the GEO repository database under the accession number GSE155241. scRNA-seq data of hPSC-LOs is publicly available on the GEO repository database under the accession number GSE148113. scRNA-seq data of hPSC-COs are publicly available on the GEO repository database, accession number GSE147975. RNA-seq of hPSC-derived endocrine cells and liver organoids are available on the GEO repository database, accession number GSE151803.
Source Data behind Figs. 1c, d, g, k; 2i; 3a, e, k; 4a, c, g, i; Extended Data Figs 1d, e; 5a; 6a, c, d; 7a, c; 8a, c, e; 9a, d; 10a, c, are available within the manuscript files.


