

Abstract
Compared with each monoinfection, coinfection with hepatitis B virus (HBV) and hepatitis C virus (HCV) is well known to increase the risks of developing liver cirrhosis and hepatocellular carcinoma. However, the mechanism by which HBV/HCV coinfection is established in hepatocytes is not well understood. Common cell culture models for coinfection are required to examine viral propagation. In this study, we aimed to establish a cell line permissive for both HBV and HCV infection. We first prepared a HepG2 cell line expressing sodium taurocholate cotransporting polypeptide, an HBV receptor, and then selected a cell line highly permissive for HBV infection, G2/NT18‐B. After transduction with a lentivirus‐encoding microRNA‐122, the cell line harboring the highest level of replicon RNA was selected and then treated with anti‐HCV compounds to eliminate the replicon RNA. The resulting cured cell line was transduced with a plasmid‐encoding CD81. The cell line permissive for HCV infection was cloned and then designated the G2BC‐C2 cell line, which exhibited permissiveness for HBV and HCV propagation. JAK inhibitor I potentiated the HCV superinfection of HBV‐infected cells, and fluorescence‐activated cell‐sorting analysis indicated that HBV/HCV double‐positive cells accounted for approximately 30% of the coinfected cells. Among several host genes tested, cyclooxygenase‐2 showed synergistic induction by coinfection compared with each monoinfection. Conclusion: These data indicate that our in vitro HBV/HCV coinfection system provides an easy‐to‐use platform for the study of host and viral responses against coinfection and the development of antiviral agents targeting HBV and HCV.
Abbreviations
- ANOVA
analysis of variance
- CD81
cluster of differentiation 81
- COX‐2
cyclooxygenase‐2
- C2
G2BC‐C2
- DAA
direct‐acting antiviral
- DAPI
4′,6‐diamidino‐2‐phenylindole
- DMEM
Dulbecco’s modified Eagle’s medium
- DMSO
dimethyl sulfoxide
- dpi
days post infection
- D5
G2BC‐D5
- EGFR
epidermal growth factor receptor
- FACS
fluorescence‐activated cell sorting
- FBS
fetal bovine serum
- FGR
full‐genomic replicon
- GEq
genome equivalents
- G2
HepG2
- G2/NT
G2/NT18‐B
- HBc
hepatitis B core
- HBx
hepatitis B x protein
- HBV
hepatitis B virus
- HCC
hepatocellular carcinoma
- HCV
hepatitis C virus
- HCVcc
cell culture–derived HCV
- HCVpp
HCV pseudoparticles
- hpi
hours post infection
- IFN
interferon
- IgG
immunoglobulin G
- ISG
interferon‐stimulated gene
- JAK
Janus kinase
- miR‐122
microRNA‐122
- moi
multiplicity of infection
- mRNA
messenger RNA
- NTCP
sodium taurocholate cotransporting polypeptide
- PBS
phosphate‐buffered saline
- PCR
polymerase chain reaction
- PHH
primary human hepatocyte
- PMM
primary maintenance medium
- SGR
subgenomic replicon
- STAT
signal transducer and activator of transcription
- VEGF
vascular endothelial growth factor
Hepatitis B virus (HBV) and hepatitis C virus (HCV) are causative agents of chronic hepatitis and are well‐recognized major risk factors for cirrhosis and hepatocellular carcinoma (HCC). Chronic HBV and HCV infections affect approximately 250 million people worldwide.( 1 ) Approximately 10% to 15% of all patients with HCV worldwide are also infected with HBV.( 2 ) Several reports have shown that, compared with each monoinfection, HBV/HCV coinfection exacerbates liver disorders, including hepatitis and cirrhosis, and is associated with increased risks of cirrhosis and HCC.( 2 , 3 , 4 ) Rodríguez‐Íñigo et al. reported that HBV and HCV coexisted in the same hepatocyte prepared from liver biopsy samples of a patient.( 5 ) Furthermore, current HCV therapeutics involving direct‐acting antivirals (DAAs) achieve sustained virological responses more than 95% of the time, although several reports have suggested that HCV elimination by DAA treatment induces HBV reactivation and hepatitis flareups in coinfected patients.( 2 , 3 ) However, the virological mechanisms by which HBV/HCV coinfection exacerbates liver disorders and how HBV is reactivated after HCV elimination are not yet understood.
It is difficult to elucidate the virological aspects of HBV/HCV coinfection, as distributed reliable models for in vitro coinfection are not established. Hepatoma cell lines, including Huh7 and others, have generally been used because of their permissiveness to HCV infection and to replication( 6 , 7 ); however, these cell lines are not susceptible to HBV infection. The Huh7 cell line is permissive for HBV replication and viral particle formation, but not to events related to viral uncoating and replication due to the lack of unidentified host factor(s).( 8 ) On the other hand, the HepaRG cell line, primary human hepatocytes (PHHs), and HepG2‐derived cell lines stably expressing human sodium taurocholate cotransporting polypeptide (NTCP), which has been identified as a functional HBV receptor,( 9 ) have generally been used as in vitro culture models for HBV infection. However, these models are not permissive for HCV infection or replication. HCV cannot enter into and replicate in HepG2 cells because they lack cluster of differentiation 81 (CD81) and liver‐specific microRNA‐122 (miR‐122), the key host factors responsible for HCV entry and replication, respectively.( 10 , 11 , 12 ) The HLCZ01 cell line was isolated from a liver tumor and has been reported to be susceptible to infection with HBV and HCV.( 13 ) The replication levels of HBV and HCV in coinfected HLCZ01 cells are comparable to those in individually monoinfected cells, suggesting no or low interference between HBV and HCV replication.( 13 ) The HLCZ01 cell line was isolated from the liver tumor of a patient with chronic HCV and then inoculated into immunodeficient mice before establishment( 13 ); however, this cell line was not derived from a common cell line and has not been thoroughly characterized. The H7HBV‐93.1‐S2204I cell line, a Huh7‐derived cell line, harbors the HBV genome under the control of a tetracycline‐regulated promoter and subgenomic HCV RNA with an adaptive mutation in NS5A.( 14 ) As HCV can superinfect this cell line but HBV cannot, whether HBV and HCV interfere with each other remains unclear.
In this study, we established a HepG2‐derived cell line, G2BC‐C2, that is infectable by both HBV and HCV and then determined the cell culture conditions suitable for coinfection. Several host factors related to viral pathogenesis were expressed at higher levels in the coinfection cultures than in each monoinfection culture. Host gene expression induced by coinfection may be correlated with the exacerbation of liver disorders.
Materials and Methods
Cells
The human embryonic kidney (HEK) 293T cell line, human hepatoma Huh7‐derived cell lines, and HepG2 cell lines were maintained in Dulbecco’s modified Eagle’s medium (DMEM; Sigma‐Aldrich, St. Louis, MO), supplemented with 10% fetal bovine serum (FBS; Gibco, Cambrex, MD), nonessential amino acids (Sigma‐Aldrich), sodium pyruvate (Sigma‐Aldrich), 100 U/mL penicillin, and 100 μg/mL streptomycin (Gibco).( 6 , 7 , 15 , 16 ) Huh7‐derived and HepG2‐derived cell lines harboring HCV replicon RNAs were maintained in culture medium supplemented with 0.5 mg/mL or 1.0 mg/mL G418 (Nacalai Tesque, Kyoto, Japan), respectively. HepG2‐derived cell lines stably expressing human NTCP or CD81 were maintained in the presence of 1 µg/mL puromycin (Nacalai Tesque) or 400 µg/mL zeocin (Invitrogen, Carlsbad, CA), respectively. PHHs, PXB cells, were purchased from Phoenix Bio (Hiroshima, Japan) and cultured in the manufacturer’s medium for PXB cells (PhoenixBio). All cell lines were cultured at 37°C in a 5% CO2 humidified incubator.
Colony Formation Assay
The plasmids pFK‐I389neo/NS3‐3’/NK5.1 and pFK‐I389neo/full‐genomic replicon (FGR),( 17 ) which encode subgenomic replicon (SGR) and FGR, respectively, of the HCV genotype 1b isolate Con1 were linearized with ScaI and transcribed in vitro using a MEGAscript T7 kit (Ambion, Austin, TX). The synthesized RNA was electroporated into HepG2 cell derivatives according to the method described by Date et al.( 18 ) The cells were seeded in a 10‐cm dish and cultured in a medium containing 1 mg/mL G418 at 24 hours after transfection. The resulting colonies were fixed with ice‐cold methanol at 21 days after transfection and stained with crystal violet.
Detection and Quantification of Viral Agents
The plasmid pBluescript‐NS3 was linearized with HindIII and transcribed in vitro with a DIG Northern Starter kit (Roche, Indianapolis, IN) to synthesize a specific probe against HCV positive‐strand RNA. Total RNA was extracted from cells using an RNeasy Mini Kit (Qiagen, Valencia, CA) and subjected to northern blotting according to a method described previously.( 19 ) For detection of intracellular proteins, cells were lysed on ice in lysis buffer (20 mM Tris‐HCl [pH 7.5], 135 mM NaCl, 10% glycerol, and 1% Nonidet P‐40) supplemented with a complete protease inhibitor cocktail (Roche) and subjected to western blotting according to a method described previously.( 7 ) The amount of HCV core in the lysate was determined by a chemiluminescent immunoassay (SRL Inc., Tokyo, Japan).
Focus‐Forming and Immunofluorescence Assays
HCV titers in culture supernatants were determined by a focus‐forming assay as described previously.( 7 ) Cells were fixed with 4% paraformaldehyde (Wako Pure Chemical Industries, Ltd., Osaka, Japan) and permeabilized with 0.5% Triton X‐100 (Wako). The cells were blocked with phosphate‐buffered saline (PBS) containing 2% BSA (PBS/BSA) and then incubated with an appropriate antibody at 4°C overnight. The cells were washed with PBS and incubated with PBS/BSA containing Alexa 488‐conjugated or Alexa 594‐conjugated secondary antibodies and 4′,6‐diamidino‐2‐phenylindole (DAPI) at room temperature for 1 hour. The cells were then washed three times with PBS and observed with a fluorescence microscope (Keyence, Tokyo, Japan) or a FluoView FV1000 laser scanning confocal microscope (Olympus, Tokyo, Japan). To quantify mean fluorescent intensity of HCV or HBV signal, arbitrarily selected five fields of image were analyzed using Image J software.
Fluorescence‐Activated Cell Sorting Analysis
Fluorescein amidite–conjugated wild‐type and N9K‐mutant forms of a preS1 lipopeptide were synthesized as described previously.( 16 ) The ability of the preS1 lipopeptide to bind to NTCP on the cell surface was analyzed as described previously.( 16 ) For evaluation of CD81 expression, 1 × 10⁶ cells were incubated with a peptide‐conjugated mouse anti‐human CD81 antibody or an isotype control mouse immunoglobulin G (IgG) antibody (BD Biosciences, San Jose, CA) at room temperature for 30 minutes in 50 µL of PBS containing 2% FBS (PBS/FBS) and washed twice with PBS/FBS. For the detection of hepatitis B core (HBc) and NS5A expression, infected cells were sequentially incubated with mouse anti‐HBc and/or rabbit anti‐NS5A antibodies at 4°C overnight and with an Alexa‐488‐conjugated anti‐mouse IgG rabbit antibody and/or an Alexa‐647‐conjugated anti‐rabbit IgG mouse antibody on ice for 90 minutes. After washing, individual treated cells were suspended in PBS containing 0.5% BSA. The stained cells were analyzed with a FACSCalibur instrument (BD Biosciences). The cytometric data were analyzed with Cell Quest (BD Biosciences) or FlowJo software (FlowJo, LLC, Ashland, OR).
Other materials and methods are available in the Supporting Information.
Results
Establishment of HBV‐Permissive HepG2 Cell Lines
We previously established an HBV‐permissible cell line, HepG2/NTCPA3.( 16 ) The HepG2/NTCPA3 cell line showed higher messenger RNA (mRNA) expression of NTCP and a higher binding ability for preS1 lipopeptides than the HepG2‐hNTCP‐C4 cell line, which was established as another HBV‐permissive cell line( 20 ) (Fig. 1A and Supporting Fig. S1). However, the infectivity of HBV was higher in HepG2‐hNTCP‐C4 cells than in HepG2/NTCPA3 cells (Fig. 1B,C). In this study, we further cloned three cell lines expressing NTCP and designated them as G2/NT18‐A, G2/NT18‐B, and G2/NT18‐C. The G2/NT18‐A, G2/NT18‐B, and G2/NT18‐C cell lines possessed a better ability to bind to a preS1 lipopeptide than the HepG2/NTCPA3 and HepG2‐hNTCP‐C4 cell lines (Fig. 1A). These cells were incubated with various amounts of HBV under previously reported nonadherent conditions.( 16 ) HBV infection was detected in the HepG2‐hNTCP‐C4, G2/NT18‐A, and G2/NT18‐B cell lines when HBV was inoculated at 10 genome equivalents (GEq)/cell. On the other hand, at least 30 or 100 GEq/cell HBV was required for detectable infection of the G2/NT18‐C and HepG2/NTCPA3 cell lines (Fig. 1B). The amount of supernatant HBV in G2/NT18‐B or G2/NT18‐C cell cultures was remarkably increased at 9 and 12 days post infection (dpi) (Fig. 1C). The amounts of supernatant HBV antigens and intracellular HBc were also produced at a higher level in the G2/NT18‐B and G2/NT18‐C cells than in others (Supporting Fig. S1B,C). Thus, we used the G2/NT18‐B and G2/NT18‐C cell lines for subsequent experiments.
Fig. 1.
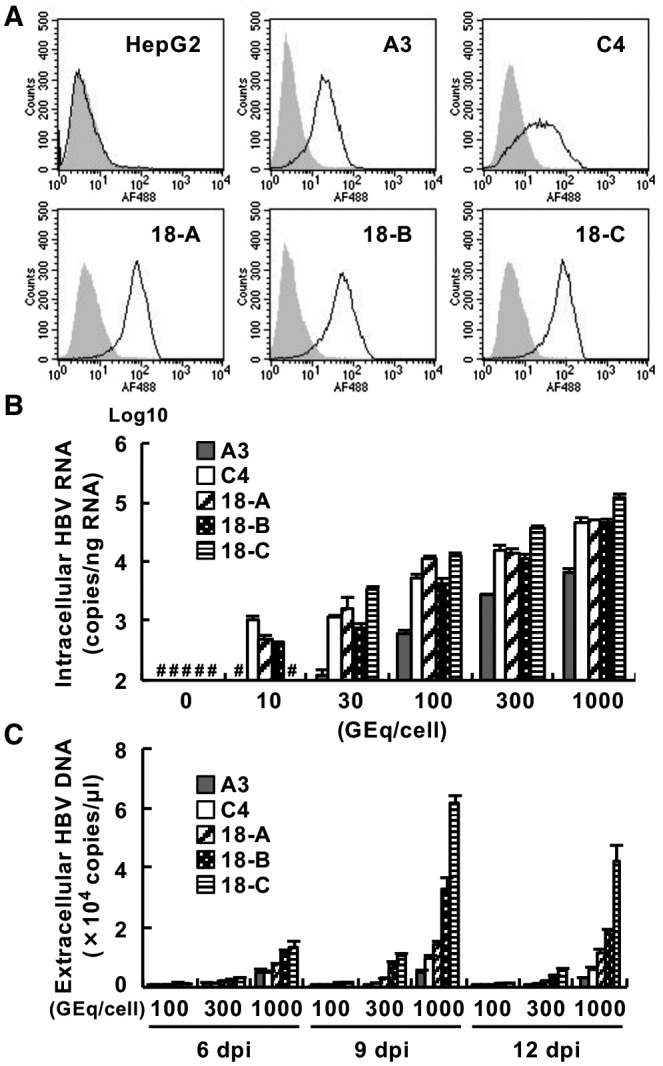
Establishment of cell lines permissive for HBV infection. (A) Binding of the wild‐type form (black line) or N9K‐mutant form (gray histogram) of a preS1 lipopeptide to each cell line was analyzed by FACS analysis. (B) HepG2‐derived cell lines were infected with various amounts of HBV. The resulting cells were harvested at 6 dpi to measure the amount of intracellular HBV RNA by quantitative real‐time polymerase chain reaction (PCR). (C) Cells were infected with various amounts of HBV. The amounts of supernatant HBV DNA harvested at the indicated times were measured by quantitative PCR. #Not detected. Abbreviations: A3, HepG2/NTCPA3; C4, HepG2‐hNTCP‐C4; 18‐A, G2/NT18‐A; 18‐B, G2/NT18‐B; 18‐C, G2/NT18‐C.
Establishment of a HepG2‐Derived Cell Line Highly Permissive for HCV Replication
Exogenous expression of miR‐122 has been reported to support efficient replication of HCV in several hepatic cell lines, including the HepG2 cell line and nonhepatic cell lines.( 10 , 11 , 12 ) Thus, we transduced G2/NT18‐B cells with lentiviruses encoding miR‐122 and then prepared cells expressing miR‐122 (G2/NT/122). The level of miR‐122 was significantly lower in G2/NT18‐B cells than in Huh7 cells, whereas G2/NT/122 cells expressed approximately two times more miR‐122 than Huh7 cells (Fig. 2A). We carried out a colony formation assay to investigate whether G2/NT/122 cells support HCV replication. The G2/NT/122 cells exhibited a colony formation activity of 32.8 colonies/µg of RNA using HCV‐SGR RNA, whereas G2/NT18‐B cells transfected with SGR RNA and G2/NT/122 cells transfected with replicase‐dead SGR RNA exhibited no colony formation ability (Supporting Fig. S2A). We isolated several colonies from the G418‐resistant colonies of the transfected G2/NT/122 cells, selected the clone harboring the highest level of replicon RNA, and designated it as the G2/NT/SGR1 cell line (Fig. 2B). Unfortunately, no replicon cell line could be prepared using G2/NT18‐C cells expressing miR‐122 (data not shown). G2/NT/SGR1 cells were treated with both daclatasvir and telaprevir for 1 week to eliminate HCV‐SGR RNA. The resulting cells lacking the replicon RNA were designated as G2/NT/SGR1cure cells. The amount of intracellular HCV‐SGR RNA was significantly lower in G2/NT/SGR1 cells than in a Huh7‐derived cell line harboring HCV SGR (Huh7/SGR), whereas HCV‐SGR RNA was not detected in HepG2, G2/NT18‐B, or G2/NT/SGR1cure cells (Fig. 2B). G2/NT/SGR1 cells, but not G2/NT/SGR1cure cells, harbored HCV‐SGR RNA at the same molecular size as the replicon RNA of Huh7/SGR cells (Fig. 2C, upper half of the panel), whereas NS5A was expressed in G2/NT/SGR1 cells but not in G2/NT/SGR1cure cells (Fig. 2C, lower half of the panel). The mRNA levels of NTCP and the binding extent of preS1 lipopeptides were almost comparable among the G2/NT18‐B, G2/NT/SGR1, and G2/NT/SGR1cure cell lines (Fig. 2D and Supporting Fig. S2B). We also established HepG2‐derived cell lines harboring HCV‐FGR RNA (G2/NT/FGR) based on G2/NT/SGR1cure cells. The G2/NT/FGR6 cell line, which harbored the highest level of replicon RNA, was treated with DAAs to completely eliminate the replicon RNA. The resulting cells (G2/NT/FGR6cure) possessed no replicon RNA, expressed NTCP, and exhibited an ability to bind a preS1 peptide (Supporting Fig. S3). Additional information is available in the Supporting Information Results.
Fig. 2.
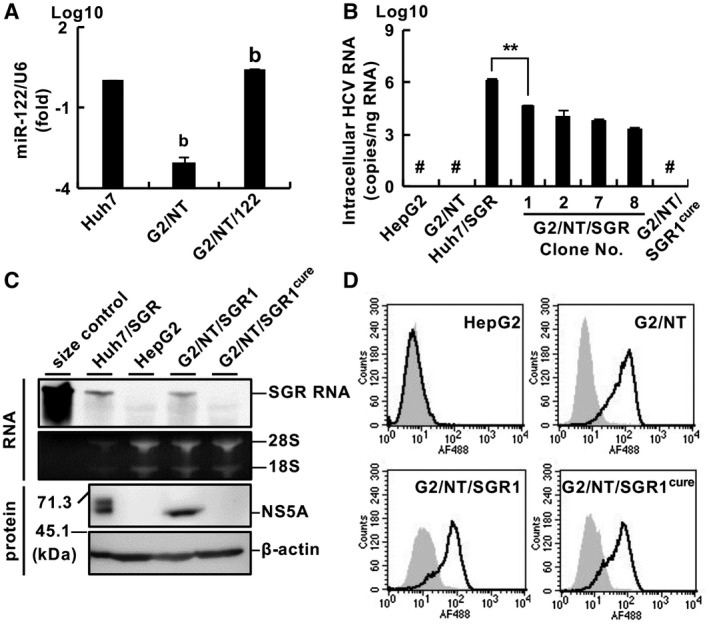
Establishment of HepG2‐derived cell lines supporting HBV infection and HCV replication. (A) Ratio of the relative expression levels of miR‐122 and U6 small nuclear RNA was evaluated by quantitative real‐time PCR. Statistical significance was calculated by one‐way analysis of variance (ANOVA) followed by Dunnett’s post hoc test to compare values for other cell lines with that for Huh7 cells (b, P < 0.01). (B) Amount of intracellular HCV RNA was measured by quantitative real‐time PCR. Statistical significance was calculated by Student t test (**P < 0.01). (C) Upper half of the panel: Total RNA was subjected to northern blot analysis using an RNA probe specific for the NS3 gene. Ribosomal RNAs were stained with ethidium bromide. In vitro–transcribed SGR RNA was applied as a size control. Lower half of the panel: Cell lysates were subjected to western blot analysis. (D) Cells were incubated with the wild‐type form (black line) or N9K‐mutant form (gray histogram) of a preS1 lipopeptide and analyzed by flow cytometry. #Not detected. Abbreviation: G2/NT, G2/NT18‐B.
Effects of dimethyl sulfoxide on HBV Infection and HCV Replication
Huh7 cells and their derivatives are generally maintained in DMEM‐based medium for HCV infection,( 7 , 11 , 12 ) whereas HepG2‐derived cell lines are cultured in primary maintenance medium (PMM) or DMEM/F‐12 (F‐12)–based medium for HBV infection.( 9 , 13 , 16 , 20 ) The medium compositions are listed in Supporting Table S1. Thus, we attempted to determine the culture conditions suitable for infections with HBV and HCV. Cell lines were infected with HBV in the medium conditions shown in Supporting Fig. S4. The cells were infected with HBV and then incubated in PMM, F‐12, or DMEM‐based medium, corresponding to conditions 1, 3 and 4, respectively (Supporting Fig. S4), whereas other cells were inoculated with HBV in PMM and then incubated in the DMEM‐based medium (condition 2). The cells were harvested at 6 dpi. The amount of intracellular HBV RNA was higher in G2/NT/SGR1cure and G2/NT/SGR1 cells under conditions 1 and 4 than under conditions 2 and 3 (Fig. 3A). The amount of intracellular HBV RNA was lower in the G2/NT18‐B and G2/NT/122 cell lines than in the G2/NT/SGR1cure and G2/NT/SGR1 cell lines when those cell lines were cultivated under conditions 1 or 4. In contrast, the amount of extracellular HBV DNA was highest in each cell line under condition 3 (Fig. 3B). In G2/NT18‐B and G2/NT/SGR1 cells, the amount of extracellular HBV DNA was also slightly higher in condition 3 than in the other conditions (Fig. 3B). The amount of HCV replicon RNA was significantly lower in each replicon cell line under condition 1 than under the other conditions (Fig. 3C), suggesting that PMM impaired HCV replication. We finally selected condition 4 for maintaining HBV infection and HCV replication because the amounts of intracellular viral RNAs tended to be higher in each cell line under condition 4 than under the other conditions (Fig. 3A,C). Intracellular HBV RNA was easier to detect than extracellular DNA due to technical issues, although condition 3 induced the highest production of HBV DNA in each cell line (Fig. 3B). Furthermore, HBV infection was reported to be enhanced by treatment with dimethyl sulfoxide (DMSO).( 8 , 20 ) Then, we examined the effect of DMSO on the replication of both viruses. DMSO treatment increased the amounts of intracellular HBV RNA and extracellular HBV DNA (Fig. 3D,E), although it decreased the amount of intracellular HCV RNA in the replicon cell lines (Fig. 3F). These results suggest that treatment with DMSO remarkably potentiates HBV propagation but not HCV replication. The HBV or HCV permissiveness of the G2/NT/SGR1cure cell line was similar to that of the G2/NT/FGR6cure cell line (Fig. 3D‐F). The G2/NT/SGR1cure cell line was used for further study.
Fig. 3.
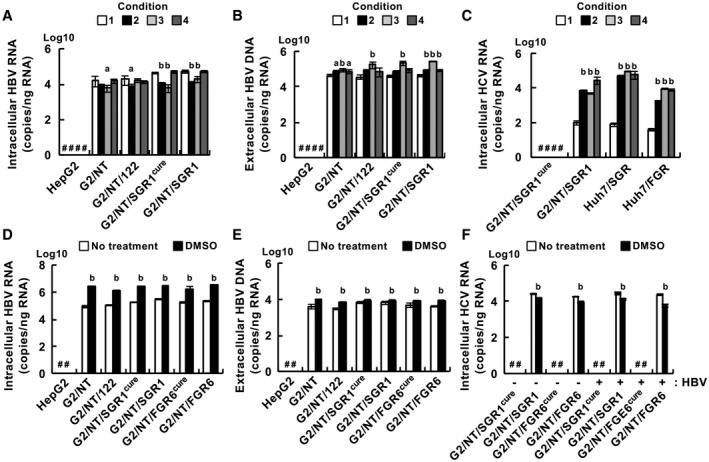
Effect of culture conditions on the replication of HBV and HCV. (A‐C) Cells were infected with HBV and then maintained for 6 days in various culture media, as shown in Supporting Fig. S4. The amounts of intracellular HBV RNA (A), extracellular HBV DNA (B), and intracellular HCV RNA (C) were measured by quantitative real‐time PCR or quantitative PCR. Statistical significance was calculated by one‐way ANOVA followed by Dunnett’s post hoc test to compare the results for other groups with those for the condition 1 group (a, P < 0.05; b, P < 0.01). (D,E) Cells were infected with HBV and then incubated for 6 days in condition 4 supplemented without (white bar) or with (black bar) 2% DMSO. The amounts of intracellular HBV RNA (D) and extracellular HBV DNA (E) were measured by quantitative real‐time RT‐PCR or quantitative PCR. (F) Cells infected with HBV (HBV+) or mock‐infected cells (HBV‐) were cultured for 6 days in the presence (black bar) or absence (white bar) of 2% DMSO. The amount of intracellular HCV RNA was measured by quantitative real‐time PCR. (D‐F) Statistical significance was calculated by one‐way ANOVA followed by Dunnett’s post hoc test to compare the DMSO groups with the non‐DMSO groups (b, P < 0.01). #Not detected.
Preparation of a Cell Line Permissive for HBV and HCV Infection by Supplementation With CD81
HepG2 cells expressing CD81, an HCV entry factor, are reported to be permissive for the entry of HCV pseudoparticles (HCVpp) and cell culture–derived HCV (HCVcc) but exhibit lower infectivity than Huh7 cells.( 12 , 21 ) Thus, we introduced a plasmid‐encoding CD81 into G2/NT/SGR1cure cells and isolated two clones, the G2BC‐C2 and G2BC‐D5 cell lines. CD81 was expressed on the cell surface of G2BC‐C2 and G2/BC‐D5 cells at a level similar to that of Huh7 cells (Fig. 4A). SR‐B1, OCLN, and CLDN1 were expressed in G2BC‐C2 and G2BC‐D5 cells at levels similar to those in Huh7 cells (Fig. 4B). HCVpp could infect the G2BC‐C2 and G2BC‐D5 cell lines but not the HepG2 cell line, although the susceptibility of the G2BC‐C2 and G2BC‐D5 cell lines was lower than that of the Huh7 cell line (Fig. 4C). The mRNA level of NTCP was slightly lower in G2BC‐C2 and G2BC‐D5 cells than in G2/NT‐18B cells (Supporting Fig. S5A), while the binding extent of a preS1 lipopeptide was comparable among these cell lines (Fig. 4D). Furthermore, the expression level of miR‐122 was maintained in the G2BC‐C2 and G2BC‐D5 cell lines (Supporting Fig. S5B). These data suggest that the G2BC‐C2 and G2BC‐D5 cell lines can support HCV replication and infection.
Fig. 4.
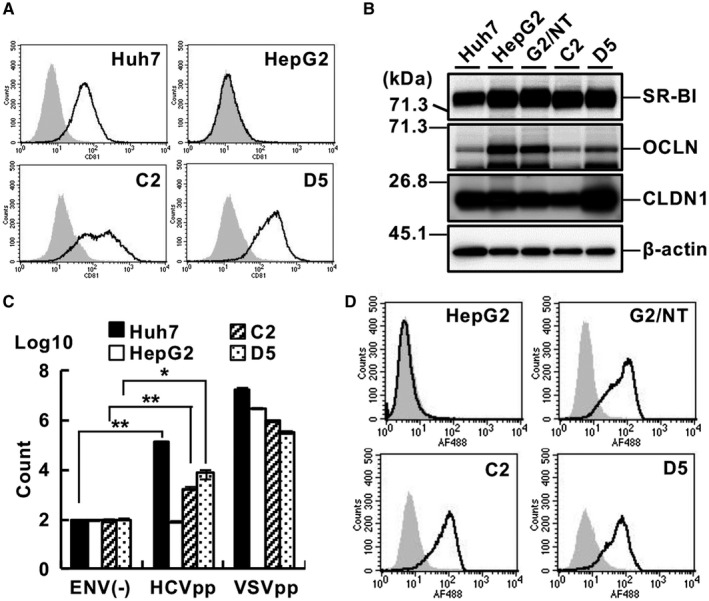
Efficiency of HCV entry into HepG2‐derived cell lines. (A) Expression of CD81 on the cell surface was analyzed by FACS using an anti‐CD81 antibody (black line) or an isotype control IgG (gray histogram). (B) Cell lysates of each cell line were subjected to western blot analysis. (C) Cells of each line were inoculated with HCVpp, vesicular stomatitis virus pseudoparticles, or nonenveloped pseudoparticles. The cells were harvested at 24 hpi and subjected to a luciferase assay. Statistical significance was calculated by Student t test (*P < 0.05; **P < 0.01). (D) Cells of each line were incubated with the wild‐type form (black line) or N9K‐mutant form (gray histogram) of a preS1 lipopeptide and then analyzed by FACS. Abbreviations: C2, G2BC‐C2; D5, G2BC‐D5; ENV(‐), nonenveloped pseudoparticles; G2, HepG2; VSVpp, vesicular stomatitis virus pseudoparticles.
Susceptibility of the G2BC‐C2 and G2BC‐D5 Cell Lines to HBV or HCV Infection
To test whether the G2BC‐C2 and G2BC‐D5 cell lines permit HCV infection, the cell lines were inoculated with HCVcc. The levels of intracellular HCV RNA and infectious HCV particles were increased by 24 hours post infection (hpi) and then reached a plateau in the G2BC‐C2 and G2BC‐D5 lines (Fig. 5A,B), whereas the same parameters increased logarithmically until 72 hpi in the Huh7 cell line (Fig. 5A,B). The intercellular spread of HCV may have been ineffective or slow in the G2BC‐C2 and G2BC‐D5 cell lines. Interferon (IFN) is known to suppress HCV replication through the induction of IFN‐stimulated genes (ISGs).( 22 ) We tested whether treatment with Janus kinase (JAK) inhibitor I (a pan‐JAK inhibitor) could improve the HCV propagation in G2BC‐C2 cells by suppressing the JAK/signal transducer and activator of transcription (STAT) pathway. Treatment with JAK inhibitor I, but not AG490 (a JAK2 inhibitor), significantly increased the amounts of intracellular HCV RNA and supernatant infectious particles produced by G2BC‐C2 cells (Fig. 5C,D). HCV‐positive cells were found in G2BC‐C2 and Huh7 cells (Fig. 5E).
Fig. 5.
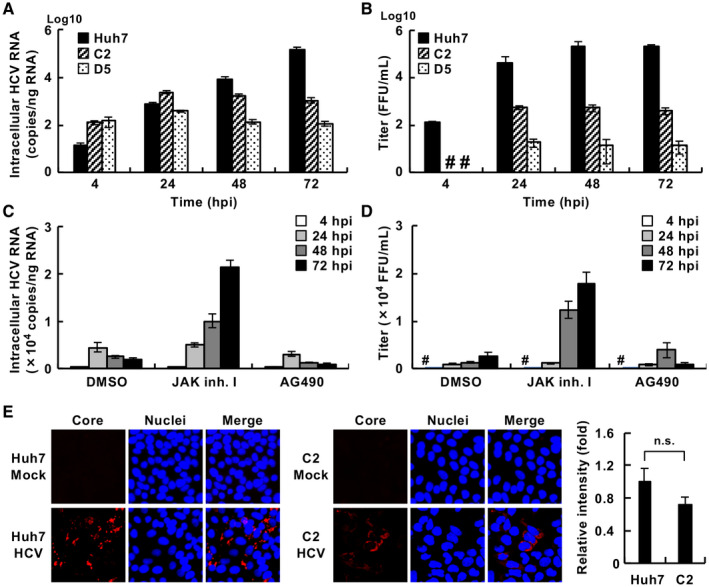
Permissiveness of the HepG2‐derived cell lines for HCV. (A,B) The indicated cells were incubated with the HCVcc JFH1 strain at a multiplicity of infection (moi) of 1 for 4 hours and then cultured in fresh medium until the indicated time points. The amounts of intracellular HCV RNA (A) and supernatant infectious particles (B) were measured by quantitative real‐time PCR and a focus‐forming assay, respectively. (C,D) G2BC‐C2 cells were incubated with HCVcc at an moi of 1 for 4 hours and then cultured in fresh medium containing 10 µM JAK inhibitor I or AG490. DMSO was used as a vehicle control. The amounts of intracellular HCV RNA (C) and supernatant infectious particles (D) were measured by quantitative real‐time PCR and a focus‐forming assay, respectively. (E) Cells were incubated with HCVcc or mock‐infected, immunostained with an anti‐HCV core Ab (red), and counterstained with DAPI (blue). The mean fluorescent intensity of HCV core signal was evaluated using ImageJ software (right graph). Statistical significance was calculated by Student t test (P > 0.05). #Not detected. Abbreviations: FFU, focus‐forming unit; n.s., not significant.
Furthermore, we attempted to evaluate the permissibility for HBV infection in these cell lines. The amounts of intracellular HBV RNA and extracellular viral DNA produced in G2BC‐C2 cell cultures were similar to those produced in cultures of G2/NT18‐B (Fig. 6A,B) and G2BC‐D5 (Fig. 6A,B) cells. HBV‐positive cells were detected in G2/NT18‐B and G2BC‐C2 cell cultures (Fig. 6C). The amount of HBc was slightly lower in G2BC‐C2 cells than in G2/NT18‐B cells, while intracellular nucleocapsid–associated relaxed circular DNA was produced at higher levels in G2BC‐C2 cells than in G2/NT18‐B cells (Fig. 6D,E). Treatment with entecavir reduced the intracellular HBV‐DNA levels in G2BC‐C2 cells (Fig. 6E). These data suggest that the G2BC‐C2 cell line was permissive for HBV infection at a level similar to the G2/NT18‐B cell line. Thus, the G2BC‐C2 cell line was used for further study on the basis of its HCV permissiveness (Fig. 5).
Fig. 6.
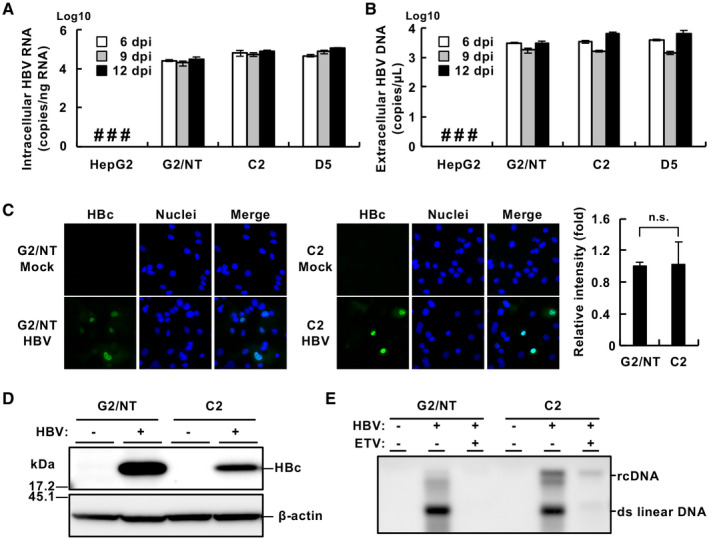
Infectivity of HBV in HepG2‐derived cell lines. Cells were infected with HBV (1,000 GEq/cell) according to the method described in the Supporting Materials and Methods. The resulting cells and culture supernatant were harvested at 6, 9, or 12 dpi. The amounts of intracellular HBV RNA (A) and extracellular HBV DNA (B) were measured by quantitative real‐time PCR or quantitative PCR. (C) Cells were fixed at 9 dpi, immunostained with an anti‐HBc Ab (green), and counterstained with DAPI (blue). The mean fluorescent intensity of HBc signal was evaluated using ImageJ software (right graph). Statistical significance was calculated by Student t test (P > 0.05). (D) The lysates of cells harvested at 9 dpi were subjected to western blot analysis. (E) Nucleocapsid‐associated HBV DNA prepared from cells harvested at 9 dpi was detected by southern blot analysis. The cells were incubated in the presence (+) or absence (‐) of 10 nM entecavir. #Not detected. Abbreviations: ETV, entecavir; n.s., not significant; rcDNA, relaxed circular DNA.
Effect of HCV Replication on the Expression of ISGs
Because HCV propagation was lower in G2BC‐C2 and D5 cells than in Huh7‐derived cells, and the treatment with JAK inhibitor I enhanced HCV replication in G2BC‐C2 cells (Fig. 5A‐D), we hypothesized that HCV infection induced IFN signaling in G2BC‐C2 and D5 cells at a higher level than in Huh7 cells. We therefore evaluated the ISG levels in HCV‐infected G2BC‐C2 cells. The expression of MxA, ISG12a, OAS1, IFIT3, ISG15, and IRF5 was induced in Huh7 cells through IFN‐α stimulation but not through HCV infection (Fig. 7A‐C and Supporting Fig. S6A‐C). In contrast, the levels of ISG mRNAs other than IRF5 mRNA were significantly up‐regulated in G2BC‐C2 and G2BC‐D5 cells by not only IFN‐α stimulation but also HCV infection (Fig. 7A‐C and Supporting Fig. S6A‐C). Furthermore, treatment with JAK inhibitor I significantly inhibited the induction of MxA, ISG12a, and OAS1 in HCV‐inoculated G2BC‐C2 cells (Fig. 7D‐F); however, the induction of IFIT3, ISG15, and IRF5 in HCV‐inoculated G2BC‐C2 cells was not inhibited by treatment with JAK inhibitor I (Supporting Fig. S6D‐F). Treatment with AG490 also suppressed ISG induction, but the effect was weaker than that of JAK inhibitor I. We evaluated the phosphorylation of STAT1 and STAT2 by western blotting. Treatment with JAK inhibitor I, but not AG490, reduced the phosphorylated STAT1 and total STAT1 levels in HCV‐infected G2BC‐C2 cells (Supporting Fig. S6G). These results were similar to those in IFN‐stimulated Huh7 cells reported by Yamauchi et al.( 23 ) The phosphorylation of STAT2 was induced in HCV‐infected cells, whereas the phosphorylated STAT2 level was not decreased by JAK inhibitor I or AG490 (Supporting Fig. S6G). Cell viability was not affected by treatment with 10 µM JAK inhibitor I or AG490 for 3 days (Supporting Fig. S6H,I). Determining whether the proviral effect of JAK inhibitor I on HCV replication is due to the inhibition of IFN stimulation alone is difficult. These data suggest that treatment with JAK inhibitor I can enhance HCV replication in an IFN‐dependent or IFN‐independent manner.
Fig. 7.
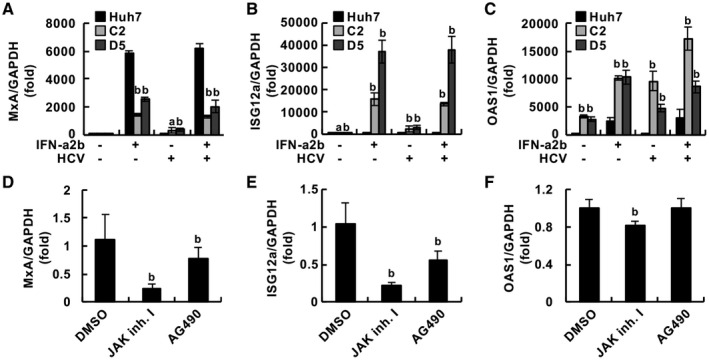
Innate immune response in cells infected with HCV. (A‐C) The indicated cells were infected with HCVcc at an moi of 1 or mock‐infected and then treated with 500 IU/mL IFN‐α2b or vehicle. The relative mRNA levels of MxA (A), ISG12a (B), and OAS1 (C) compared with the GAPDH mRNA level were measured by quantitative real‐time PCR. Each value was normalized to that of the control group (IFN‐α2b, ‐; HCV, ‐). Statistical significance was calculated by one‐way ANOVA followed by Dunnett’s post hoc test to compare the other groups with the control group (a, P < 0.05; b, P < 0.01). (D‐F) G2BC‐C2 cells were infected with HCVcc at an moi of 1 and then treated with or without 10 µM JAK inhibitor I or AG490. The relative mRNA levels of MxA (D), ISG12a (E), and OAS1 (F) compared with the GAPDH mRNA level were measured by quantitative real‐time PCR. Each value was normalized to that of the DMSO‐treated group. Statistical significance was calculated by one‐way ANOVA followed by Dunnett’s post hoc test to compare the other groups with the DMSO‐treated group (b, P < 0.01). Abbreviation: GAPDH, glyceraldehyde 3‐phosphate dehydrogenase.
Establishment of an HBV/HCV Coinfection Model Using a HepG2‐Derived Cell Line
Next, we tried to determine the conditions for coinfection. HBV‐infected G2/NT18‐B and G2BC‐C2 cell lines produced the highest amounts of extracellular HBV DNA at 6 to 9 dpi (Figs. 1C and 6B), whereas the amount of HCV RNA was increased by 72 hpi in the HCV‐infected G2BC‐C2 cells (Fig. 5C,D). Thus, G2BC‐C2 cells were incubated for 6 days after HBV infection, superinfected with HCV, and harvested at 3 days after HCV superinfection in the presence or absence of JAK inhibitor I. The amounts of intracellular HBV RNA and extracellular HBV DNA were time‐dependently increased in the HBV‐monoinfected and coinfected cells, whereas HBV RNA and DNA were not detected in mock‐infected or HCV‐monoinfected cells (Fig. 8A,B). The amounts of intracellular HCV RNA and extracellular infectious particles were time‐dependently increased in the HCV‐monoinfected and coinfected cells, whereas HCV RNA and infectious particles were not detected in the mock‐infected or HBV‐monoinfected cells (Fig. 8C,D). Treatment with JAK inhibitor I enhanced the propagation of HCV but not that of HBV in the coinfected cells (Fig. 8A‐D). The coinfected cells were subjected to immunostaining. HBV‐positive cells were detected in the HBV‐monoinfected and coinfected cell cultures, and HCV‐positive cells were similarly detected. Several HBV/HCV‐positive cells were detected in the coinfected cell cultures (Fig. 8E). Then, we attempted to determine the percentages of monoinfected and coinfected G2BC‐C2 cells by fluorescence microscopy. The results are shown in Supporting Figs. S7‐S9 and explained in the Supporting Information, indicating that HBV/HCV double‐positive cells accounted for about 30% of total cells and comprised the majority of HBV‐positive or HCV‐positive cells. Taken together, these data suggest that the G2BC‐C2 cell line can permit superinfection of not only HCV but also HBV in cases of coinfection and that HCV production suppresses HBV propagation under the condition of HBV superinfection and is promoted by HBV superinfection.
Fig. 8.
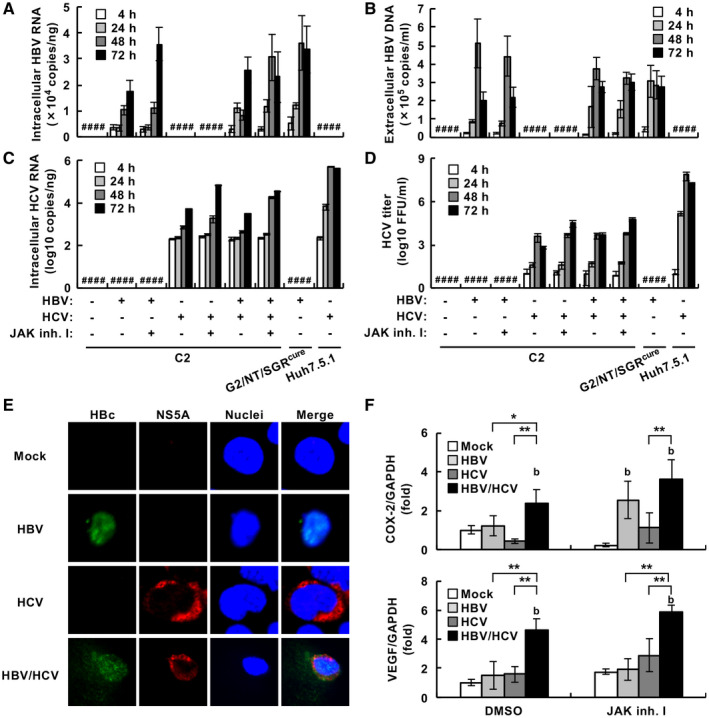
Evaluation of HBV and HCV propagation in HCV‐superinfected and HBV‐infected G2BC‐C2 cells. (A‐D,F) The indicated cells were infected with HBV at 1,000 GEq/cell. A DMEM‐based medium (condition 4 in Fig. 3) was used in these experiments. The HBV‐infected cells were further incubated with HCV at an moi of 1 for 4 hours, washed, and incubated in the presence or absence of 10 µM JAK inhibitor I. The resulting cells and supernatants were harvested at 4, 24, 48, or 72 hours after HCV inoculation. The amounts of intracellular HBV RNA (A), extracellular HBV DNA (B), and intracellular HCV RNA (C) were measured by quantitative real‐time PCR or quantitative PCR. (D) The amount of extracellular infectious HCV particles was measured by a focus‐forming assay. (E) Cells were infected with HBV at 10,000 GEq/cell, incubated for 6 days, and then infected with HCV at an moi of 1 in the presence of 10 µM JAK inhibitor I. The resulting cells were fixed on day 3 following infection with HCV and then stained with anti‐HBc (green) and anti‐NS5A (red) antibodies. All cells were counterstained with DAPI (blue). (F) The relative mRNA levels of COX‐2 (upper graph) and VEGF (lower graph) were measured by quantitative real‐time PCR. Statistical significance was calculated by Student t test (*P < 0.05; **P < 0.01) or one‐way ANOVA followed by Dunnett’s post hoc test to compare the values of other groups with that of the mock‐infected group (b, P < 0.01). #Not detected.
Effects of HBV/HCV Coinfection on Host Gene Expression in Relation to HCC
HBV and HCV infections have been shown to induce the expression of several host factors, such as cyclooxygenase‐2 (COX‐2), vascular endothelial growth factor (VEGF), inducible nitric oxide synthase, Wnt family member 1, fatty acid synthase, and sterol regulatory element binding protein‐1, which are implicated in carcinogenesis and lipogenesis.( 7 , 24 , 25 , 26 ) Thus, we investigated whether coinfection (HCV superinfection) could alter the expression of these genes in G2BC‐C2 cells. The expression of COX‐2 was up‐regulated by HBV infection under the treatment with JAK inhibitor, but not by HCV infection, regardless of the treatment (Fig. 8F, upper graph). Interestingly, VEGF expression was not affected by monoinfection by either virus, but HCV superinfection significantly up‐regulated the expression of VEGF and COX‐2 in the absence or presence of JAK inhibitor I (Fig. 8F, lower graph). In the HBV‐superinfection model using HCV‐infected G2BC‐C2 cells, COX‐2 was expressed at higher levels in the HBV‐superinfected G2BC‐C2 group than in each monoinfected group, whereas VEGF expression was not affected in the HCV‐infected group by HBV superinfection compared with each monoinfected group (Supporting Fig. S12E,F). HBV/HCV coinfection may potentiate the induction of some genes related to carcinogenesis, lipogenesis, and angiogenesis. Further studies will be required for clarification of the in vivo and in vitro effects of the coinfection on the host gene expressions.
Discussion
To explore the effect of HBV/HCV coinfection on viral propagation and pathogenicity, we developed HBV/HCV‐permissive cell lines that were derived from the conventional cell line HepG2 and then designated these new cell lines as the G2BC‐C2 and G2BC‐D5 cell lines. The G2BC‐C2 cell line exhibited a higher permissiveness for HCV infection than the G2BC‐D5 cell line. The G2BC‐C2 and G2BC‐D5 cell lines permitted HBV infection at a level similar to that in the parental cell line HepG2/NTCP18‐B. Furthermore, we determined an optimum culture condition for coinfection (Fig. 3 and Supporting Fig. S8). Both HBV and HCV propagated in G2BC‐C2 cells in a time‐dependent manner (Fig. 8A‐D). Intracellular HBV and HCV proteins were expressed in the same cell (Fig. 8E). HBV/HCV‐positive cells were shown to account for approximately 30% of the coinfected cells as determined by fluorescence‐activated cell sorting (FACS) analysis (Supporting Figs. S7 and S9). The G2BC‐C2 cell line may be better than the HLCZ01 cell line with regard to biological and virological issues, as the cell biology information of the parental cell line HepG2 is well established. Furthermore, PHHs were susceptible to HCV monoinfection, but not susceptible to HCV superinfection following HBV infection (Supporting Fig. S10). The coinfection system using the G2BC‐C2 cell line will be fully available for studies on the mechanism of HBV/HCV coinfection and the functions of related host factors.
Several reports suggest that HBV is a stealth virus that can escape immune recognition to avoid IFN‐dependent antiviral effects, whereas HCV potently induces innate immunity but evades this response by disrupting cellular immune signaling.( 27 ) In this study, Huh7 cells exhibited the induction of several ISGs in response to IFN stimulation but not to HCV infection (Fig. 7A‐C and Supporting Fig. S6A‐C), and HCV infection did not suppress IFN‐stimulated ISG expression in Huh7 cells (Fig. 7A‐C and Supporting Fig. S6A‐C). Several reports suggest that pattern recognition receptor (PRR)–dependent immune signaling is interrupted by the NS3/4A‐dependent cleavage of IPS‐1( 27 ) or inactivation of PKR by NS5A( 28 ) in Huh7 cells. However, HCV infection significantly induced ISG expression in G2BC‐C2 cells, G2BC‐D5 cells, and PHHs (Fig. 7A‐C and Supporting Figs. S6A‐C and S10C‐H), and JAK inhibitor I increased the propagation of HCV. The data in this study suggest that PRR activation is not completely inhibited by HCV infection in these cell lines.
Some clinical and in vivo studies have suggested that HBV replication is suppressed in HBV/HCV‐coinfected livers.( 4 , 29 , 30 ) However, HBV and HCV replication did not interfere with each other during HBV superinfection in cells with replicating HCV (Fig. 3) or in coinfected cells (Fig. 8A‐D). The data in this study are basically consistent with those of previous in vitro studies( 13 , 14 ) with regard to viral interference. However, the data in Supporting Fig. S8C‐F suggest that persistent HCV infection can be maintained in the absence of JAK inhibitor I and interfere with HBV propagation. HCV particle formation or other viral events that are lacking in replicon cells may affect HBV superinfection. Improvements in HCV and HBV infectivity may be needed to examine the vial interference that occurs between HCV and HBV. HCV entry has been shown to require many host factors, including CD81, SR‐BI, CLDN1, OCLN, epidermal growth factor receptor (EGFR), low‐density lipoprotein receptor, Niemann‐Pick C1‐like 1, and transferrin receptor 1.( 31 ) Some of these entry factors may not support much HCV entry into G2BC‐C2 and G2BC‐D5 cells, as our cell lines were less susceptible to HCVpp than the Huh7 cell line (Fig. 4). EGFR is associated with HCV and HBV entry,( 32 ) and HepG2 cells have been reported to express less EGFR than Huh7 cells.( 33 ) Additionally, HCV replicated less efficiently in HepG2‐derived cells than in Huh7‐derived cells (Fig. 2) despite that miR‐122 was expressed at similar levels in these cell lines (Figs. 2 and 3). The data deduced from quantitative proteomic profiling suggest that 37 proteins are differentially expressed between HepG2 and Huh7 cells.( 34 ) Some proteins, including creatine kinase B, vimentin and cathepsin B, may be associated with the low efficiency of HCV replication in G2BC‐C2 cells.
The data suggest that coinfection triggers additive or synergistic induction of COX‐2 and VEGF (Fig. 8F and Supporting Fig. S12E,F). The reason why VEGF was not up‐regulated by HBV superinfection in HCV‐infected cells is unknown. An unknown factor suppressive to VEGF induction may be induced under a condition of HBV superinfection following HCV infection, but not under a condition of HCV superinfection following HBV infection. Furthermore, the expression of COX‐2 or VEGF has been reported to be induced by HCV core, HCV NS3, HCV NS5A,( 7 , 26 ) or HBV hepatitis B x protein (HBx).( 24 ) The HBx‐potentiated expression of COX‐2 may promote the growth of HepG2 cells.( 35 ) Several reports suggest that these host proteins contribute to the development and progression of HCC and angiogenesis.( 36 , 37 , 38 ) Chen et al. reported that the HCV core interacted with HBx and HBV polymerase.( 39 ) Interactions among viral proteins may affect the induction of host genes related to viral pathogenesis in our culture system and be associated with the high risks of carcinogenesis and cancer progression in HBV/HCV‐coinfected patients. Actually, our clinical study indicated the possibility that HBV/HCV coinfection highly induced these host genes, although we analyzed only a limited number of liver specimens (Supporting Fig. S13). Our coinfection model may make it possible to investigate the mechanism of how HBV/HCV coinfection alters host gene expression.
Some reports suggest that PHHs are susceptible to both HBV and HCV infection, whereas the data reported by Ploss et al. suggest that they are susceptible to HCV infection at a relatively low level.( 40 ) The HLCZ01 cell line has been reported to be permissive for HBV/HCV coinfection,( 13 ) but its biological features have not yet been characterized in detail. The HepG2 cell line has been well characterized in a wide range of research fields. Hence, our coinfection model will be useful for exploring the effect of HBV/HCV coinfection on individual viral life cycles and pathogenicity and will contribute to the development of antiviral agents targeting both viruses.
Supporting information
Supplementary Material
Acknowledgments
We thank Masako Furugori‐Mori for her secretarial work and Takaji Wakita, Francis Chisari, and Ralf Bartenschlager for providing the cell lines and plasmids.
Supported by the Takeda Science Foundation, Japan Agency for Medical Research and Development (19fk0210053j0001, 19fk0310102s0303, 19fk0310105s0103, 19fk0310119s0003, 20fk0210053h1202, 20fk0310102s0304, and 20fk0310105h0004), GSK Japan Research Foundation, and Japan Society for the Promotion of Science (19K07574).
Potential conflict of interest: Nothing to report.
References
Author names in bold designate shared co‐first authorship.
- 1. Ward JW, Hinman AR. What is needed to eliminate hepatitis B virus and hepatitis C virus as global health threats. Gastroenterology 2019;156:297‐310. [DOI] [PubMed] [Google Scholar]
- 2. Abdelaal R, Yanny B, El Kabany M. HBV/HCV coinfection in the era of HCV‐DAAs. Clin Liver Dis 2019;23:463‐472. [DOI] [PubMed] [Google Scholar]
- 3. Kawagishi N, Suda G, Onozawa M, Kimura M, Maehara O, Ohara M, et al. Comparing the risk of hepatitis B virus reactivation between direct‐acting antiviral therapies and interferon‐based therapies for hepatitis C. J Viral Hepat 2017;24:1098‐1106. [DOI] [PubMed] [Google Scholar]
- 4. Sagnelli E, Coppola N, Messina V, Di Caprio D, Marrocco C, Marotta A, et al. HBV superinfection in hepatitis C virus chronic carriers, viral interaction, and clinical course. Hepatology 2002;36:1285‐1291. [DOI] [PubMed] [Google Scholar]
- 5. Rodriguez‐Inigo E, Bartolome J, Ortiz‐Movilla N, Platero C, Lopez‐Alcorocho JM, Pardo M, et al. Hepatitis C virus (HCV) and hepatitis B virus (HBV) can coinfect the same hepatocyte in the liver of patients with chronic HCV and occult HBV infection. J Virol 2005;79:15578‐15581. [DOI] [PMC free article] [PubMed] [Google Scholar]
- 6. Zhong J, Gastaminza P, Cheng G, Kapadia S, Kato T, Burton DR, et al. Robust hepatitis C virus infection in vitro. Proc Natl Acad Sci U S A 2005;102:9294‐9299. [DOI] [PMC free article] [PubMed] [Google Scholar]
- 7. Otoguro T, Tanaka T, Kasai H, Yamashita A, Moriishi K. Inhibitory effect of presenilin inhibitor LY411575 on maturation of hepatitis C virus core protein, production of the viral particle and expression of host proteins involved in pathogenicity. Microbiol Immunol 2016;60:740‐753. [DOI] [PubMed] [Google Scholar]
- 8. Ni Y, Lempp FA, Mehrle S, Nkongolo S, Kaufman C, Falth M, et al. Hepatitis B and D viruses exploit sodium taurocholate co‐transporting polypeptide for species‐specific entry into hepatocytes. Gastroenterology 2014;146:1070‐1083. [DOI] [PubMed] [Google Scholar]
- 9. Yan H, Zhong G, Xu G, He W, Jing Z, Gao Z, et al. Sodium taurocholate cotransporting polypeptide is a functional receptor for human hepatitis B and D virus. Elife 2012;1:e00049. [DOI] [PMC free article] [PubMed] [Google Scholar]
- 10. Fukuhara T, Kambara H, Shiokawa M, Ono C, Katoh H, Morita E, et al. Expression of microRNA miR‐122 facilitates an efficient replication in nonhepatic cells upon infection with hepatitis C virus. J Virol 2012;86:7918‐7933. [DOI] [PMC free article] [PubMed] [Google Scholar]
- 11. Murayama A, Sugiyama N, Wakita T, Kato T. Completion of the entire hepatitis c virus life cycle in vero cells derived from monkey kidney. MBio 2016;7:e00273‐16. [DOI] [PMC free article] [PubMed] [Google Scholar]
- 12. Narbus CM, Israelow B, Sourisseau M, Michta ML, Hopcraft SE, Zeiner GM, et al. HepG2 cells expressing microRNA miR‐122 support the entire hepatitis C virus life cycle. J Virol 2011;85:12087‐12092. [DOI] [PMC free article] [PubMed] [Google Scholar]
- 13. Yang D, Zuo C, Wang X, Meng X, Xue B, Liu N, et al. Complete replication of hepatitis B virus and hepatitis C virus in a newly developed hepatoma cell line. Proc Natl Acad Sci U S A 2014;111:E1264‐E1273. [DOI] [PMC free article] [PubMed] [Google Scholar]
- 14. Bellecave P, Gouttenoire J, Gajer M, Brass V, Koutsoudakis G, Blum HE, et al. Hepatitis B and C virus coinfection: a novel model system reveals the absence of direct viral interference. Hepatology 2009;50:46‐55. [DOI] [PubMed] [Google Scholar]
- 15. Okamoto T, Nishimura Y, Ichimura T, Suzuki K, Miyamura T, Suzuki T, et al. Hepatitis C virus RNA replication is regulated by FKBP8 and Hsp90. EMBO J 2006;25:5015‐5025. [DOI] [PMC free article] [PubMed] [Google Scholar]
- 16. Okuyama‐Dobashi K, Kasai H, Tanaka T, Yamashita A, Yasumoto J, Chen W, et al. Hepatitis B virus efficiently infects non‐adherent hepatoma cells via human sodium taurocholate cotransporting polypeptide. Sci Rep 2015;5:17047. [DOI] [PMC free article] [PubMed] [Google Scholar]
- 17. Pietschmann T, Lohmann V, Kaul A, Krieger N, Rinck G, Rutter G, et al. Persistent and transient replication of full‐length hepatitis C virus genomes in cell culture. J Virol 2002;76:4008‐4021. [DOI] [PMC free article] [PubMed] [Google Scholar]
- 18. Date T, Kato T, Miyamoto M, Zhao Z, Yasui K, Mizokami M, et al. Genotype 2a hepatitis C virus subgenomic replicon can replicate in HepG2 and IMY‐N9 cells. J Biol Chem 2004;279:22371‐22376. [DOI] [PubMed] [Google Scholar]
- 19. Tanaka T, Otoguro T, Yamashita A, Kasai H, Fukuhara T, Matsuura Y, et al. Roles of the 5' untranslated region of non‐primate hepacivirus in translation initiation and viral replication. J Virol 2018;92:e01997‐17. [DOI] [PMC free article] [PubMed] [Google Scholar]
- 20. Iwamoto M, Watashi K, Tsukuda S, Aly HH, Fukasawa M, Fujimoto A, et al. Evaluation and identification of hepatitis B virus entry inhibitors using HepG2 cells overexpressing a membrane transporter NTCP. Biochem Biophys Res Commun 2014;443:808‐813. [DOI] [PubMed] [Google Scholar]
- 21. Bartosch B, Dubuisson J, Cosset FL. Infectious hepatitis C virus pseudo‐particles containing functional E1–E2 envelope protein complexes. J Exp Med 2003;197:633‐642. [DOI] [PMC free article] [PubMed] [Google Scholar]
- 22. Metz P, Reuter A, Bender S, Bartenschlager R. Interferon‐stimulated genes and their role in controlling hepatitis C virus. J Hepatol 2013;59:1331‐1341. [DOI] [PubMed] [Google Scholar]
- 23. Yamauchi S, Takeuchi K, Chihara K, Honjoh C, Kato Y, Yoshiki H, et al. STAT1 is essential for the inhibition of hepatitis C virus replication by interferon‐lambda but not by interferon‐alpha. Sci Rep 2016;6:38336. [DOI] [PMC free article] [PubMed] [Google Scholar]
- 24. Kew MC. Hepatitis B virus x protein in the pathogenesis of hepatitis B virus‐induced hepatocellular carcinoma. J Gastroenterol Hepatol 2011;26(Suppl. 1):144‐152. [DOI] [PubMed] [Google Scholar]
- 25. Wu Q, Qiao L, Yang J, Zhou Y, Liu Q. Stronger activation of SREBP‐1a by nucleus‐localized HBx. Biochem Biophys Res Commun 2015;460:561‐565. [DOI] [PubMed] [Google Scholar]
- 26. Mahmoudvand S, Shokri S, Taherkhani R, Farshadpour F. Hepatitis C virus core protein modulates several signaling pathways involved in hepatocellular carcinoma. World J Gastroenterol 2019;25:42‐58. [DOI] [PMC free article] [PubMed] [Google Scholar]
- 27. Wieland SF, Chisari FV. Stealth and cunning: hepatitis B and hepatitis C viruses. J Virol 2005;79:9369‐9380. [DOI] [PMC free article] [PubMed] [Google Scholar]
- 28. Pflugheber J, Fredericksen B, Sumpter R Jr, Wang C, Ware F, Sodora DL, et al. Regulation of PKR and IRF‐1 during hepatitis C virus RNA replication. Proc Natl Acad Sci U S A 2002;99:4650‐4655. [DOI] [PMC free article] [PubMed] [Google Scholar]
- 29. Wieland SF, Asabe S, Engle RE, Purcell RH, Chisari FV. Limited hepatitis B virus replication space in the chronically hepatitis C virus‐infected liver. J Virol 2014;88:5184‐5188. [DOI] [PMC free article] [PubMed] [Google Scholar]
- 30. Liaw YF, Chen YC, Sheen IS, Chien RN, Yeh CT, Chu CM. Impact of acute hepatitis C virus superinfection in patients with chronic hepatitis B virus infection. Gastroenterology 2004;126:1024‐1029. [DOI] [PubMed] [Google Scholar]
- 31. Miao Z, Xie Z, Miao J, Ran J, Feng Y, Xia X. Regulated entry of hepatitis C virus into hepatocytes. Viruses 2017;9:100. [DOI] [PMC free article] [PubMed] [Google Scholar]
- 32. Iwamoto M, Saso W, Sugiyama R, Ishii K, Ohki M, Nagamori S, et al. Epidermal growth factor receptor is a host‐entry cofactor triggering hepatitis B virus internalization. Proc Natl Acad Sci U S A 2019;116:8487‐8492. [DOI] [PMC free article] [PubMed] [Google Scholar]
- 33. Itabashi H, Maesawa C, Oikawa H, Kotani K, Sakurai E, Kato K, et al. Angiotensin II and epidermal growth factor receptor cross‐talk mediated by a disintegrin and metalloprotease accelerates tumor cell proliferation of hepatocellular carcinoma cell lines. Hepatol Res 2008;38:601‐613. [DOI] [PubMed] [Google Scholar]
- 34. Ye F, Xin Z, Han W, Fan J, Yin B, Wu S, et al. Quantitative proteomics analysis of the hepatitis C virus replicon high‐permissive and low‐permissive cell lines. PLoS One 2015;10:e0142082. [DOI] [PMC free article] [PubMed] [Google Scholar]
- 35. Zheng BY, Fang XF, Zou LY, Huang YH, Chen ZX, Li D, et al. The co‐localization of HBx and COXIII upregulates COX‐2 promoting HepG2 cell growth. Int J Oncol 2014;45:1143‐1150. [DOI] [PubMed] [Google Scholar]
- 36. Castello G, Costantini S, Scala S. Targeting the inflammation in HCV‐associated hepatocellular carcinoma: a role in the prevention and treatment. J Transl Med 2010;8:109. [DOI] [PMC free article] [PubMed] [Google Scholar]
- 37. Mao CS, Yin H, Ning HB, Peng Z, Li K, Ding GQ. Levels of HBx, VEGF, and CEACAM1 in HBV‐related hepatocellular carcinoma and their correlation with cancer prognosis. Eur Rev Med Pharmacol Sci 2017;21:3827‐3833. [PubMed] [Google Scholar]
- 38. Kasprzak A, Adamek A. Role of hepatitis C virus proteins (C, NS3, NS5A) in hepatic oncogenesis. Hepatol Res 2008;38:1‐26. [DOI] [PubMed] [Google Scholar]
- 39. Chen SY, Kao CF, Chen CM, Shih CM, Hsu MJ, Chao CH, et al. Mechanisms for inhibition of hepatitis B virus gene expression and replication by hepatitis C virus core protein. J Biol Chem 2003;278:591‐607. [DOI] [PubMed] [Google Scholar]
- 40. Ploss A, Khetani SR, Jones CT, Syder AJ, Trehan K, Gaysinskaya VA, et al. Persistent hepatitis C virus infection in microscale primary human hepatocyte cultures. Proc Natl Acad Sci U S A 2010;107:3141‐3145. [DOI] [PMC free article] [PubMed] [Google Scholar]
Associated Data
This section collects any data citations, data availability statements, or supplementary materials included in this article.
Supplementary Materials
Supplementary Material