PLOS ONE logoLink to PLOS ONE
. 2021 Apr 9;16(4):e0249944. doi: 10.1371/journal.pone.0249944

Comprehensive profiling of the gut microbiota in patients with chronic obstructive pulmonary disease of varying severity

Yu-Chi Chiu 1,2,#, Shih-Wei Lee 1,#, Chi-Wei Liu 1, Rebecca Chou-Jui Lin 1, Yung-Chia Huang 1, Tzuo-Yun Lan 2,*, Lawrence Shih-Hsin Wu 3,*
Editor: Aran Singanayagam4
PMCID: PMC8034725  PMID: 33836012

Abstract

Chronic obstructive pulmonary disease (COPD) is a chronic respiratory disease that reduces lung and respiratory function, with a high mortality rate. Severe and acute deterioration of COPD can easily lead to respiratory failure, resulting in personal, social, and medical burden. Recent studies have shown a high correlation between the gut microbiota and lung inflammation. In this study, we investigated the relationship between gut microbiota and COPD severity. A total of 60 COPD patients with varying severity according to GOLD guidelines were enrolled in this study. DNA was extracted from patients’ stool and 16S rRNA data analysis conducted using high-throughput sequencing followed by bioinformatics analysis. The richness of the gut microbiota was not associated with COPD severity. The gut microbiome is more similar in stage 1 and 2 COPD than stage 3+4 COPD. Fusobacterium and Aerococcus were more abundant in stage 3+4 COPD. Ruminococcaceae NK4A214 group and Lachnoclostridium were less abundant in stage 2–4, and Tyzzerella 4 and Dialister were less abundant in stage 1. However, the abundance of a Bacteroides was associated with blood eosinophils and lung function. This study suggests that no distinctive gut microbiota pattern is associated with the severity of COPD. The gut microbiome could affect COPD by gut inflammation shaping the host immune system.

Introduction

Chronic obstructive pulmonary disease (COPD) is an inflammatory lung disease and characterized by progressive obstruction of airflow, resulting in symptoms such as shortness of breath, cough and increased sputum [1]. Exacerbation of COPD often results in high mortality and morbidity, rapid decline in lung function, and increased health care expense [2]. Though cigarette smoking is associated with COPD, not all smokers develop the disease [2]. Furthermore, even though COPD can lead to exacerbations, not all patients are susceptible to the symptoms. Therefore, COPD is a heterogeneous disease that may be affected by many factors that are not fully understood.

The pathogenesis of COPD is thought to involve inflammatory mediators and bacterial or viral infections [3]. Especially, systemic inflammation [4] and airway inflammation [5] are often associated with exacerbation. Traditional culturing techniques have found evidence of bacterial and viral colonization in the airways of COPD patients with exacerbations [6, 7]. These pathogens persist in the respiratory tract, creating a diverse environment in the airways and lungs. Though their presence in relation to exacerbations is not clearly defined, it has been assumed that any pathogen exposure may induce surfactant abnormalities, hinder mucociliary clearance, and increase the patient’s susceptibility to chronic inflammation, worsening respiratory symptoms and accelerating disease progression.

This gut dysbiosis in humans is related to inflammation of the gastrointestinal tract itself, but also in the airways, such as in asthma and COPD [8, 9]. Accumulating evidence has highlighted the influence of the gut microbiota on lung immunity, referred to as the gut–lung axis, though the underlying pathways and mechanisms are still areas of intensive research [10]. Recently, faecal microbiome of COPD patients and healthy controls were investigated and found several species with different distribution between two groups, including members of Streptococcus and the family Lachnospiraceae, also correlate with reduced lung function [11]. Despite the close association of gut microbiota with inflammation and many lung diseases, the association between the differences in gut microbiota profiles and the severity of COPD disease is still unknown.

Several studies have found significant differences in the distribution of respiratory microbiota between healthy individuals and COPD patients, and between different levels of COPD severity [12]. There are growing interest in the effect of probiotics on lung disorders, such as asthma and COPD [13], which should indicate whether the gut microbiome is associated with COPD exacerbation or severity. In light of the above information, we investigated the relationship between gut microbiota and COPD severity.

Materials and methods

Subjects

A total of 60 COPD patients (> 20 years old) with varying severity according to GOLD guidelines [14] were enrolled in this study. DNA was extracted from patients’ stool. Patients with cancer or other immune-related diseases and viral infections (e.g., Hepatitis B, Hepatitis C, HIV, etc.) were excluded from this study.

The stool samples were obtained from patients with moderate COPD and patients with severe COPD in stable condition (at least 3 months without exacerbation or use of antibiotics for any other reason). Diagnosis and classification of COPD was established according to GOLD recommendations [14]. The patient groups were defined as A (stage 1), B (stage 2), and C (stage 3+4) according to the classification of airflow limitation in the severity of COPD [14]. DNA was extracted from the stool samples using Qiagen QIAamp DNA Stool Mini Kit (Qiagne, Hilden, Germany) and subjected to next-generation sequencing (NGS). DNA quality was verified before and after rRNA depletion treatment by the Agilent 2100 Bioanalyzer. The DNA samples were also treated with RNase. All DNA processing were performed under aseptic conditions.

The study protocol conformed to the ethical guidelines of the 1975 Declaration of Helsinki and was approved by the Ethics Committee of Taoyuan General Hospital, Taoyuan, Taiwan (reference number: TYGH106037). Written informed consent was obtained from each patient enrolled in the study.

MetaVx library preparation and illumina MiSeq sequencing

NGS library preparations and Illumina MiSeq sequencing were performed at GENEWIZ, Inc. (Suzhou, China). DNA samples were quantified using a Qubit 2.0 Fluorometer (Invitrogen, Carlsbad, CA, USA). A total of 30–50 ng of DNA was used to generate amplicons using a MetaVx Library Preparation kit (GENEWIZ, Inc., South Plainfield, NJ, USA).

V3 and V4 hypervariable regions of prokaryotic 16S rDNA were selected to generate amplicons and subsequent taxonomy analysis. GENEWIZ designed a panel of proprietary primers aimed at relatively conserved regions bordering the V3 and V4 hypervariable regions of bacteria and Archaea16S rDNA. The V3 and V4 regions were amplified using forward primers containing the sequence CCTACGGRRBGCASCAGKVRVGAAT and reverse primers containing the sequence GGACTACNVGGGTWTCTAATCC. First-round PCR products were used as templates for second-round amplicon enrichment PCR. At the same time, indexed adapters were added to the ends of the 16S rDNA amplicons to generate indexed libraries ready for downstream NGS on Illumina Miseq.

The DNA libraries were validated by an Agilent 2100 Bioanalyzer (Agilent Technologies, Palo Alto, CA, USA) and quantified using a Qubit 2.0 Fluorometer. DNA libraries were multiplexed and loaded on an Illumina MiSeq instrument according to the manufacturer’s instructions (Illumina, San Diego, CA, USA). Sequencing was performed using a 2 x 300 paired-end (PE) configuration; image analysis and base calling were conducted by the MiSeq Control Software (MCS) embedded in the MiSeq instrument.

Data analysis

The QIIME data analysis package was used for 16S rRNA data analysis. The forward and reverse reads were joined and assigned to samples based on barcode, and truncated by cutting off the barcode and primer sequence. Quality filtering of joined sequences was performed and sequences that did not fulfil the following criteria were discarded: sequence length < 200 bp, no ambiguous bases, mean quality score ≥ 20. The sequences were then compared to the reference database (RDP Gold database) using the UCHIME algorithm (https://drive5.com/uchime/uchime_download.html) to detect chimeric sequences, and the chimeric sequences removed. The effective sequences were used in the final analysis. Sequences were grouped into operational taxonomic units (OTUs) using the clustering program VSEARCH (1.9.6) [15] against the Silva 119 database pre-clustered at 97% sequence identity. The Ribosomal Database Program (RDP) classifier was used to assign a taxonomic category to all OTUs at a confidence threshold of 0.8. The RDP classifier uses the Silva 132 database, which has taxonomic categories predicted to the species level. Sequences were rarefied prior to calculation of alpha and beta diversity statistics. Alpha diversity indexes were calculated in QIIME (version 1.9.1) [16] from rarefied samples using the Shannon index for diversity and the Chao1 index for richness. For beta diversity analysis, Principal Component Analysis (PCA) was performed and plotted based on Brary-Curtis distance matrix by R version 3.1.1 (https://cran.r-project.org/bin/windows/base/old/3.1.1/). The pheatmap package (https://cran.r-project.org/src/contrib/Archive/pheatmap/) was used for ecological analysis and heatmaps. By using metastats, differential analysis of taxonomic composition at genus level between groups can be performed based on the differential abundance between different groups. Differences in the abundance of microbial communities in two groups can be evaluated using strict statistical methods. The multiple hypothesis test was performed and false discovery rate (FDR) of the rare frequency data determined to evaluate the significance of the observed difference. The FDR-adjusted p-values were calculated using the Benjamini-Hochberg procedure.

Correlation analysis used statistical models to study the correlation between random variables and investigates whether a dependency exits between the phenomena and the nature and level of association. Spearman correlation coefficient was determined using R version 3.1.1 based on the OTU abundance and clinical features (blood eosinophil percentage and lung function). P values were also obtained. Heatmaps were generated to illustrate the relationship between clinical features and OTUs.

Results

Demographic and clinical features of study subjects

We totally enrolled 60 male COPD patients and 20 patients diagnosed as stage 1, 20 patients as stage 2, and 20 patients as stage 3+4. The demographic and clinical features of enrolled patients were listed in Table 1. The patients in mild COPD group were elder than patients in moderate and severe COPD groups. Clinical features (with statistical significance), such as pulmonary function test, reflected the different among this three patients groups. The medication also had significant difference among the three study groups.

Table 1. The demographic and clinical characteristics of the study participants.

Variables Mild COPD Moderate COPD Severe COPD p value
Age (years)
Mean ± SD (range) 78 ± 11 (51–95) 72 ± 10 (51–91) 68 ± 8 (50–81) 0.008a
BH (m)
Mean ± SD 1.64 ± 0.07 1.66 ± 0.07 1.63 ± 0.07 0.630a
BW (Kg)
Mean ± SD 61.79 ± 9.75 63.86 ± 10.24 58.94 ± 8.88 0.277a
BMI
Mean ± SD 22.85 ± 3.51 23.35 ± 3.71 22.09 ± 3.40 0.535a
WBC (per ul)
Median (range) 6700 (4090–9060) 6470 (4620–13740) 9335 (2580–19590) 0.081b
Eosinophil (%)
Median (range) 2.10 (0.5–10.9) 1.75 (0–8.4) 1.60 (0–14.8) 0.354b
Eosinophil (per ul)
Median (range) 146 (29–701) 118 (0–597) 162 (0–881) 0.216b
IgE (kU/L)
Median (range) 53.45 (1.50–7758.30) 20.80 (1.5–436.30) 62.50 (6.80–2130.30) 0.296b
Smoking (n)
 Yes 15 17 18 0.432c
 No 5 3 2
CAT
Mean ± SD 6.60 ± 3.50 9.45 ± 6.92 14.25 ± 6.30 <0.001a
 Score < 10 (n) 17 12 6 0.002c
 Score≧10 (n) 3 8 14
mMRC
Mean ± SD 0.35 ± 0.59 1.05 ± 1.19 1.80 ± 1.06 <0.001a
 Score < 2 (n) 19 12 8 0.001c
 Score≧2 (n) 1 8 12
Pulmonary function test
Pre-bronchodilator
FVC (L)
 Mean ± SD 3.18 ± 0.61 2.88 ± 0.65 2.48 ± 0.54 0.002a
FVC (% predicted)
 Mean ± SD 115.65 ± 24.85 96.45 ± 17.70 84.80 ± 21.21 <0.001a
FEV1 (L)
 Mean ± SD 2.05 ± 0.48 1.52 ± 0.39 0.97 ± 0.24 <0.001a
FEV1 (% predicted)
 Mean ± SD 98.40 ± 20.23 65.95 ± 13.30 42.15 ± 11.38 <0.001a
FEV1/FVC ratio (%)
 Mean ± SD 64.80 ± 11.38 54.05 ± 13.18 40.10 ± 10.85 <0.001a
Post-bronchodilator
FVC ± SD (L)
 Mean ± SD 3.33 ± 0.51 3.03 ± 0.66 2.64 ± 0.64 0.003a
FVC (% predicted)
 Mean ± SD 120.75 ± 19.30 101.85 ± 18.23 90.05 ± 22.60 <0.001a
FEV1 (L)
 Mean ± SD 2.10 ± 0.43 1.63 ± 0.39 1.03 ± 0.27 <0.001a
FEV1 (% predicted)
 Mean ± SD 101.30 ± 18.41 71.20 ± 13.59 44.60 ± 12.48 <0.001a
FEV1/FVC ratio (%)
 Mean ± SD 63.15 ± 7.97 54.80 ± 11.44 40.10 ± 11.38 <0.001a
Medication
 LAMA (n) 10 3 0 0.005c
 LABA (n) 1 1 0
 LAMA+LABA (n) 4 7 8
 ICS+LABA (n) 3 3 1
 ICS+LAMA+LABA (n) 2 6 11

SD = standard deviation; COPD = chronic obstructive pulmonary disease; n = number of subjects; BH = body height; WB = body weight; BMI = body mass index; WBC = white blood cell; CAT = COPD Assessment Test; mMRC = Modified Medical Research Council; FVC = forced vital capacity; FEV1 = Forced expiratory volume in one second; LAMA = long-acting muscarinic antagonist; LABA = long-acting beta agonist; ICS = inhaled corticosteroid.

a: The statistical analysis was tested by One-way ANOVA.

b: The statistical analysis was tested by Kruskal-Wallis test.

c: The statistical analysis was tested by χ2-test.

The stool DNA samples were eluted in 200 μl AE buffer. The average of DNA concentration was 5.52 ng/μl (range 1.05–12.43 ng/μl).

OTUs

According to the results of the OTU cluster analysis, the common and unique OTUs of different samples/groups were analysed and showed in a Venn diagram (S1 Fig). The statistics for the OUTs sequence number in each sample are given in S1 Table (for data sharing).

Alpha and beta diversity analyses among three COPD groups

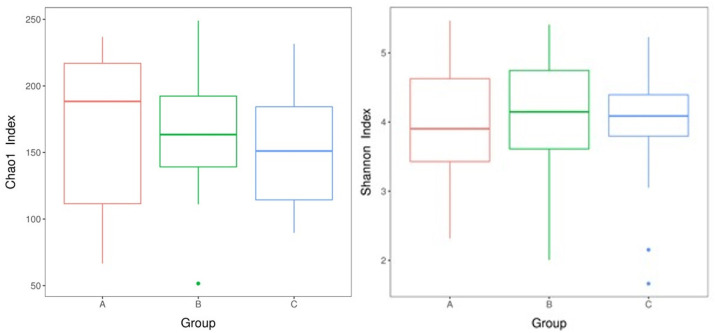
The Chao1 index and Shannon index were used to evaluate the alpha diversity of the microbiome in the three COPD groups. The results are given in Fig 1a and 1b. We did not find any significant difference in OTU richness and diversity among three groups. Using the PCA analysis and Brary-Curtis distance matrix for beta diversity analysis, we also found no significant different in comparison of bacterial communities among three COPD groups (Fig 1c).

Fig 1. The alpha and beta diversity analyses among three COPD groups.

Fig 1

a: Chao1 index boxplot of each group. The X-axis indicates the names of the groups and Y-axis the Chao 1 index. Each box diagram shows the minimum, first quartile, medium, third quartile, and maximum values of the Chao1 index of the corresponding sample; b: Shannon index boxplot of each group; c: PCA score plot. A: stage 1, B: stage 2, C: stage 3+4.

Taxonomic distribution among three COPD groups

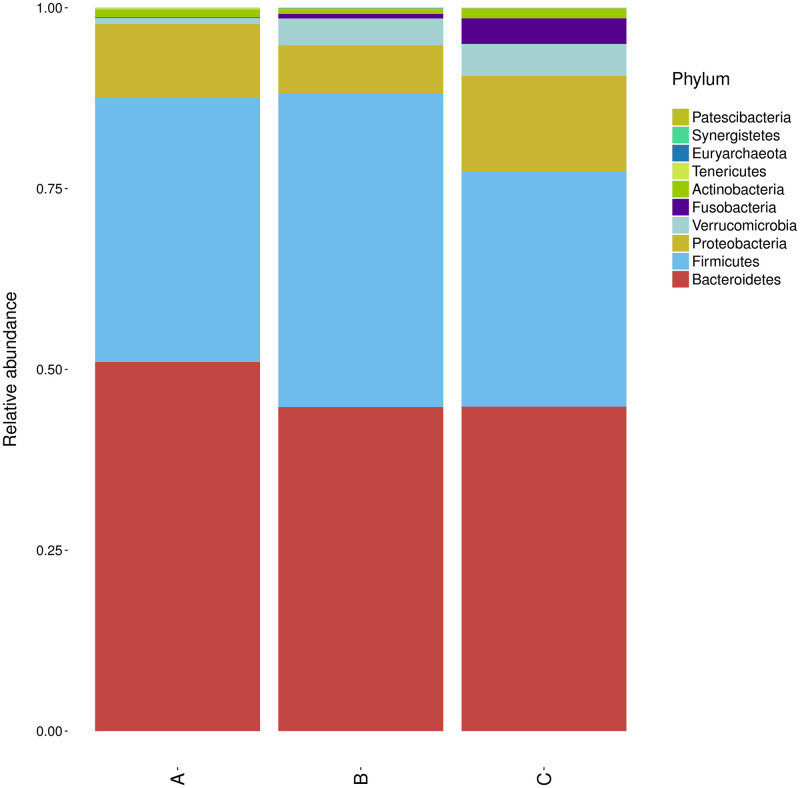
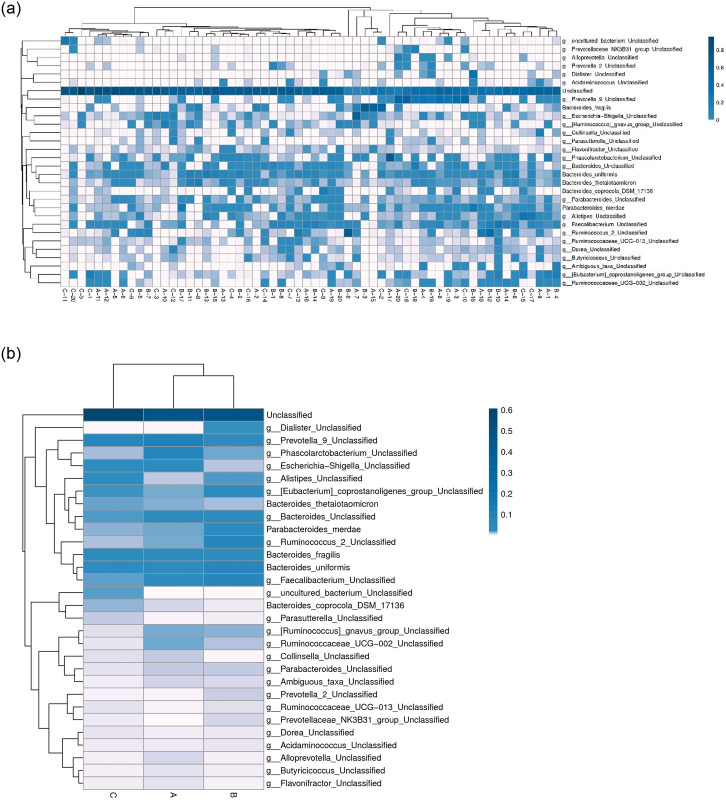
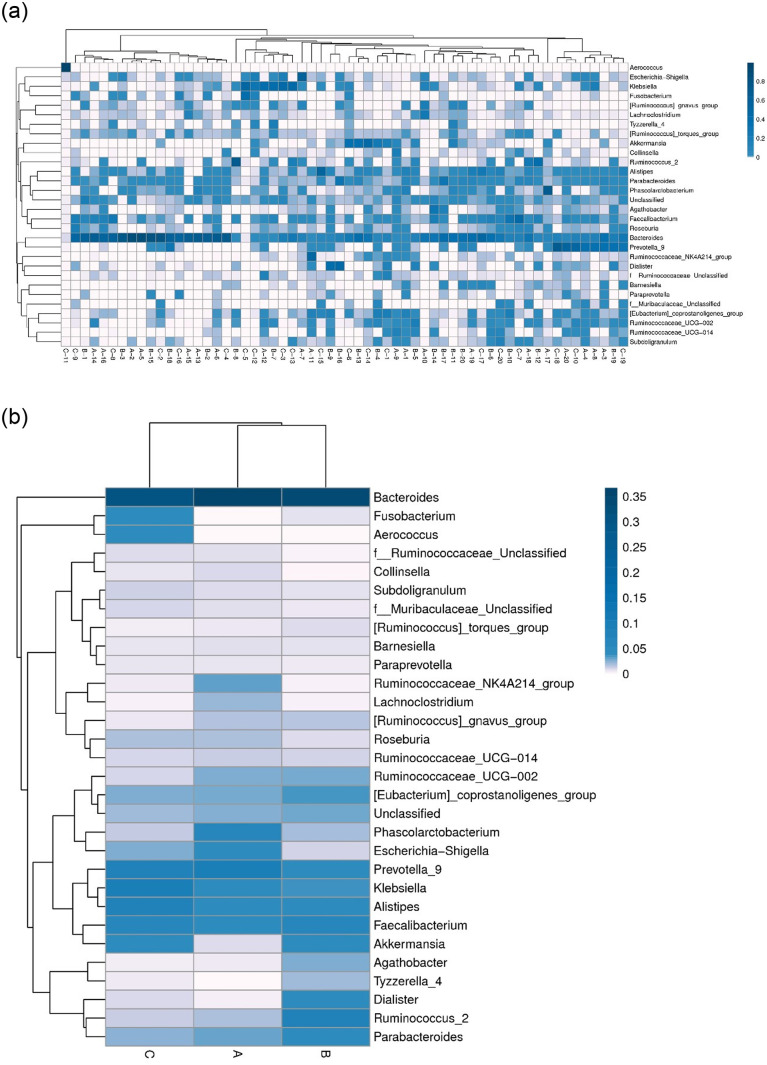
At phylum level, we observed the phylum abundance of each groups, and found Bacteroidetes was more abundant in grade 1 than grade 2–4 COPD (Fig 2). The top 30 abundant taxa in each sample or group were clustered and plotted in a heatmap at the species and genus level (Figs 3 and 4). The samples of three groups did not form a distinct cluster according to the cluster of sample analysis in species and genus level (Figs 3a and 4a). In the cluster of groups analysis based on euclidean distance, the top 30 species and genus in groups A and B were more similar than those in group C (Figs 3b and 4b). At genus level (Fig 4b), Fusobacterium and Aerococcus were more abundant in group C (stage 3 and 4). The Ruminococcaceae NK4A214 group and Lachnoclostridium were less abundant in group B/C (stage 2–4), and Tyzzerella 4 and Dialister were less abundant in group A (stage 1).

Fig 2. Phylum abundance of each groups.

Fig 2

A: stage 1, B: stage 2, C: stage 3+4.

Fig 3. The heatmap analysis of the top 30 species.

Fig 3

a: Cluster of samples. b: Cluster of groups. The columns represent samples and/or groups and the rows represent species. The dendrogram above the heatmap is the cluster result of the samples and/or groups and the dendrogram to the left is the species cluster. The colours in the heat map represent the relative abundance of the corresponding species in the corresponding sample or group.

Fig 4. The heatmap analysis of the top 30 genus.

Fig 4

a: Cluster of samples. b: Cluster of groups. The columns represent samples and/or groups and the rows represent genus. The dendrogram above the heatmap is the cluster result of the samples and/or groups and the dendrogram to the left is the genus cluster. The colours in the heat map represent the relative abundance of the corresponding genus in the corresponding sample or group.

Differential abundance

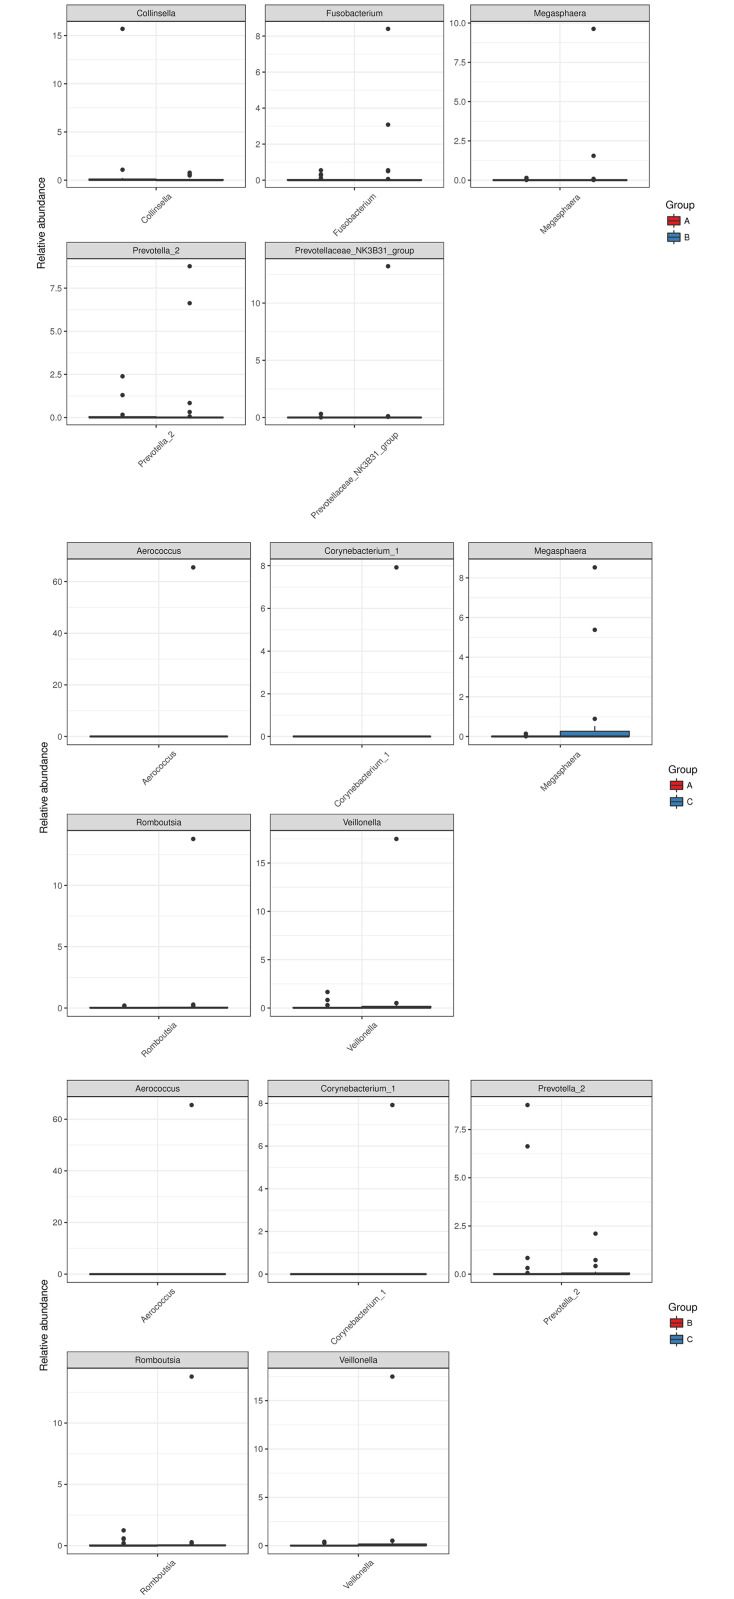
The differential analysis was carried out at the genus level. The abundance distribution of the five genera with the largest between-group difference is shown in Fig 5. The X-axis indicates the names of the five genera and the Y-axis the relative abundance of each. We found four genera, including Veillonella, Corynebacterium 1, Romboutsia, and Aerococcus, that are more abundant in group C than groups A and B. Megasphaera was found at lower abundance in group A than groups B and C. The statistical significance may due to few outliers.

Fig 5. Abundance distributions of the five genera with the largest between-group differences.

Fig 5

Top: group A vs. group B; middle: group A vs. group C; bottom: group B vs. group C.

OTU abundance correlated with blood eosinophil percentage and lung function

Correlation analysis revealed that some OTUs are associated with clinical features (Fig 6). OTU 19 (Bacteroides sp.) had a stronger negative correlation with eosinophil count (P < 0.001) and positively correlated with FEV1 and FVC (P < 0.05). The statistical results of correlation analysis were shown in S2 Table.

Fig 6. The heatmap analysis of Spearman correlation between OTUs and blood eosinophil percentage and pulmonary function.
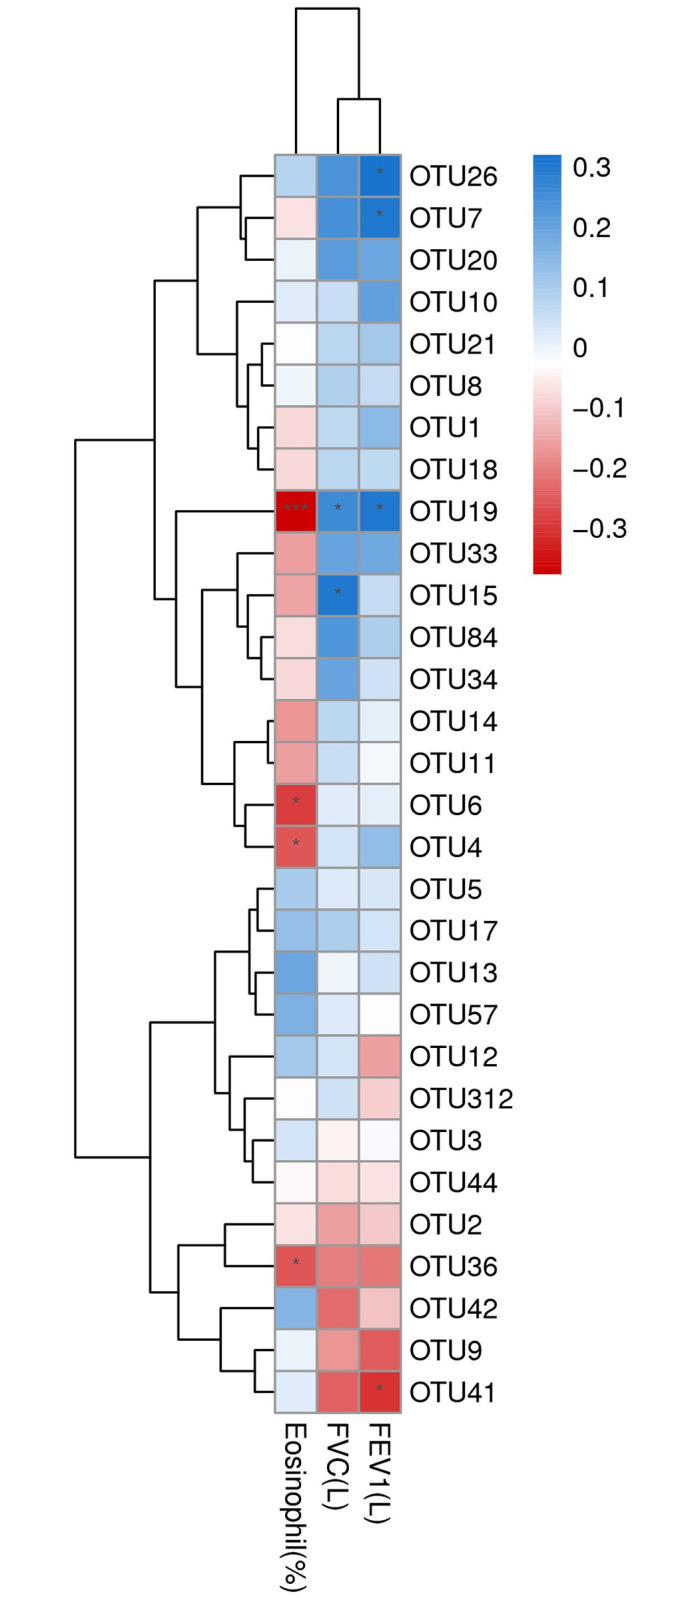
Fig 6

Spearman correlation coefficient (r) ranges between -1 and 1. r > 0 indicates positive correlation and r < 0 negative correlation. *p = 0.01–0.05, *** p<0.001. OTU 26: g__Ruminococcaceae_UCG-002, s__uncultured organism; OTU 7: g__Faecalibacterium, s__Ambiguous taxa; OTU 19: Bacteroides sp.; OTU 15: g__Bacteroides, s__unidentified; OTU 6: Bacteroides sp.; OTU 4: Parabacteroides_merdae; OTU 36: Bacteroides sp.; OTU 41: Fusobacterium sp. IDs of other non-significant OTUs are listed in S1 Table.

Discussion

COPD is becoming a leading cause of death and is increasingly prevalent worldwide [34]. The full spectrum of factors and mechanisms underlying the disease is still not completely understood. In this study, we investigated the gut microbiome in stool samples from 60 COPD patients with varying severity using 16S rRNA gene sequencing. In alpha and beta diversity analyses, we did not find significant differences in bacterial richness and communities among stool samples of three COPD groups. In stage 3+4 COPD, the more abundant genera were Fusobacterium and Aerococcus. The Ruminococcaceae NK4A214 group and Lachnoclostridium in stage 2–4 COPD and Tyzzerella 4 and Dialister in stage 1 COPD were less abundant. Using Spearman correlation analysis, the abundance of a Bacteroides was associated with eosinophil count and lung function.

The gut microbiome has not been characterized previously in COPD patients. However, gut bacterial dysbiosis has been reported in response to cigarette smoke in both humans and mice. In gut microbiota composition, current smokers have more abundant of Bacteroidetes and less abundant of Firmicutes and Proteobacteria than never smokers [17]. In addition, healthy smokers had increased Bacteroides–Prevotella compare to non-smokers [18]. Significant alterations in microbiota composition have been reported in healthy smokers, which reverse upon smoking cessation, with marked increases in both overall microbial diversity and in the phyla Firmicutes and Actinobacteria, and a reduced proportion of Bacteroidetes and Proteobacteria compared to continuing smokers and non-smokers [19]. In previous mouse study, colonic19 bacterial dysbiosis was induced by chronic (24 weeks) exposure to cigarette smoke, with increased Lachnospiraceae sp. [20]. In our study, Bacteroidetes was more abundant in grade 1 COPD than grade 2–4 COPD (Fig 2). From the observation of Fig 5, the present of the abundance distribution of the five generagenera with the largest between-group difference may due to few outlier(s). That may indicate two issue: (1) the result is suspicious due to random sampling effect; (2) the outlier(s) observed only one or two study groups (not random sampling effect) suppose the bacteria associated with COPD severity only in part (not all) patients. However, the distinct pattern of gut microbiota defined by one or few bacteria is not revealed in this study. Furthermore, the severe COPD patients were higher ratio with inhaled corticosteroid (ICS) treatment that may indicate the medication did not alter gut microbiota obviously.

The blood eosinophil count was reported to associate with the risk of COPD exacerbation, mortality, decreased FEV1, and response to corticosteroids [21]. The differential expression of the airway microbiome between eosinophilic and non-eosinophilic patients with COPD, during both stable disease [22] and acute disease exacerbation [23], suggest that dysregulation of this complex homoeostatic immunity is likely to feature in the pathogenesis of COPD. Bacterial counts for potentially pathogenic microorganisms negatively correlated with sputum eosinophil count, but not blood eosinophil count [24]. Our results indicate that the Bacteroides was associated with blood eosinophil percentage and lung function in COPD. This observation may indicate the different roles of gut and airway microbiomes in COPD via eosinophil inflammation. In previous mouse researches, the gut microbiome was essential to shaping the host immune system [25, 26]. The gut microbiome should influence the host immune system by modulating the blood eosinophil count, not directly affect COPD by pathogenic infection.

Our results shown that the more abundant genera in patients with severe COPD (stage 3+4) were Fusobacterium and Aerococcus. Fusobacterium nucleatum is abundant in patients suffering from chronic gut inflammation, contributing to the pathogenesis of colorectal cancer [27]. Aerococcus urinae and Aerococcus sanguinicola are associated with urinary tract infections [28] but are unknown in the pathogenesis of gastrointestinal disease. We also found that the Ruminococcaceae NK4A214 group and Lachnoclostridium were less abundant, and Tyzzerella 4 and Dialister more abundant in stage 2–4 COPD. Patients with non-alcoholic fatty liver disease (NAFLD) have lower abundance of Ruminococcaceae than those with non-NAFLD [29]. In patients with bipolar disorder, Ruminococcaceae is relatively decreased [30]. In children with autism spectrum disorders, the significant decrease in30 relative abundance of Lachnoclostridium, Tyzzerella subgroup 4, Flavonifractor, and unidentified Lachnospiraceae was found [31]. The low frequency of Dialister observed was reported31 in non-inflamed ileal and colonic biopsy tissue from patients with spondyloarthritis and healthy controls [32]. Based on the aforementioned studies, we suggest that the different abundance of gut microbiome associated with varying COPD severity and involved gut inflammation in this study.

Some methodological factors limit the interpretation and inferences drawn from this study. First, the sample size was relatively small and caused to the results under power, which might be responsible, at least in part, for our findings with statistical significant was suspicious due to random sampling effect. Thus, a future study to further increase the number of each grouped subjects will help solidify our finding. Second, the heathy (or non-COPD) control did not enrolled for this study because the criteria of control are hard to define. However, the aim of this study is to identify the gut microbiota associated with COPD severity, not COPD per se. Third, we did not evaluate the extraction blank and collect the information about obesity and stool consistency of COPD patients in this study. Recent studies indicated the influence of reagent and laboratory contamination on sequence-based microbiome analysis [33] and the close associations of obesity and stool consistency with changes in gut microbiota [3436]. The impact of these factors on microbiome analysis has been suggested, and it may affect the assay results.

Our results found no obviously relationship between gut microbiota and severity of COPD in humans. However, the association between blood eosinophils and gut microbiota in COPD patients was revealed in our study. Our results may provide useful information for developing new diagnostic or therapeutic methods to control COPD progression.

Supporting information

S1 Fig. OTU Venn diagram.

(DOCX)

S1 Table. The statistics for the OUTs sequence number in each sample.

(XLS)

S2 Table. Spearman correlation coefficient and p value of correlation analysis for OTUs and clinical features (blood eosinophil percentage and lung function).

(XLS)

Data Availability

All relevant data are within the manuscript and its Supporting information files.

Funding Statement

This work was supported by Taoyuan General Hospital, Ministry of Health and Welfare, Taoyuan, Taiwan (PTH10702). The funders had no role in study design, data collection and analysis, decision to publish, or preparation of the manuscript.

References

  • 1.Gold PM. The 2007 GOLD Guidelines: a comprehensive care framework. Respir care 2009; 54: 1040–1049. [PubMed] [Google Scholar]
  • 2.Wedzicha JA, Seemungal TAR. COPD exacerbations: defining their cause and prevention. Lancet 2007; 370: 786–796. 10.1016/S0140-6736(07)61382-8 [DOI] [PMC free article] [PubMed] [Google Scholar]
  • 3.Han MK, Huang YJ, Lipuma JJ, Boushey HA, Boucher RC, Cookson WO, et al. Significance of the microbiome in obstructive lung disease. Thorax 2012; 67: 456–463. 10.1136/thoraxjnl-2011-201183 [DOI] [PMC free article] [PubMed] [Google Scholar]
  • 4.Perera WR, Hurst JR, Wilkinson TMA, Sapsford RJ, Mullerova H, Donaldson GC, et al. Inflammatory changes, recovery and recurrence at COPD exacerbation. Eur Respir J. 2007; 29: 527–534. 10.1183/09031936.00092506 [DOI] [PubMed] [Google Scholar]
  • 5.Papi A, Bellettato CM, Braccioni F, Romagnoli M, Casolari P, Caramori G, et al. Infections and airway inflammation in chronic obstructive pulmonary disease severe exacerbations. Am J Resp Crit Care 2006; 173: 1114–1121. 10.1164/rccm.200506-859OC [DOI] [PubMed] [Google Scholar]
  • 6.Hirschmann JV. Do bacteria cause exacerbations of COPD? Chest 2000; 118; 193–203. 10.1378/chest.118.1.193 [DOI] [PubMed] [Google Scholar]
  • 7.Wedzicha JA. Role of viruses in exacerbations of chronic obstructive pulmonary disease. Proc Am Thorac Soc. 2004; 1: 115–120. 10.1513/pats.2306030 [DOI] [PubMed] [Google Scholar]
  • 8.Rapozo DC, Bernardazzi C, de Souza HS. Diet and microbiota in inflammatory bowel disease: the gut in disharmony. World J Gastroenterol. 2017; 23: 2124–2140. 10.3748/wjg.v23.i12.2124 [DOI] [PMC free article] [PubMed] [Google Scholar]
  • 9.Rutten EPA, Lenaerts K, Buurman WA, Wouters EFM. Disturbed intestinal integrity in patients with COPD: effects of activities of daily living. Chest 2014; 145: 245–252. 10.1378/chest.13-0584 [DOI] [PubMed] [Google Scholar]
  • 10.Marsland BJ, Trompette A, Gollwitzer ES. The gut–lung axis in respiratory disease. Ann Am Thorac Soc. 2015; Suppl 2: S150–S156. [DOI] [PubMed] [Google Scholar]
  • 11.Bowerman KL, Rehman SF, Vaughan A, Lachner N, Budden KF, Kim RY. Disease-associated gut microbiome and metabolome changes in patients with chronic obstructive pulmonary disease. Nat Commun. 2020; 11: 5886. 10.1038/s41467-020-19701-0 [DOI] [PMC free article] [PubMed] [Google Scholar]
  • 12.Mammen MJ, Sethi S. COPD and the microbiome. Respirology 2016; 21: 590–599 10.1111/resp.12732 [DOI] [PubMed] [Google Scholar]
  • 13.Anand S, Mande SS. Diet, Microbiota and Gut-Lung Connection. Front Microbiol. 2018; 9: 2147. 10.3389/fmicb.2018.02147 [DOI] [PMC free article] [PubMed] [Google Scholar]
  • 14.Global Initiative for Chronic Obstructive Lung Disease, Global strategy for diagnosis, management, and prevention of chronic obstructive pulmonary disease. GOLD, 2017.
  • 15.Rognes T, Mahé F, Flouri T, McDonald D, Schloss P, Woodcroft BJ. vsearch: VSEARCH 1.9.6 (Version v1.9.6). Zenodo, 2016. ( 10.5281/zenodo.44512). [DOI]
  • 16.Caporaso JG, Kuczynski J, Stombaugh J, Bittinger K, Bushman FD, Costello EK, et al. 2010. QIIME allows analysis of high-throughput community sequencing data. Nat Methods 2010; 7: 335–3366. 10.1038/nmeth.f.303 [DOI] [PMC free article] [PubMed] [Google Scholar]
  • 17.Lee SH, Yun Y, Kim SJ, Lee EJ, Chang Y, Ryu S, et al. Association between cigarette smoking status and composition of gut microbiota: population-based cross-sectional study. J Clin Med. 2018; 7: 282. 10.3390/jcm7090282 [DOI] [PMC free article] [PubMed] [Google Scholar]
  • 18.Benjamin JL, Hedin CR, Koutsoumpas A, Ng SC, McCarthy NE, Prescott NJ, et al. Smokers with active Crohn’s disease have a clinically relevant dysbiosis of the gastrointestinal microbiota. Inflamm Bowel Dis. 2012; 18: 1092–1100. 10.1002/ibd.21864 [DOI] [PubMed] [Google Scholar]
  • 19.Biedermann L, Zeitz J, Mwinyi J, Sutter-Minder E, Rehman A, Ott SJ, et al. Smoking cessation induces profound changes in the composition of the intestinal microbiota in humans. PLoS One 2013; 8: e59260. 10.1371/journal.pone.0059260 [DOI] [PMC free article] [PubMed] [Google Scholar]
  • 20.Allais L, Kerckhof FM, Verschuere S, Bracke KR, De Smet R, Laukens D, et al. Chronic cigarette smoke exposure induces microbial and inflammatory shifts and mucin changes in the murine gut. Environ Microbiol. 2016; 18: 1352–1363. 10.1111/1462-2920.12934 [DOI] [PubMed] [Google Scholar]
  • 21.Bafadhel M, Pavord ID, Russell REK. Eosinophils in COPD: just another biomarker? Lancet Respir Med. 2017; 5: 747–759. 10.1016/S2213-2600(17)30217-5 [DOI] [PubMed] [Google Scholar]
  • 22.Sze MA, Dimitriu PA, Suzuki M, McDonough JE, Campbell JD, Brothers JF, et al. Host response to the lung microbiome in chronic obstructive pulmonary disease. Am J Respir Crit Care Med. 2015; 192: 438–445. 10.1164/rccm.201502-0223OC [DOI] [PMC free article] [PubMed] [Google Scholar]
  • 23.Wang Z, Bafadhel M, Haldar K, Spivak A, Mayhew D, Miller BE, et al. Lung microbiome dynamics in COPD exacerbations. Eur Respir J. 2016; 47: 1082–1092. 10.1183/13993003.01406-2015 [DOI] [PubMed] [Google Scholar]
  • 24.Kolsum U, Donaldson GC, Singh R, Barker BL, Gupta V, George L, et al. Blood and sputum eosinophils in COPD; relationship with bacterial load. Respir Res. 2017; 18: 88. 10.1186/s12931-017-0570-5 [DOI] [PMC free article] [PubMed] [Google Scholar]
  • 25.Ivanov II, Atarashi K, Manel N, Brodie EL, Shima T, Karaoz U, et al. Induction of intestinal Th17 cells by segmented filamentous bacteria. Cell 2009; 139: 485–498. 10.1016/j.cell.2009.09.033 [DOI] [PMC free article] [PubMed] [Google Scholar]
  • 26.Ivanov II, de L Frutos R, Manel N, Yoshinaga K, Rifkin DB, Sartor RB, et al. Specific microbiota direct the differentiation of IL-17-producing T-helper cells in the mucosa of the small intestine. Cell Host Microbe 2008; 4: 337–349. 10.1016/j.chom.2008.09.009 [DOI] [PMC free article] [PubMed] [Google Scholar]
  • 27.Bashir A, Miskeen AY, Hazari YM, Asrafuzzaman S, Fazili KM. Fusobacterium nucleatum, inflammation, and immunity: the fire within human gut. Tumour Biol. 2016; 37: 2805–2810. 10.1007/s13277-015-4724-0 [DOI] [PubMed] [Google Scholar]
  • 28.Rasmussen M. Aerococcus an increasingly acknowledged human pathogen. Clin Microbiol Infect 2016; 22: 22–27. 10.1016/j.cmi.2015.09.026 [DOI] [PubMed] [Google Scholar]
  • 29.Iino C, Endo T, Mikami K, Hasegawa T, Kimura M, Sawada N, et al. Significant decrease in Faecalibacterium among gut microbiota in nonalcoholic fatty liver disease: a large BMI- and sex-matched population study. Hepatol Int. 2019; 13: 748–756. 10.1007/s12072-019-09987-8 [DOI] [PubMed] [Google Scholar]
  • 30.Nguyen TT, Hathaway H, Kosciolek T, Knight R, Jeste DV. Gut microbiome in serious mental illnesses: A systematic review and critical evaluation. Schizophr Res. 2019; S0920-9964(19)30382-2. 10.1016/j.schres.2019.08.026 [DOI] [PMC free article] [PubMed] [Google Scholar]
  • 31.Ma B, Liang J, Dai M, Wang J, Luo J, Zhang Z, et al. Altered Gut Microbiota in Chinese Children With Autism Spectrum Disorders. Front Cell Infect Microbiol. 2019; 9: 40. 10.3389/fcimb.2019.00040 [DOI] [PMC free article] [PubMed] [Google Scholar]
  • 32.Tito RY, Cypers H, Joossens M, Varkas G, Van Praet L, Glorieus E, et al. Brief Report: Dialister as a Microbial Marker of Disease Activity in Spondyloarthritis. Arthritis Rheumatol. 2017; 69: 114–121. 10.1002/art.39802 [DOI] [PubMed] [Google Scholar]
  • 33.Salter SJ, Cox MJ, Turek EM, Calus ST, Cookson WO, Moffatt MF, et al. Reagent and laboratory contamination can critically impact sequence-based microbiome analyses. BMC Biol. 2014; 12: 87. 10.1186/s12915-014-0087-z [DOI] [PMC free article] [PubMed] [Google Scholar]
  • 34.Gérard P. Gut microbiota and obesity. Cell Mol Life Sci. 2016; 73: 147–16262. 10.1007/s00018-015-2061-5 [DOI] [PMC free article] [PubMed] [Google Scholar]
  • 35.Vandeputte D, Falony G, Vieira-Silva S, Tito RY, Joossens M, Raes J. Stool consistency is strongly associated with gut microbiota richness and composition, enterotypes and bacterial growth rates. Gut 2016; 65: 57–62. 10.1136/gutjnl-2015-309618 [DOI] [PMC free article] [PubMed] [Google Scholar]
  • 36.Takagi T, Naito Y, Inoue R, Kashiwagi S, Uchiyama K, Mizushima K, et al. Differences in gut microbiota associated with age, sex, and stool consistency in healthy Japanese subjects. J Gastroenterol. 2019; 54: 53–63. 10.1007/s00535-018-1488-5 [DOI] [PubMed] [Google Scholar]

Decision Letter 0

Aran Singanayagam

4 Nov 2020

PONE-D-20-30223

Comprehensive profiling of the gut microbiota in patients with chronic obstructive pulmonary disease of varying severity

PLOS ONE

Dear Dr. Wu,

Thank you for submitting your manuscript to PLOS ONE. After careful consideration, we feel that it has merit but does not fully meet PLOS ONE’s publication criteria as it currently stands. Therefore, we invite you to submit a revised version of the manuscript that addresses the points raised during the review process.

Both reviewers saw value in your manuscript but raised concerns about methodological detail and data interpretation which should be addressed in your revision. As the study is relatively small, please ensure that conclusions are not over-stated.

Please submit your revised manuscript by Dec 12 2020 11:59PM. If you will need more time than this to complete your revisions, please reply to this message or contact the journal office at plosone@plos.org. When you're ready to submit your revision, log on to https://www.editorialmanager.com/pone/ and select the 'Submissions Needing Revision' folder to locate your manuscript file.

Please include the following items when submitting your revised manuscript:

  • A rebuttal letter that responds to each point raised by the academic editor and reviewer(s). You should upload this letter as a separate file labeled 'Response to Reviewers'.

  • A marked-up copy of your manuscript that highlights changes made to the original version. You should upload this as a separate file labeled 'Revised Manuscript with Track Changes'.

  • An unmarked version of your revised paper without tracked changes. You should upload this as a separate file labeled 'Manuscript'.

If you would like to make changes to your financial disclosure, please include your updated statement in your cover letter. Guidelines for resubmitting your figure files are available below the reviewer comments at the end of this letter.

If applicable, we recommend that you deposit your laboratory protocols in protocols.io to enhance the reproducibility of your results. Protocols.io assigns your protocol its own identifier (DOI) so that it can be cited independently in the future. For instructions see: http://journals.plos.org/plosone/s/submission-guidelines#loc-laboratory-protocols

We look forward to receiving your revised manuscript.

Kind regards,

Aran Singanayagam

Academic Editor

PLOS ONE

Journal Requirements:

When submitting your revision, we need you to address these additional requirements.

1. Please ensure that your manuscript meets PLOS ONE's style requirements, including those for file naming. The PLOS ONE style templates can be found at

https://journals.plos.org/plosone/s/file?id=wjVg/PLOSOne_formatting_sample_main_body.pdf and

https://journals.plos.org/plosone/s/file?id=ba62/PLOSOne_formatting_sample_title_authors_affiliations.pdf

2.We note that you are reporting an analysis of a microarray, next-generation sequencing, or deep sequencing data set. PLOS requires that authors comply with field-specific standards for preparation, recording, and deposition of data in repositories appropriate to their field. Please upload these data to a stable, public repository (such as ArrayExpress, Gene Expression Omnibus (GEO), DNA Data Bank of Japan (DDBJ), NCBI GenBank, NCBI Sequence Read Archive, or EMBL Nucleotide Sequence Database (ENA)). In your revised cover letter, please provide the relevant accession numbers that may be used to access these data. For a full list of recommended repositories, see http://journals.plos.org/plosone/s/data-availability#loc-omics or http://journals.plos.org/plosone/s/data-availability#loc-sequencing.

3.Thank you for stating the following in the Funding Section of your manuscript:

[This work was supported by Taoyuan General Hospital, Ministry of Health and

Welfare, Taoyuan, Taiwan (PTH10702).]

We note that you have provided funding information that is not currently declared in your Funding Statement. However, funding information should not appear in the Acknowledgments section or other areas of your manuscript. We will only publish funding information present in the Funding Statement section of the online submission form.

Please remove any funding-related text from the manuscript and let us know how you would like to update your Funding Statement. Currently, your Funding Statement reads as follows:

 [The funders had no role in study design, data collection and analysis, decision to publish, or preparation of the manuscript.]

Please include your amended statements within your cover letter; we will change the online submission form on your behalf.

4.Thank you for submitting the above manuscript to PLOS ONE. During our internal evaluation of the manuscript, we found significant text overlap between your submission and the following previously published works, some of which you are an author.

- https://journals.plos.org/plosone/article?id=10.1371%2Fjournal.pone.0159066

- https://onlinelibrary.wiley.com/doi/full/10.1038/cti.2017.6

- https://www.thelancet.com/journals/lanres/article/PIIS2213-2600(17)30217-5/fulltext

- https://www.sciencedirect.com/science/article/abs/pii/S0899900717301363?via%3Dihub

We would like to make you aware that copying extracts from previous publications, especially outside the methods section, word-for-word is unacceptable. In addition, the reproduction of text from published reports has implications for the copyright that may apply to the publications.

Please revise the manuscript to rephrase the duplicated text, cite your sources, and provide details as to how the current manuscript advances on previous work. Please note that further consideration is dependent on the submission of a manuscript that addresses these concerns about the overlap in text with published work.

We will carefully review your manuscript upon resubmission, so please ensure that your revision is thorough.

[Note: HTML markup is below. Please do not edit.]

Reviewers' comments:

Reviewer's Responses to Questions

Comments to the Author

1. Is the manuscript technically sound, and do the data support the conclusions?

The manuscript must describe a technically sound piece of scientific research with data that supports the conclusions. Experiments must have been conducted rigorously, with appropriate controls, replication, and sample sizes. The conclusions must be drawn appropriately based on the data presented.

Reviewer #1: Partly

Reviewer #2: Partly

**********

2. Has the statistical analysis been performed appropriately and rigorously?

Reviewer #1: Yes

Reviewer #2: No

**********

3. Have the authors made all data underlying the findings in their manuscript fully available?

The PLOS Data policy requires authors to make all data underlying the findings described in their manuscript fully available without restriction, with rare exception (please refer to the Data Availability Statement in the manuscript PDF file). The data should be provided as part of the manuscript or its supporting information, or deposited to a public repository. For example, in addition to summary statistics, the data points behind means, medians and variance measures should be available. If there are restrictions on publicly sharing data—e.g. participant privacy or use of data from a third party—those must be specified.

Reviewer #1: No

Reviewer #2: No

**********

4. Is the manuscript presented in an intelligible fashion and written in standard English?

PLOS ONE does not copyedit accepted manuscripts, so the language in submitted articles must be clear, correct, and unambiguous. Any typographical or grammatical errors should be corrected at revision, so please note any specific errors here.

Reviewer #1: Yes

Reviewer #2: Yes

**********

5. Review Comments to the Author

Please use the space provided to explain your answers to the questions above. You may also include additional comments for the author, including concerns about dual publication, research ethics, or publication ethics. (Please upload your review as an attachment if it exceeds 20,000 characters)

Reviewer #1: Wu and colleagues compare the composition of the gut microbiome across 60 patients with varying severity of COPD. Some thoughts:

1. I think the introduction would benefit from a line or two more making the case for examining the gut microbiome in patients with COPD. Although explained that SCFAs influence immune system and TMAO is associated with COPD mortality, these are a bit circumstantial – any other evidence to say why worth looking at this? Anything a bit more mechanistic? One potential idea – bile acids influence alveolar epithelial cells and lung fibroblasts: https://onlinelibrary.wiley.com/doi/full/10.1111/resp.12815 .

2. Materials and methods – overall OK, but there is a noticeable lack of referencing to basis of protocols used in this section. Which FDR correction method did you use? For the line ‘differential analysis of species composition…’, do you not mean ‘taxonomic’ rather than ‘species’, especially given that this is 16S data? Similarly - there is a mention made here of strain level analysis… it is very hard to believe that you were consistently able to analyse more than genus-level data confidently given that this is 16S data…? Have you got any references for the pipeline used if strain level analysis is being claimed? How did you compare taxonomic profiles between groups – R, STAMP, another method? A little detail on statistical testing is given, but this could be expanded. What code/ software did you use for your heatmaps?

3. Table 1 – you have said that you excluded patients using antibiotics within the past three months, but do you have any data on medication use here, as potentially of interest? e.g. antibiotic courses within the past year.

4. Figure 1 – text and figure do not make clear if only no signif difference in richness between groups, or also Shannon/ alpha diversity too? Perhaps update text and add bar to figure.

5. Figure 3 – along x axis, please put all A samples, then all B samples, then all C samples (as has been done for Figure 4 for genera) – very mixed up as it is and hard to interpret. I would remove unclassified, and try and clean up the labelling of the y axis (e.g. looks messy saying ‘g_Faecalibacterium_unclassified’ – suggest just change to ‘unclassified Faecalibacterium’).

6. Figure 5 – I don’t think any of these are actual strains, which does not surprise me; see my comment above. I am not sure this adds a huge amount, as is essentially more genus-level data.

7. Other clinical data – did you have enough follow-up to see what happened to these patients? Have you enough follow up data to try and correlate, e.g., number of future LRTIs since these samples taken with a particular taxonomic fingerprint?

8. Functional microbiome – your abstract mentions about the potential importance of SCFAs and TMA/TMAO to the gut-lung axis but doesn’t look at these at all in the analysis. While PLoS ONE is focused on technically sound work rather than novelty per se, this would substantially develop the paper. The ideal situation would be metabonomic analysis of stool, but appreciate this may not be feasible. What about using a bioinformatic tool to predict metagenomic content, e.g. Piphillin? Would be easy to do and could see if, e.g., predicted SCFA production was different between groups?

9. General – stated that study was approved by ethics committee of the hospital, but was there any other ethics panel review? Or a reference number? The raw microbiome data (e.g. .fastq files) should be available in the public domain (e.g. https://www.ebi.ac.uk/metagenomics/) unless the researchers have a very strong reason as to why this should not be the case.

Reviewer #2: General comments.

The authors have performed a 16S targeted amplicon sequencing analysis of gut microbiome composition in 60 patients stratified according to COPD disease severity. I was surprised to note that there are not yet any major studies conducted into this topic as the concept has been around for some time. I feel that greater numbers are required to fully establish a role for the gut microbiome in COPD. The study seems a little premature and somewhat rushed. Having said that, the authors are careful to acknowledge limitations and (for the most part) don’t make any overreaching conclusions.

Specific comments.

1. Please don’t use the term “strain” when referring to identified taxa. 16S does not provide credible strain-level resolution.

2. The authors state that participants had similar eating habits. The means by which this was established should be clarified or, if not specifically assessed ( e.g. food frequency questionnaire), the sentence should be removed.

3. The authors mention rRNA depletion in relation to sputum. I suspect the authors are thinking of another study here as neither sputum or transcriptomic analysis are presented in this manuscript.

4. The authors recruited 20 patients in each group for mild moderate and severe disease categories. I agree with the approach and it is good that they analyse the clinical parameters between groups but the sample size is too small for a gut microbiome study given significant inter-individual variability (c.f. PMID: 27126040, Zhernakova et al.). Nonetheless it could be informative if, perhaps, under powered.

5. “No significant difference in community richness.” Again, while it is challenging to assess power in microbiome studies, progress has been made and should be discussed (PMID: 27153704, Mattiello et al). The risk that type two error occurred here should be mentioned – remember the old adage; “no evidence of a difference is not evidence of no difference.” Base on obesity work one could speculate a difference should exist (obesity is a risk factor for COPD and the gut microbiome is altered in obese patients). I should say however, that a significant amount of variability in gut studies can be traced to stool consistency (i.e. Bristol stool chart, again see c.f. PMID: 27126040, Zhernakova et al.). This should be controlled for and leads to my obvious next question.

6. How was stool consistency assessed? If variable between severity groups it could represent a significant confounder. Was the Bristol stool chart used?

7. In relation to controls, blank extraction samples should be reported (both sequencing and extraction blanks). Although the authors report that DNA concentrations were quality controlled, and are likely to be microbe-rich given that these are stool samples, contamination is always a risk, especially when employing amplicon sequencing. Ideally, mock community analysis samples should also have been included.

7. “Group similarities at genus and species level”. In relation to the statement “In the cluster of sample analysis,group A and B were more similar than group C” - define what is meant by “more similar” in the text. What distance metric was employed.? I think A PCA analysis would work better here. Alternatively, if keeping the heat maps (3a 4a) colour could be used to indicate group membership of each patient.

8. Differential abundance. Did the authors use LEFSE or metastats? These are now standard methods. PERMANOVA could also be conducted. FDR anaysis is ok but won’t account for data sparsity. I commend the authors for their data availability (and the clarity of the data, which is easy to interpret and assess). However, I have performed Lefse analysis and this reveals no differences between groups A, B or C. I can reproduce the observation concerning Fusobacterium which does seem to be over represented in the severe group (group C).This does not completely invalidate the authors findings but serves to underscore that the sample size is small and different methods may give contrasting results based on the models employed. At least we can say there is some consistency as the Fusobacterium observation is reproduced. However, it is hard to know how reproducible or biologically important these findings are over all.

9. I don’t think species level analysis is advisable in the case of 16S analysis. I would cut at genus level as it is more reliable and gives a more realistic appraisal of the microbiome in my view.

10. Though the taxonomic data is accessible, the authors stop short of making the clinical metadata available. Without this I can’t reproduce the bacteriodes finding. I would recommend the authors implement Maaslin (https://huttenhower.sph.harvard.edu/maaslin/) to see if the observations regarding lung function and eosinophil counts hold up. If they do, this is potentially an interesting finding.

11. Final line of the discussion goes too far. “This should be useful information for developing new diagnostic or therapeutic markers to control COPD progression.” The findings must be validated in independent studies with larger patient numbers before we are anywhere near even considering diagnostics or therapeutics. This is a very preliminary glimpse of what MIGHT be going on in COPD that requires extensive additional validation work in future studies.

**********

6. PLOS authors have the option to publish the peer review history of their article (what does this mean?). If published, this will include your full peer review and any attached files.

If you choose “no”, your identity will remain anonymous but your review may still be made public.

Do you want your identity to be public for this peer review? For information about this choice, including consent withdrawal, please see our Privacy Policy.

Reviewer #1: No

Reviewer #2: No

[NOTE: If reviewer comments were submitted as an attachment file, they will be attached to this email and accessible via the submission site. Please log into your account, locate the manuscript record, and check for the action link "View Attachments". If this link does not appear, there are no attachment files.]

While revising your submission, please upload your figure files to the Preflight Analysis and Conversion Engine (PACE) digital diagnostic tool, https://pacev2.apexcovantage.com/. PACE helps ensure that figures meet PLOS requirements. To use PACE, you must first register as a user. Registration is free. Then, login and navigate to the UPLOAD tab, where you will find detailed instructions on how to use the tool. If you encounter any issues or have any questions when using PACE, please email PLOS at figures@plos.org. Please note that Supporting Information files do not need this step.

PLoS One. 2021 Apr 9;16(4):e0249944. doi: 10.1371/journal.pone.0249944.r002

Author response to Decision Letter 0


2 Jan 2021

Responses to Reviewer #1:

We thank you for giving us a positive review. Because of your and Reviewer 2’s comments, we modified the manuscript.

Comment 1: I think the introduction would benefit from a line or two more making the case for examining the gut microbiome in patients with COPD. Although explained that SCFAs influence immune system and TMAO is associated with COPD mortality, these are a bit circumstantial – any other evidence to say why worth looking at this? Anything a bit more mechanistic? One potential idea – bile acids influence alveolar epithelial cells and lung fibroblasts: https://onlinelibrary.wiley.com/doi/full/10.1111/resp.12815.

Reply 1: Thank you for your valuable comments. Previous study indicated SCFAs can bind to G-protein coupled receptor 43 (GPR43) and strongly affect inflammatory responses [1,2]. TMAO induced the expression of pro-inflammatory genes and the production of inflammatory cytokines by activating NF-kappa B pathway [3,4]. We think the SCFAs and TMAO may over-emphasize and confuse the main focus in this manuscript. We deleted the statement about SCFAs/TMAO in introduction section.

1. Brown AJ, Goldsworthy SM, Barnes AA, Eilert MM, Tcheang L, Daniels D, et al. The Orphan G protein-coupled receptors GPR41 and GPR43 are activated by propionate and other short chain carboxylic acids. J Biol Chem 2003; 278:11312-9

2. Morrison DJ, Preston T. Formation of short chain fatty acids by the gut microbiota and their impact on human metabolism. Gut Microbes 2016; 7: 189-200.

3. Seldin MM, Meng Y, Qi H, Zhu W, Wang Z, Hazen SL, et al. Trimethylamine N-Oxide Promotes Vascular Inflammation Through Signaling of Mitogen-Activated Protein Kinase and Nuclear Factor-κB. J Am Heart Assoc. 2016; 5: e002767.

4. Ma G, Pan B, Chen Y, Guo C, Zhao M, Zheng L, et al. Trimethylamine N-oxide in atherogenesis: impairing endothelial self-repair capacity and enhancing monocyte adhesion. Biosci Rep. 2017; 37: BSR20160244.

Comment 2: Materials and methods – overall OK, but there is a noticeable lack of referencing to basis of protocols used in this section. Which FDR correction method did you use? For the line ‘differential analysis of species composition…’, do you not mean ‘taxonomic’ rather than ‘species’, especially given that this is 16S data? Similarly - there is a mention made here of strain level analysis… it is very hard to believe that you were consistently able to analyse more than genus-level data confidently given that this is 16S data…? Have you got any references for the pipeline used if strain level analysis is being claimed? How did you compare taxonomic profiles between groups – R, STAMP, another method? A little detail on statistical testing is given, but this could be expanded. What code/ software did you use for your heatmaps?

Comment 2-1: Which FDR correction method did you use?

Reply 2-1: To correct for multiple testing, we calculated the 'false discovery rate' (FDR)-adjusted p-values using the Benjamini-Hochberg procedure. We add the statement in the Materials and Methods (page 7) as you suggested.

Comment 2-2: For the line ‘differential analysis of species composition…’, do you not mean ‘taxonomic’ rather than ‘species’, especially given that this is 16S data?

Reply 2-2: Thank you for your valuable comments. We modified the text in the Materials and Methods (page 7) as you suggested.

Comment 2-3: Similarly - there is a mention made here of strain level analysis… it is very hard to believe that you were consistently able to analyse more than genus-level data confidently given that this is 16S data…?

Reply 2-3: We modified the text in the manuscript (page 2, 7, 10, 11, and 12) as you suggested

Comment 2-4: Have you got any references for the pipeline used if strain level analysis is being claimed?

Reply 2-4:

Thank you for comments, we has added some references for analysis methods:

1. The sequences were then compared to the reference database (RDP Gold database) using the UCHIME algorithm (https://drive5.com/uchime/uchime_download.html)

2. VSEARCH (1.9.6): Torbjørn Rognes, ., Frédéric Mahé, ., Tomas Flouri, ., Daniel McDonald, ., Pat Schloss, ., & Ben J Woodcroft, . (2016, January 8). vsearch: VSEARCH 1.9.6 (Version v1.9.6). Zenodo. http://doi.org/10.5281/zenodo.44512

3. QIIME (version 1.9.1): Caporaso JG, Kuczynski J, Stombaugh J, Bittinger K, Bushman FD, Costello EK, Fierer N, Gonzalez Pena A, Goodrich JK, Gordon JI, Huttley GA, Kelley ST, Knights D, Koenig JE, Ley RE, Lozupone CA, McDonald D, Muegge BD, Pirrung M, Reeder J, Sevinsky JR, Turnbaugh PJ, Walters WA, Widmann J, Yatsunenko T, Zaneveld J, Knight R. 2010. QIIME allows analysis of high-throughput community sequencing data. Nature Methods 7(5): 335-336.

4. R version 3.1.1: (https://cran.r-project.org/bin/windows/base/old/3.1.1/).

Comment 2-5: How did you compare taxonomic profiles between groups – R, STAMP, another method? A little detail on statistical testing is given, but this could be expanded. Reply 2-5: In the differential analysis, we used metastats to compare the abundance distributions of the five genera with the largest between-group differences. We added the statement in Results (page 7) as you suggested.

Comment 2-6: What code/ software did you use for your heatmaps?

Reply 2-6: The R version 3.1.1 was used for heatmaps. We added the text in Results (page 7) as you suggested.

Comment 3: Table 1 – you have said that you excluded patients using antibiotics within the past three months, but do you have any data on medication use here, as potentially of interest? e.g. antibiotic courses within the past year.

Reply 3: In our study, we did not evaluate the antibiotic courses within the past year in 60 patients with COPD. But we found that three COPD patients in group A and group B and seven patients in group C used antibiotics within the past three months. Patients with severe COPD seem to take more antibiotics within the past three months than those with mild and moderate COPD.

Comment 4: Figure 1 – text and figure do not make clear if only no signif difference in richness between groups, or also Shannon/ alpha diversity too? Perhaps update text and add bar to figure.

Reply 4: In alpha diversity analysis, Shannon and Chao1 indexes were used respectively to evaluate OTU richness and diversity among three COPD groups. No significant difference in OTU richness and diversity among three COPD groups was found. We modified the text to the Materials and Methods (page 6) and the Results (page 8) as you suggested.

Comment 5: Figure 3 – along x axis, please put all A samples, then all B samples, then all C samples (as has been done for Figure 4 for genera) – very mixed up as it is and hard to interpret. I would remove unclassified, and try and clean up the labelling of the y axis (e.g. looks messy saying ‘g_Faecalibacterium_unclassified’ – suggest just change to ‘unclassified Faecalibacterium’).

Reply 5: Thank you for your valuable comments. The x-axis of heatmaps (order of samples and groups) were generated automatically by analysis. “g_Faecalibacterium_unclassified” means in genus level and unclassified in species level and also original output from software. We agree your comments but the post-production of the output is not easy for us. Sorry about that.

Comment 6: Figure 5 – I don’t think any of these are actual strains, which does not surprise me; see my comment above. I am not sure this adds a huge amount, as is essentially more genus-level data.

Reply 6: Thank you for your valuable comment. We modified the text in the results (pages 8-9) as you suggested.

Comment 7: Other clinical data – did you have enough follow-up to see what happened to these patients? Have you enough follow up data to try and correlate, e.g., number of future LRTIs since these samples taken with a particular taxonomic fingerprint?

Reply 7: Thank you for your valuable comments. In this study, we did not evaluate the correlation between follow up clinical data and gut microbiota in 60 patients for this study, because it is difficult to long-term control the eating habits and antibiotics usage of 60 subjects in this study. These factors have been shown to change the distribution of gut microbiota and may affect the correlation between follow up clinical data and gut microbiota. However, the association between gut microbiota and follow up clinical data is worth investigating in the future.

Comment 8: Functional microbiome – your abstract mentions about the potential importance of SCFAs and TMA/TMAO to the gut-lung axis but doesn’t look at these at all in the analysis. While PLoS ONE is focused on technically sound work rather than novelty per se, this would substantially develop the paper. The ideal situation would be metabonomic analysis of stool, but appreciate this may not be feasible. What about using a bioinformatic tool to predict metagenomic content, e.g. Piphillin? Would be easy to do and could see if, e.g., predicted SCFA production was different between groups?

Reply 8: We stated the potential importance of SCFAs and TMA/TMAO to the gut-lung axis in introduction, not in abstract. We did not perform SCFA metabolomics analysis in this study. For avoiding the misleading to our study aims, the statements for SCFAs and TAMO have been deleted in introduction section. A new reference about a study for faecal microbiome of COPD patients and healthy controls has been added.

Comment 9: General – stated that study was approved by ethics committee of the hospital, but was there any other ethics panel review? Or a reference number? The raw microbiome data (e.g. .fastq files) should be available in the public domain (e.g. https://www.ebi.ac.uk/metagenomics/) unless the researchers have a very strong reason as to why this should not be the case.

Reply 9: No, this study was only approved by the Institutional Review Board/Ethics in Taoyuan General Hospital, Ministry of Health and Welfare. (reference number: TYGH106037). We had added a supplementary file contains the raw microbiome data as you suggested. The clinical data should be not provided in public domain owing to ethics issues, but can require from authors under reasonable request

Responses to Reviewer #2:

We appreciate your kind comments. We revised the text to indicate the limits of this study. Our responses to your comments are as follows.

Comment 1: Please don’t use the term “strain” when referring to identified taxa. 16S does not provide credible strain-level resolution.

Reply 1: We modified the text in the manuscript (page 2, 7, 10, 11, and 12) as you suggested.

Comment 2: The authors state that participants had similar eating habits. The means by which this was established should be clarified or, if not specifically assessed (e.g. food frequency questionnaire), the sentence should be removed.

Reply 2: Thank you for your kind comment. We deleted the text in the Materials and Methods (pages 4) as you suggested.

Comment 3: The authors mention rRNA depletion in relation to sputum. I suspect the authors are thinking of another study here as neither sputum or transcriptomic analysis are presented in this manuscript.

Reply 3: Thank you for your kind comment. The association between microbiota in sputum and COPD disease have been investigated in our previous paper [Lee SW, Kuan CS, Wu LSH, Weng JTY. Metagenome and Metatranscriptome Profiling of Moderate and Severe COPD Sputum in Taiwanese Han Males. PLoS One 2016; 11: e0159066]. We modified the text in the Materials and Methods (pages 4) as you suggested.

Comment 4: The authors recruited 20 patients in each group for mild moderate and severe disease categories. I agree with the approach and it is good that they analyze the clinical parameters between groups but the sample size is too small for a gut microbiome study given significant inter-individual variability (c.f. PMID: 27126040, Zhernakova et al.). Nonetheless it could be informative if, perhaps, under powered.

Reply 4: Thank you for your kind comment. We agree this preliminary study is under power. Thus, a future study to further increase the number of each grouped subjects will help solidify our finding. We added the statement about the limitations in our study to the Discussion (page 12) as you suggested.

Comment 5: “No significant difference in community richness.” Again, while it is challenging to assess power in microbiome studies, progress has been made and should be discussed (PMID: 27153704, Mattiello et al). The risk that type two error occurred here should be mentioned – remember the old adage; “no evidence of a difference is not evidence of no difference.” Base on obesity work one could speculate a difference should exist (obesity is a risk factor for COPD and the gut microbiome is altered in obese patients). I should say however, that a significant amount of variability in gut studies can be traced to stool consistency (i.e. Bristol stool chart, again see c.f. PMID: 27126040, Zhernakova et al.). This should be controlled for and leads to my obvious next question.

Reply 5: Thank you for your valuable comments. However, we did not evaluate the relationship obesity and gut microbiota in this study. Previous study indicated the association between obesity and gut microbiota [34]. According to Department of Health in Taiwan, obesity was BMI ≧ 27 kg/m2. In our study, there were seven obese COPD patients (three in group A and B, one in group C). By using χ2 test, no significant difference in distribution of obese COPD patients was found in three COPD groups. Give these information, our observations in this study may not be influenced by obesity. We added the statement about the limitations in our study to the Discussion (page 12) as you suggested.

Comment 6: How was stool consistency assessed? If variable between severity groups it could represent a significant confounder. Was the Bristol stool chart used?

Reply 6: Thank you for your valuable comments. However, we did not use the Bristol stool chart to evaluate stool consistency. Recent studies indicated the close relationship between stool consistency and changes in gut microbiota [References 35-36]. We added the statement about the limitations in our study to the Discussion (page 12) as you suggested.

Comment 7: In relation to controls, blank extraction samples should be reported (both sequencing and extraction blanks). Although the authors report that DNA concentrations were quality controlled, and are likely to be microbe-rich given that these are stool samples, contamination is always a risk, especially when employing amplicon sequencing. Ideally, mock community analysis samples should also have been included.

Reply 7: Thank you for your valuable comments. In this study, all DNA processing were performed under aseptic conditions. But, we did not evaluate the extraction blank. Previous study indicated that reagent and laboratory contamination can influence sequence-based microbiome analysis [reference 33]. We add the statement about the limitations in our study to the Discussion (page 12) as you suggested.

Comment 8: “Group similarities at genus and species level”. In relation to the statement “In the cluster of sample analysis, group A and B were more similar than group C” - define what is meant by “more similar” in the text. What distance metric was employed.? I think A PCA analysis would work better here. Alternatively, if keeping the heat maps (3a 4a) colour could be used to indicate group membership of each patient.

Reply 8: Thank you for your valuable comments. In the Group similarities at genus and species level of the Results, we indicated that the distribution of top 30 abundant taxa at species and genus level in groups A and B were more similar than those in group C. In Figure 3b and 4b, we used the euclidean distance to evaluate the similarities in three COPD group.

Comment 9: Differential abundance. Did the authors use LEFSE or metastats? These are now standard methods. PERMANOVA could also be conducted. FDR anaysis is ok but won’t account for data sparsity. I commend the authors for their data availability (and the clarity of the data, which is easy to interpret and assess). However, I have performed Lefse analysis and this reveals no differences between groups A, B or C. I can reproduce the observation concerning Fusobacterium which does seem to be over represented in the severe group (group C).This does not completely invalidate the authors findings but serves to underscore that the sample size is small and different methods may give contrasting results based on the models employed. At least we can say there is some consistency as the Fusobacterium observation is reproduced. However, it is hard to know how reproducible or biologically important these findings are over all.

Reply 9: We very appreciate your comments. We did not find any difference in Lefse analysis also. The biological important of Fusobacterium in COPD need to further study to validate. Owing to the ethnic issues, we cannot put the clinical data to public domain. We are welcome to cooperate with other researcher with the some interest with us. We should provide our all original data for meta-analysis or further in-depth analysis.

Comment 10: I don’t think species level analysis is advisable in the case of 16S analysis. I would cut at genus level as it is more reliable and gives a more realistic appraisal of the microbiome in my view.

Reply 10: Thank you for your valuable comment. We modified the text in the results (pages 8-9) as you suggested.

Comment 11: Though the taxonomic data is accessible, the authors stop short of making the clinical metadata available. Without this I can’t reproduce the bacteriodes finding. I would recommend the authors implement Maaslin (https://huttenhower.sph.harvard.edu/maaslin/) to see if the observations regarding lung function and eosinophil counts hold up. If they do, this is potentially an interesting finding.

Reply 11: Thank you for your valuable comments. We used spearman correlation coefficient to determine the relationship between each OTU abundance and clinical features. MaAsLin is a multivariate statistical framework that finds associations between clinical metadata and potentially high-dimensional experimental data. We are afraid small sample size is also a limitation to use multivariate statistical analysis.

Comment 12: Final line of the discussion goes too far. “This should be useful information for developing new diagnostic or therapeutic markers to control COPD progression.” The findings must be validated in independent studies with larger patient numbers before we are anywhere near even considering diagnostics or therapeutics. This is a very preliminary glimpse of what MIGHT be going on in COPD that requires extensive additional validation work in future studies.

Reply 12: Thank you for your kind comment. We modified the text in the discussion (pages 12) as you suggested.

Attachment

Submitted filename: Response for comments 2021.docx

Decision Letter 1

Aran Singanayagam

27 Jan 2021

PONE-D-20-30223R1

Comprehensive profiling of the gut microbiota in patients with chronic obstructive pulmonary disease of varying severity

PLOS ONE

Dear Dr. Wu,

Thank you for submitting your manuscript to PLOS ONE. After careful consideration, we feel that it has merit but does not fully meet PLOS ONE’s publication criteria as it currently stands. Therefore, we invite you to submit a revised version of the manuscript that addresses the points raised during the review process.

Please submit your revised manuscript by Mar 13 2021 11:59PM. If you will need more time than this to complete your revisions, please reply to this message or contact the journal office at plosone@plos.org. When you're ready to submit your revision, log on to https://www.editorialmanager.com/pone/ and select the 'Submissions Needing Revision' folder to locate your manuscript file.

Please include the following items when submitting your revised manuscript:

  • A rebuttal letter that responds to each point raised by the academic editor and reviewer(s). You should upload this letter as a separate file labeled 'Response to Reviewers'.

  • A marked-up copy of your manuscript that highlights changes made to the original version. You should upload this as a separate file labeled 'Revised Manuscript with Track Changes'.

  • An unmarked version of your revised paper without tracked changes. You should upload this as a separate file labeled 'Manuscript'.

If you would like to make changes to your financial disclosure, please include your updated statement in your cover letter. Guidelines for resubmitting your figure files are available below the reviewer comments at the end of this letter.

If applicable, we recommend that you deposit your laboratory protocols in protocols.io to enhance the reproducibility of your results. Protocols.io assigns your protocol its own identifier (DOI) so that it can be cited independently in the future. For instructions see: http://journals.plos.org/plosone/s/submission-guidelines#loc-laboratory-protocols

We look forward to receiving your revised manuscript.

Kind regards,

Aran Singanayagam

Academic Editor

PLOS ONE

[Note: HTML markup is below. Please do not edit.]

Reviewers' comments:

Reviewer's Responses to Questions

Comments to the Author

1. If the authors have adequately addressed your comments raised in a previous round of review and you feel that this manuscript is now acceptable for publication, you may indicate that here to bypass the “Comments to the Author” section, enter your conflict of interest statement in the “Confidential to Editor” section, and submit your "Accept" recommendation.

Reviewer #1: All comments have been addressed

Reviewer #2: All comments have been addressed

**********

2. Is the manuscript technically sound, and do the data support the conclusions?

The manuscript must describe a technically sound piece of scientific research with data that supports the conclusions. Experiments must have been conducted rigorously, with appropriate controls, replication, and sample sizes. The conclusions must be drawn appropriately based on the data presented.

Reviewer #1: Yes

Reviewer #2: Partly

**********

3. Has the statistical analysis been performed appropriately and rigorously?

Reviewer #1: Yes

Reviewer #2: Yes

**********

4. Have the authors made all data underlying the findings in their manuscript fully available?

The PLOS Data policy requires authors to make all data underlying the findings described in their manuscript fully available without restriction, with rare exception (please refer to the Data Availability Statement in the manuscript PDF file). The data should be provided as part of the manuscript or its supporting information, or deposited to a public repository. For example, in addition to summary statistics, the data points behind means, medians and variance measures should be available. If there are restrictions on publicly sharing data—e.g. participant privacy or use of data from a third party—those must be specified.

Reviewer #1: Yes

Reviewer #2: No

**********

5. Is the manuscript presented in an intelligible fashion and written in standard English?

PLOS ONE does not copyedit accepted manuscripts, so the language in submitted articles must be clear, correct, and unambiguous. Any typographical or grammatical errors should be corrected at revision, so please note any specific errors here.

Reviewer #1: Yes

Reviewer #2: Yes

**********

6. Review Comments to the Author

Please use the space provided to explain your answers to the questions above. You may also include additional comments for the author, including concerns about dual publication, research ethics, or publication ethics. (Please upload your review as an attachment if it exceeds 20,000 characters)

Reviewer #1: The Authors have clearly responded appropriately to the Reviewer comments, and the manuscript is strengthened through the changes made - thank you.

Reviewer #2: Major

Apologies, but I don’t see where the raw data has been deposited (e.g. NCBI sequence read archive). I think this is a PLoS requirement.

Minor

The authors state that “The R version 3.1.1 was used for heatmaps”.

That’s not really sufficient as one needs to know what package was used. The authors, at minimum, should specify what R packages were used in their analysis (e.g. pheatmap). A succinct summary (listing all R packages) in the methods would suffice.

Re: Reply 7:

If not already included somewhere, the authors should state the average DNA concentration observed in sample DNA extracts. If it is quite high (50ng/ul or more) this serves as a counterargument to the influence of contamination, which could also be highlighted in the discussion. While it is now field standard to control for contamination, and the exclusion of such samples is a major oversight, it would be comforting to know your DNA yields from stool were high, which presumably they were.

**********

7. PLOS authors have the option to publish the peer review history of their article (what does this mean?). If published, this will include your full peer review and any attached files.

If you choose “no”, your identity will remain anonymous but your review may still be made public.

Do you want your identity to be public for this peer review? For information about this choice, including consent withdrawal, please see our Privacy Policy.

Reviewer #1: Yes: Benjamin H Mullish

Reviewer #2: No

[NOTE: If reviewer comments were submitted as an attachment file, they will be attached to this email and accessible via the submission site. Please log into your account, locate the manuscript record, and check for the action link "View Attachments". If this link does not appear, there are no attachment files.]

While revising your submission, please upload your figure files to the Preflight Analysis and Conversion Engine (PACE) digital diagnostic tool, https://pacev2.apexcovantage.com/. PACE helps ensure that figures meet PLOS requirements. To use PACE, you must first register as a user. Registration is free. Then, login and navigate to the UPLOAD tab, where you will find detailed instructions on how to use the tool. If you encounter any issues or have any questions when using PACE, please email PLOS at figures@plos.org. Please note that Supporting Information files do not need this step.

PLoS One. 2021 Apr 9;16(4):e0249944. doi: 10.1371/journal.pone.0249944.r004

Author response to Decision Letter 1


2 Feb 2021

Reviewer #2: Major

Apologies, but I don’t see where the raw data has been deposited (e.g. NCBI sequence read archive). I think this is a PLoS requirement.

Response: In this study, we reported the analyses of 16S rRNA V3+V4 hypervariable regions by sequencing for stool from COPD patients. The data is neither microarray nor deep sequencing data. We did not found any public database which enrolled microbiota profile using partial sequence (V3+V4) data.

Data Availability: The data has been also submitted as S1 Table (Excel file) in Supporting Information files. The data file contains the reads number blast to the OTUs in each sample. The sample ID: A- x = samples in group A; B- x = samples in group B; C- x = samples in group C

Some articles had been published in Plos One (as following) did not mention any deposited (e.g. NCBI sequence read archive) record.

� Ingrid S. Surono, Dian Widiyanti, Pratiwi D. Kusumo, Koen Venema. Gut microbiota profile of Indonesian stunted children and children with normal nutritional status. Published: January 26, 2021https://doi.org/10.1371/journal.pone.0245399

� Aasia Khaliq, Resmi Ravindran, Samia Afzal, Prasant Kumar Jena, Muhammad Waheed Akhtar, Atiqa Ambreen, Yu-Jui Yvonne Wan, Kauser Abdulla Malik, Muhammad Irfan, Imran H. Khan Gut microbiome dysbiosis and correlation with blood biomarkers in active-tuberculosis in endemic setting. Research Article | published 22 Jan 2021 PLOS ONE https://doi.org/10.1371/journal.pone.0245534

We are willing to share our data by fasta format under a reasonable requirement in the future.

Minor

The authors state that “The R version 3.1.1 was used for heatmaps”.

That’s not really sufficient as one needs to know what package was used. The authors, at minimum, should specify what R packages were used in their analysis (e.g. pheatmap). A succinct summary (listing all R packages) in the methods would suffice.

Response:

Thank you for the suggestion. The statement has been revised as “The pheatmap package (https://cran.r-project.org/src/contrib/Archive/pheatmap/) was used for ecological analysis and heatmaps”. (Page 7)

Re: Reply 7:

If not already included somewhere, the authors should state the average DNA concentration observed in sample DNA extracts. If it is quite high (50ng/ul or more) this serves as a counterargument to the influence of contamination, which could also be highlighted in the discussion. While it is now field standard to control for contamination, and the exclusion of such samples is a major oversight, it would be comforting to know your DNA yields from stool were high, which presumably they were.

Response:

We added the DNA extraction kit in methods section (page 4). The average DNA concentration has been stated in results section as “The stool DNA samples were eluted in 200 μl AE buffer. The average of DNA concentration was 5.52 ng/ul (range 1.05 – 12.43 ng/ul).” Please see page 8.

Attachment

Submitted filename: Response to comments R2.docx

Decision Letter 2

Aran Singanayagam

22 Feb 2021

PONE-D-20-30223R2

Comprehensive profiling of the gut microbiota in patients with chronic obstructive pulmonary disease of varying severity

PLOS ONE

Dear Dr. Wu,

Thank you for submitting your manuscript to PLOS ONE. After careful consideration, we feel that it has merit but does not fully meet PLOS ONE’s publication criteria as it currently stands. Therefore, we invite you to submit a revised version of the manuscript that addresses the points raised during the review process.

ACADEMIC EDITOR: The manuscript is almost ready for acceptance but the comment made by reviewer 2 needs to be addressed. It is now field standard for all 16S rRNA sequencing data to be uploaded onto a public repository server (eg European Nucleotide Archive) so that other researchers have open access to the data. Please organise for your data to be submitted and available in this way.

Please submit your revised manuscript by Apr 08 2021 11:59PM. If you will need more time than this to complete your revisions, please reply to this message or contact the journal office at plosone@plos.org. When you're ready to submit your revision, log on to https://www.editorialmanager.com/pone/ and select the 'Submissions Needing Revision' folder to locate your manuscript file.

Please include the following items when submitting your revised manuscript:

  • A rebuttal letter that responds to each point raised by the academic editor and reviewer(s). You should upload this letter as a separate file labeled 'Response to Reviewers'.

  • A marked-up copy of your manuscript that highlights changes made to the original version. You should upload this as a separate file labeled 'Revised Manuscript with Track Changes'.

  • An unmarked version of your revised paper without tracked changes. You should upload this as a separate file labeled 'Manuscript'.

If you would like to make changes to your financial disclosure, please include your updated statement in your cover letter. Guidelines for resubmitting your figure files are available below the reviewer comments at the end of this letter.

If applicable, we recommend that you deposit your laboratory protocols in protocols.io to enhance the reproducibility of your results. Protocols.io assigns your protocol its own identifier (DOI) so that it can be cited independently in the future. For instructions see: http://journals.plos.org/plosone/s/submission-guidelines#loc-laboratory-protocols

We look forward to receiving your revised manuscript.

Kind regards,

Aran Singanayagam

Academic Editor

PLOS ONE

[Note: HTML markup is below. Please do not edit.]

Reviewers' comments:

Reviewer's Responses to Questions

Comments to the Author

1. If the authors have adequately addressed your comments raised in a previous round of review and you feel that this manuscript is now acceptable for publication, you may indicate that here to bypass the “Comments to the Author” section, enter your conflict of interest statement in the “Confidential to Editor” section, and submit your "Accept" recommendation.

Reviewer #2: (No Response)

**********

2. Is the manuscript technically sound, and do the data support the conclusions?

The manuscript must describe a technically sound piece of scientific research with data that supports the conclusions. Experiments must have been conducted rigorously, with appropriate controls, replication, and sample sizes. The conclusions must be drawn appropriately based on the data presented.

Reviewer #2: Partly

**********

3. Has the statistical analysis been performed appropriately and rigorously?

Reviewer #2: Yes

**********

4. Have the authors made all data underlying the findings in their manuscript fully available?

The PLOS Data policy requires authors to make all data underlying the findings described in their manuscript fully available without restriction, with rare exception (please refer to the Data Availability Statement in the manuscript PDF file). The data should be provided as part of the manuscript or its supporting information, or deposited to a public repository. For example, in addition to summary statistics, the data points behind means, medians and variance measures should be available. If there are restrictions on publicly sharing data—e.g. participant privacy or use of data from a third party—those must be specified.

Reviewer #2: No

**********

5. Is the manuscript presented in an intelligible fashion and written in standard English?

PLOS ONE does not copyedit accepted manuscripts, so the language in submitted articles must be clear, correct, and unambiguous. Any typographical or grammatical errors should be corrected at revision, so please note any specific errors here.

Reviewer #2: Yes

**********

6. Review Comments to the Author

Please use the space provided to explain your answers to the questions above. You may also include additional comments for the author, including concerns about dual publication, research ethics, or publication ethics. (Please upload your review as an attachment if it exceeds 20,000 characters)

Reviewer #2: "We did not found any public database which enrolled microbiota profile using partial sequence (V3+V4) data."

I cannot see any reason that public repositories such as the sequence read archives (NCBI) would not accept the type of data you describe. I highly encourage the authors to make their data publicly available as per field standards.

**********

7. PLOS authors have the option to publish the peer review history of their article (what does this mean?). If published, this will include your full peer review and any attached files.

If you choose “no”, your identity will remain anonymous but your review may still be made public.

Do you want your identity to be public for this peer review? For information about this choice, including consent withdrawal, please see our Privacy Policy.

Reviewer #2: No

[NOTE: If reviewer comments were submitted as an attachment file, they will be attached to this email and accessible via the submission site. Please log into your account, locate the manuscript record, and check for the action link "View Attachments". If this link does not appear, there are no attachment files.]

While revising your submission, please upload your figure files to the Preflight Analysis and Conversion Engine (PACE) digital diagnostic tool, https://pacev2.apexcovantage.com/. PACE helps ensure that figures meet PLOS requirements. To use PACE, you must first register as a user. Registration is free. Then, login and navigate to the UPLOAD tab, where you will find detailed instructions on how to use the tool. If you encounter any issues or have any questions when using PACE, please email PLOS at figures@plos.org. Please note that Supporting Information files do not need this step.

PLoS One. 2021 Apr 9;16(4):e0249944. doi: 10.1371/journal.pone.0249944.r006

Author response to Decision Letter 2


16 Mar 2021

Reviewer #2:

I cannot see any reason that public repositories such as the sequence read archives (NCBI) would not accept the type of data you describe. I highly encourage the authors to make their data publicly available as per field standards.

ACADEMIC EDITOR: The manuscript is almost ready for acceptance but the comment made by reviewer 2 needs to be addressed. It is now field standard for all 16S rRNA sequencing data to be uploaded onto a public repository server (eg European Nucleotide Archive) so that other researchers have open access to the data. Please organise for your data to be submitted and available in this way.

Response:

We have organized our data and submitted to European Nucleotide Archive, Accession No: PRJEB43280. Please see the section “Availability of data and materials”.

Attachment

Submitted filename: Response to comments R3.docx

Decision Letter 3

Aran Singanayagam

29 Mar 2021

Comprehensive profiling of the gut microbiota in patients with chronic obstructive pulmonary disease of varying severity

PONE-D-20-30223R3

Dear Dr. Wu,

We’re pleased to inform you that your manuscript has been judged scientifically suitable for publication and will be formally accepted for publication once it meets all outstanding technical requirements.

Within one week, you’ll receive an e-mail detailing the required amendments. When these have been addressed, you’ll receive a formal acceptance letter and your manuscript will be scheduled for publication.

An invoice for payment will follow shortly after the formal acceptance. To ensure an efficient process, please log into Editorial Manager at http://www.editorialmanager.com/pone/, click the 'Update My Information' link at the top of the page, and double check that your user information is up-to-date. If you have any billing related questions, please contact our Author Billing department directly at authorbilling@plos.org.

If your institution or institutions have a press office, please notify them about your upcoming paper to help maximize its impact. If they’ll be preparing press materials, please inform our press team as soon as possible -- no later than 48 hours after receiving the formal acceptance. Your manuscript will remain under strict press embargo until 2 pm Eastern Time on the date of publication. For more information, please contact onepress@plos.org.

Kind regards,

Aran Singanayagam

Academic Editor

PLOS ONE

Additional Editor Comments (optional):

Reviewers' comments:

Acceptance letter

Aran Singanayagam

31 Mar 2021

PONE-D-20-30223R3

Comprehensive profiling of the gut microbiota in patients with chronic obstructive pulmonary disease of varying severity

Dear Dr. Wu:

I'm pleased to inform you that your manuscript has been deemed suitable for publication in PLOS ONE. Congratulations! Your manuscript is now with our production department.

If your institution or institutions have a press office, please let them know about your upcoming paper now to help maximize its impact. If they'll be preparing press materials, please inform our press team within the next 48 hours. Your manuscript will remain under strict press embargo until 2 pm Eastern Time on the date of publication. For more information please contact onepress@plos.org.

If we can help with anything else, please email us at plosone@plos.org.

Thank you for submitting your work to PLOS ONE and supporting open access.

Kind regards,

PLOS ONE Editorial Office Staff

on behalf of

Dr. Aran Singanayagam

Academic Editor

PLOS ONE

Associated Data

    This section collects any data citations, data availability statements, or supplementary materials included in this article.

    Supplementary Materials

    S1 Fig. OTU Venn diagram.

    (DOCX)

    S1 Table. The statistics for the OUTs sequence number in each sample.

    (XLS)

    S2 Table. Spearman correlation coefficient and p value of correlation analysis for OTUs and clinical features (blood eosinophil percentage and lung function).

    (XLS)

    Attachment

    Submitted filename: Response for comments 2021.docx

    Attachment

    Submitted filename: Response to comments R2.docx

    Attachment

    Submitted filename: Response to comments R3.docx

    Data Availability Statement

    All relevant data are within the manuscript and its Supporting information files.


    Articles from PLoS ONE are provided here courtesy of PLOS

    RESOURCES