

Abstract
Cholesterol is a major component of the plasma membranes (PMs) of animal cells, comprising 35–40 mol% of total PM lipids. Recent studies using cholesterol-binding bacterial toxins such as domain 4 of Anthrolysin O (ALOD4) and fungal toxins such as Ostreolysin A (OlyA) have revealed new insights into the organization of PM cholesterol. These studies have defined three distinct pools of PM cholesterol—a fixed pool that is essential for membrane integrity, a sphingomyelin (SM)-sequestered pool that can be detected by OlyA, and a third pool that is accessible and can be detected by ALOD4. Accessible cholesterol is available to interact with proteins and transport to the endoplasmic reticulum (ER), and controls many cellular signaling processes including cholesterol homeostasis, Hedgehog signaling, and bacterial and viral infection. Here, we provide detailed descriptions for the use of ALOD4 and OlyA, both of which are soluble and non-lytic proteins, to study cholesterol organization in the PMs of animal cells. Furthermore, we describe two new versions of ALOD4 that we have developed to increase the versatility of this probe in cellular studies. One is a dual His6 and FLAG epitope-tagged version and the other is a fluorescent version where ALOD4 is fused to Neon, a monomeric fluorescent protein. These new forms of ALOD4 together with previously described OlyA provide an expanded collection of tools to sense, visualize, and modulate levels of accessible and SM-sequestered cholesterol on PMs and study the role of these cholesterol pools in diverse membrane signaling events.
1. Introduction
Cholesterol is an essential and abundant component of animal cell membranes. The concentration of this lipid varies by as much as 10-fold in membranes of various cellular organelles. In the plasma membrane (PM), cholesterol comprises 35–40 mol% of total PM lipids whereas in the endoplasmic reticulum (ER) membrane, cholesterol comprises only ~5 mol % of total ER lipids (Das, Goldstein, Anderson, Brown, & Radhakrishnan, 2013; Radhakrishnan, Goldstein, McDonald, & Brown, 2008). In contrast to eukaryotes, cholesterol is extremely rare in prokaryotic organisms (Ourisson, Rohmer, & Poralla, 1987). Several Gram-positive bacteria exploit this difference to target eukaryotic membranes with soluble toxin proteins known as cholesterol dependent cytolysins (CDCs), which bind to eukaryotic cholesterol-containing membranes and form pores (Heuck, Moe, & Johnson, 2010; Ohno-Iwashita et al., 2010; Tweten, 2005). Bacteria are not alone in their lipid-dependent, pore-forming toxin strategy. Other organisms, including mushrooms, worms, and sea anemones, target the sphingomyelin (SM) lipid component of eukaryotic cell membranes (Anderluh & Macek, 2002; Bernheimer & Avigad, 1979; Bhat et al., 2013; Makino et al., 2017; Skocaj et al., 2014; Tomita et al., 2004; Yamaji et al., 1998). In some cases, special combinations of SM and cholesterol are targeted (Endapally, Frias, et al., 2019; Makino et al., 2017; Skocaj et al., 2014).
These diverse toxins use at least two different mechanisms to form pores. Some pore forming toxins contain both lipid binding and pore formation activities in a single protein. Examples of such toxins are Perfringolysin O (PFO) from Clostridium perfringens or Anthrolysin O (ALO) from Bacillus anthracis which bind to accessible cholesterol with one region of the protein (Domain 4, D4) and use a different region of the protein (Domains 1–3, D1–3) to homo-oligomerize and form a transmembrane pore (see Fig. 1) (Bourdeau et al., 2009; Gay, Rye, & Radhakrishnan, 2015; Heuck et al., 2010). Other pore forming toxins require activities of two proteins—one to bind to membrane lipids and another to drive oligomerization and pore formation. An example of such a two-protein system is provided by Pleurotus ostreatus. This fungus produces two proteins, Ostreolysin A (OlyA) and Pleurotolysin B (PlyB). OlyA binds to SM-sequestered cholesterol in membranes (see Fig. 1) and PlyB binds to the membrane-bound OlyA to promote oligomerization and pore formation (Endapally, Frias, et al., 2019; Lukoyanova et al., 2015; Skocaj et al., 2014).
Fig. 1.
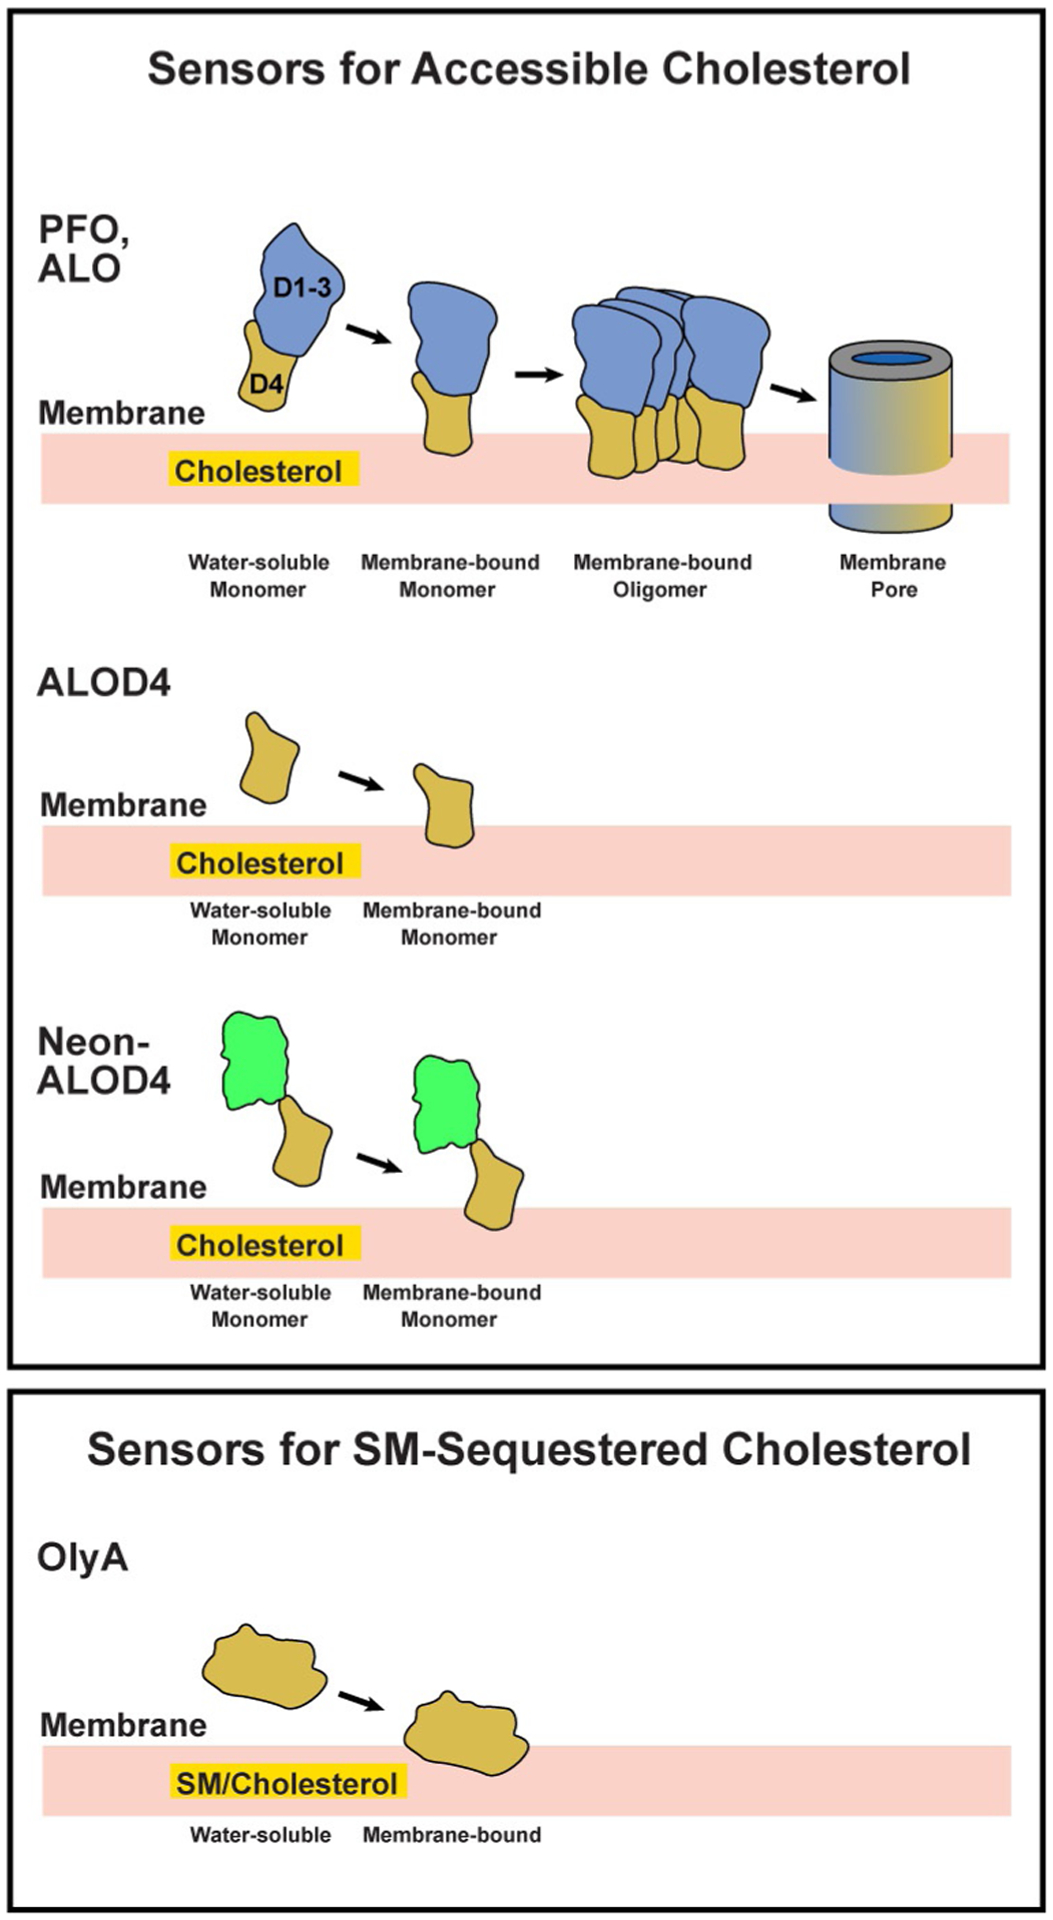
Schematic representation of sensors for accessible cholesterol and SM-sequestered cholesterol that are described in this study.
In this chapter, we will review the uses of ALO and OlyA, both of which are soluble proteins, to detect two distinct pools of cholesterol—accessible and SM-sequestered—in the PMs of animal cells. Assessing the PM without interference from membranes of other cellular organelles requires elimination of the pore-forming properties of these toxins. Fortunately, after significant protein engineering, we generated a soluble form of domain 4 of ALO (ALOD4) that does not form pores in membranes (Gay et al., 2015; Infante & Radhakrishnan, 2017) (Fig. 1). In the case of OlyA, no protein engineering was required since OlyA is non-lytic on its own as described above. These non-lytic tools have been used to resolve how cholesterol is organized in PM (He et al., 2017; Johnson & Radhakrishnan, 2020), how cholesterol organization in PM influences its accessibility for intracellular transport and controls cholesterol synthesis (Das, Brown, Anderson, Goldstein, & Radhakrishnan, 2014; Infante & Radhakrishnan, 2017; Johnson, Endapally, Vazquez, Infante, & Radhakrishnan, 2019), how accessibility of cholesterol controls Hedgehog signaling at the ciliary membrane (Kinnebrew et al., 2019), and how immune signals mobilize accessible cholesterol away from the PM during bacterial and viral infection (Abrams et al., 2020; Wang et al., 2020; Zhou et al., 2020). To expand the versatility and potential uses of ALOD4, we have developed two new versions of this probe, a dual epitope-tagged version (His6-FLAG-ALOD4) and a fluorescent version (His6-Neon-FLAG-ALOD4) (Fig. 1). Here, we describe how to purify these new versions of ALOD4 (Section 2), how to use ALOD4 and OlyA as sensors for accessible and SM-sequestered cholesterol on live cells (Section 3), how to visualize accessible cholesterol on PM with His6-Neon-Flag-ALOD4 (Section 4), and how to assay for ALOD4 inhibition of accessible cholesterol transport from PM to ER (Section 5).
2. Purification of recombinant cholesterol-binding toxin proteins
Procedures for the overexpression and purification of His6-tagged versions of ALOD4 and OlyA have been described in detail (Endapally, Frias, et al., 2019; Endapally, Infante, & Radhakrishnan, 2019). Recently, our lab has generated additional ALOD4 constructs, His6-Flag-ALOD4, His6-Flag-ALOD4 (Mut) (GTTLYP→AAAAA, non-binding mutant), His6-Neon-Flag-ALOD4, and His6-Neon-Flag-ALOD4 (Mut) (GTTLYP→AAAAA, non-binding mutant). His6-Flag-ALOD4 and His6-Flag-ALOD4 (Mut) were overexpressed and purified using a previously described protocol (Endapally, Infante, et al., 2019). Unfortunately, when we used this same protocol to purify His6-Neon-Flag-ALOD4, the resultant purified protein was prone to degradation. Therefore, we developed an alternate purification scheme which is described below.
2.1. Materials
- Expression plasmids
- pHis6-ALOD4, in the pRSET B expression vector, encodes, in sequential order from the NH2-terminus, a 10-aa linker that includes a His6 epitope tag (MRGSHHHHHH), a 23 aa-linker that includes the epitope for the anti-Xpress monoclonal antibody and an entero-kinase cleavage site (GMASMTGGQQMGRDLYDDDDKDP), followed by domain 4 of ALO (aa 404–512). The sole native cysteine in ALOD4 (C472) was mutated to alanine and S404 was mutated to cysteine to allow for maleimide labeling at a position far from the cholesterol binding site in ALOD4. This plasmid is available from Addgene (Cat # 111026) (Gay et al., 2015).
- pHis6-Flag-ALOD4, also in the pRSET B expression vector, encodes, in sequential order from the NH2-terminus, a 10-aa linker that includes a His6 epitope tag (MRGSHHHHHH), a 23 aa-linker that includes a FLAG epitope tag (GMASMTGGQQMGRDYKDDDDKDP), and domain 4 of ALO (aa 404–512). The ALOD4 portion of the plasmid contains the same two mutations (S404C and C472A) described above for pHis6-ALOD4.
- pHis6-Flag-ALOD4 (Mut) is the same as pHis6-Flag-ALOD4 described above, except that it contains six mutations (G501A, T502A, T503A, L504A, Y505A, and P506A) that disrupt cholesterol binding.
- pHis6-Neon-Flag-ALOD4, in the pRSET B expression vector, encodes, in sequential order from the NH2-terminus, a 13-aa linker that includes a His6 epitope tag (MRGSHHHHHHGMA), the monomeric fluorescent protein Neon (aa 1–236) (Shaner et al., 2013), a 21 aa-linker that includes a FLAG epitope tag (ASMTGGQQMGRDYKDDDDKDP), and domain 4 of ALO (aa 404–512). The ALOD4 portion of the plasmid contains the same two mutations (S404C and C472A) described above for pHis6-ALOD4.
- pHis6-Neon-Flag-ALOD4 (Mut) is the same as pHis6-Neon-Flag-ALOD4 described above, except that it contains six mutations (G501A, T502A, T503A, L504A, Y505A, and P506A) that disrupt cholesterol binding.
- pOlyA-His6, in the pET21C+ expression vector, encodes, in sequential order from the NH2-terminus, OlyA (aa 1–138) and a 21-aa linker that includes a His6 epitope tag (LVPRGSEGKSGCGLEHHHHHH). The two native cysteines in OlyA (C62 and C94) was mutated to serine and a new cysteine was introduced near the COOH-terminus (S151C) to allow for maleimide labeling at a position far from the binding site in OlyA for sphingomyelin/cholesterol complexes. This plasmid is available from Addgene (Cat # 132391) (Endapally, Frias, et al., 2019).
BL21 (DE3) pLysS Escherichia coli competent cells, Invitrogen, Cat # C6060
Luria Broth (LB) capsules, Research Products International, Cat # L24041
Ampicillin, 1000 × (100 mg/mL) stock solution, powder available from RPI Cat # A40040
Isopropyl β-d-thiogalactoside (IPTG), 1000 × (1 M) stock solution in water, powder available from Goldbio, Cat # I2481C300
Buffer A, 50 mM Tris–HCl (pH 7.5), 150 mM NaCl, and 1 mM tris(2-carboxyethyl)phosphine (TCEP)
Buffer B, buffer A supplemented with 500 mM Imidazole (pH 7.5)
Phenyl methanesulfonyl fluoride (PMSF), 1000 × (20 mg/mL) stock solution in ethanol, powder available from Sigma-Aldrich, Cat # P7626
Protease inhibitor tablets, use 1 per 20 mL buffer, Thermo Fisher scientific, Cat # 88266
Lysozyme from chicken egg white 10 × (10 mg/mL) stock in water, Sigma-Aldrich, Cat # L6876
100-mL all glass Dounce tissue grinder, Kimble though Fisher Scientific, Cat # K885303
Branson Digital Sonifier, Fisher Scientific
Ni-NTA agarose beads, Qiagen, Cat # 30250
Econo-column chromatography column, 1.5 × 20 cm, BioRad, Cat # 7371522
Amicon Ultra-4 10-kDa cutoff centrifugal filters, Millipore, Cat # UFC801024
Column for size-exclusion chromatography (SEC) such as Superdex 200 column, GE Healthcare, Cat # 28990944
Fast protein liquid chromatography (FPLC) system for SEC such as AKTA purifier, GE Healthcare
15% sodium dodecyl sulfate polyacrylamide gel electrophoresis (SDS/PAGE) gels
Quick Coomassie stain, Anatrace, Cat # GEN-QC-STAIN
5 × SDS loading buffer, 10% (w/v) SDS, 10 mM β-mercaptoethanol, 20% (v/v) glycerol, 0.2 M Tris–HCl, pH6.8, 0.05% (w/v) bromophenol blue
Spectrophotometer such as the NanoDrop, Thermo Fisher Scientific, to determine protein concentration
Imager to visualize fluorescent protein bands on SDS/PAGE, such as the LICOR Odyssey, LICOR
2.2. Protocols
2.2.1. Expression protocol for His6-Neon-Flag-ALOD4
Transform His6-Neon-Flag-ALOD4 plasmid into BL21 (DE3) pLysS Escherichia coli competent cells according to the manufacturers protocol and plate transformed cells on LB-Agar plates with ampicillin (100 μg/mL).
After incubation of plates for 16h at 37°C, pick a single colony and inoculate 160 mL LB containing 100 μg/mL ampicillin. Incubate this starter culture in a shaker-incubator (250rpm) for 12–16h at 30°C or until OD600 is between 0.8 and 1.0.
Inoculate 1L LB containing 100 μg/mL ampicillin with 20 mL of the starter culture. Incubate at 37°C in a shaker-incubator (250rpm) until OD600 is 0.4–0.6. Reduce shaker temperature to 18°C, add IPTG to a final concentration of 1 mM to induce protein expression and continue shaking at 18°C for 18–24h. Harvest the cells by centrifugation at 3220 × g for 10 min at 4°C, and immediately use cell pellet for protein purification or flash-freeze bacterial pellets in liquid nitrogen and store at −80°C for up to 6 months.
2.2.2. Purification protocol for His6-Neon-Flag-ALOD4
Resuspend cell pellet from 1L of bacterial culture in 20 mL buffer A supplemented with PMSF, 1 protease inhibitor tablet, and lysozyme (1 mg/mL).
Homogenize the cell suspension using 12 strokes in a Dounce homogenizer, incubate at 4°C while rotating for 2h, then repeat Dounce homogenization step.
Further lyse the lysozyme-disrupted cells using a tip sonicator: 40% amplitude, 3 min cycle (repeating sequences of 3s on, 3s off) followed by 6 min cool down; repeat cycle two additional times.
Subject cell lysate to centrifugation (4°C, 30 min, 25,000 × g) to eliminate insoluble cell debris.
Incubate supernatant with 10 mL buffer A-equilibrated Ni-NTA beads on an orbital shaker at 4°C for 30 min.
Pour protein-Ni-NTA mixture into an empty chromatography column.
After beads have settled, wash column with 50 mL buffer A, then with 50 mL buffer A containing 25 mM imidazole and protease inhibitor (5% buffer B), and finally with 50 mL buffer A containing 50 mM imidazole and protease inhibitor (10% buffer B).
Elute bound protein from column with 20 mL buffer A containing 250 mM imidazole and protease inhibitor (50% buffer B).
Concentrate eluate to 4 mL with Amicon Ultra-4 10-kDa cutoff centrifugal filters (3220 × g, 4°C).
Subject concentrated eluate to centrifugation (4°C, 30 min, 20,000 × g) to remove aggregate protein (if any) to prepare for SEC.
Inject 2 mL at a time onto Superdex 200 column equilibrated in buffer A connected to a FPLC system such as AKTA purifier. Collect protein-rich fractions and determine protein concentration with a bicinchoninic acid (BCA) assay kit or Spectrometer such as a NanoDrop according to manufacturer instructions.
See SEC profiles in Fig. 2A for examples of the monodisperse nature of His6-Neon-Flag-ALOD4 (dashed line) purified as described above and His6-Flag-ALOD4 (solid line) purified as described previously (Endapally, Infante, et al., 2019). Maximum values of absorbance at 280 nm for each protein were normalized to 1.
An aliquot (2 μg) of either His6-Flag-ALOD4 (Fig. 2B, lane 1) or His6-Neon-Flag-ALOD4 (Fig. 2B, lane 2), was subjected to 15% SDS/PAGE and stained with Coomassie (left panel) or imaged with the 600 nm filter on a Licor Imager to detect Neon fluorescence (right panel). Coomassie staining shows that purified His6-Flag-ALOD4 migrates as a single band whereas purified His6-Neon-Flag-ALOD4 migrates as a doublet. Only one of the two Coomassie-stained bands observed for His6-Neon-Flag-ALOD4 showed a fluorescent signal. We did not conduct further analysis of the second Coomassie-stained band.
An aliquot (20 ng) of either His6-Flag-ALOD4 (Fig. 2C, lanes 1 and 3) or His6-Neon-Flag-ALOD4 (Fig. 2C, lanes 2 and 4), was subjected to 15% SDS/PAGE followed by immunoblot analysis with an anti-His (Fig. 2C, left panel) or anti-Flag (Fig. 2C, right panel) antibody. The immunoblot procedure used here is described in Section 3.3.3.
- Store purified proteins for up to 2 months at 4°C in buffer A or 6 months at −80°C in buffer A supplemented with 20% (v/v) glycerol.
- His6-Neon-Flag-ALOD4 is prone to degradation. Storage at −80°C in buffer A supplemented with 20% (v/v) glycerol is recommended. Thaw protein aliquots on ice before use.
- See Section 5 for the SREBP2 processing assay, which is performed with every batch of purified ALOD4 proteins to determine protein activity.
Fig. 2.
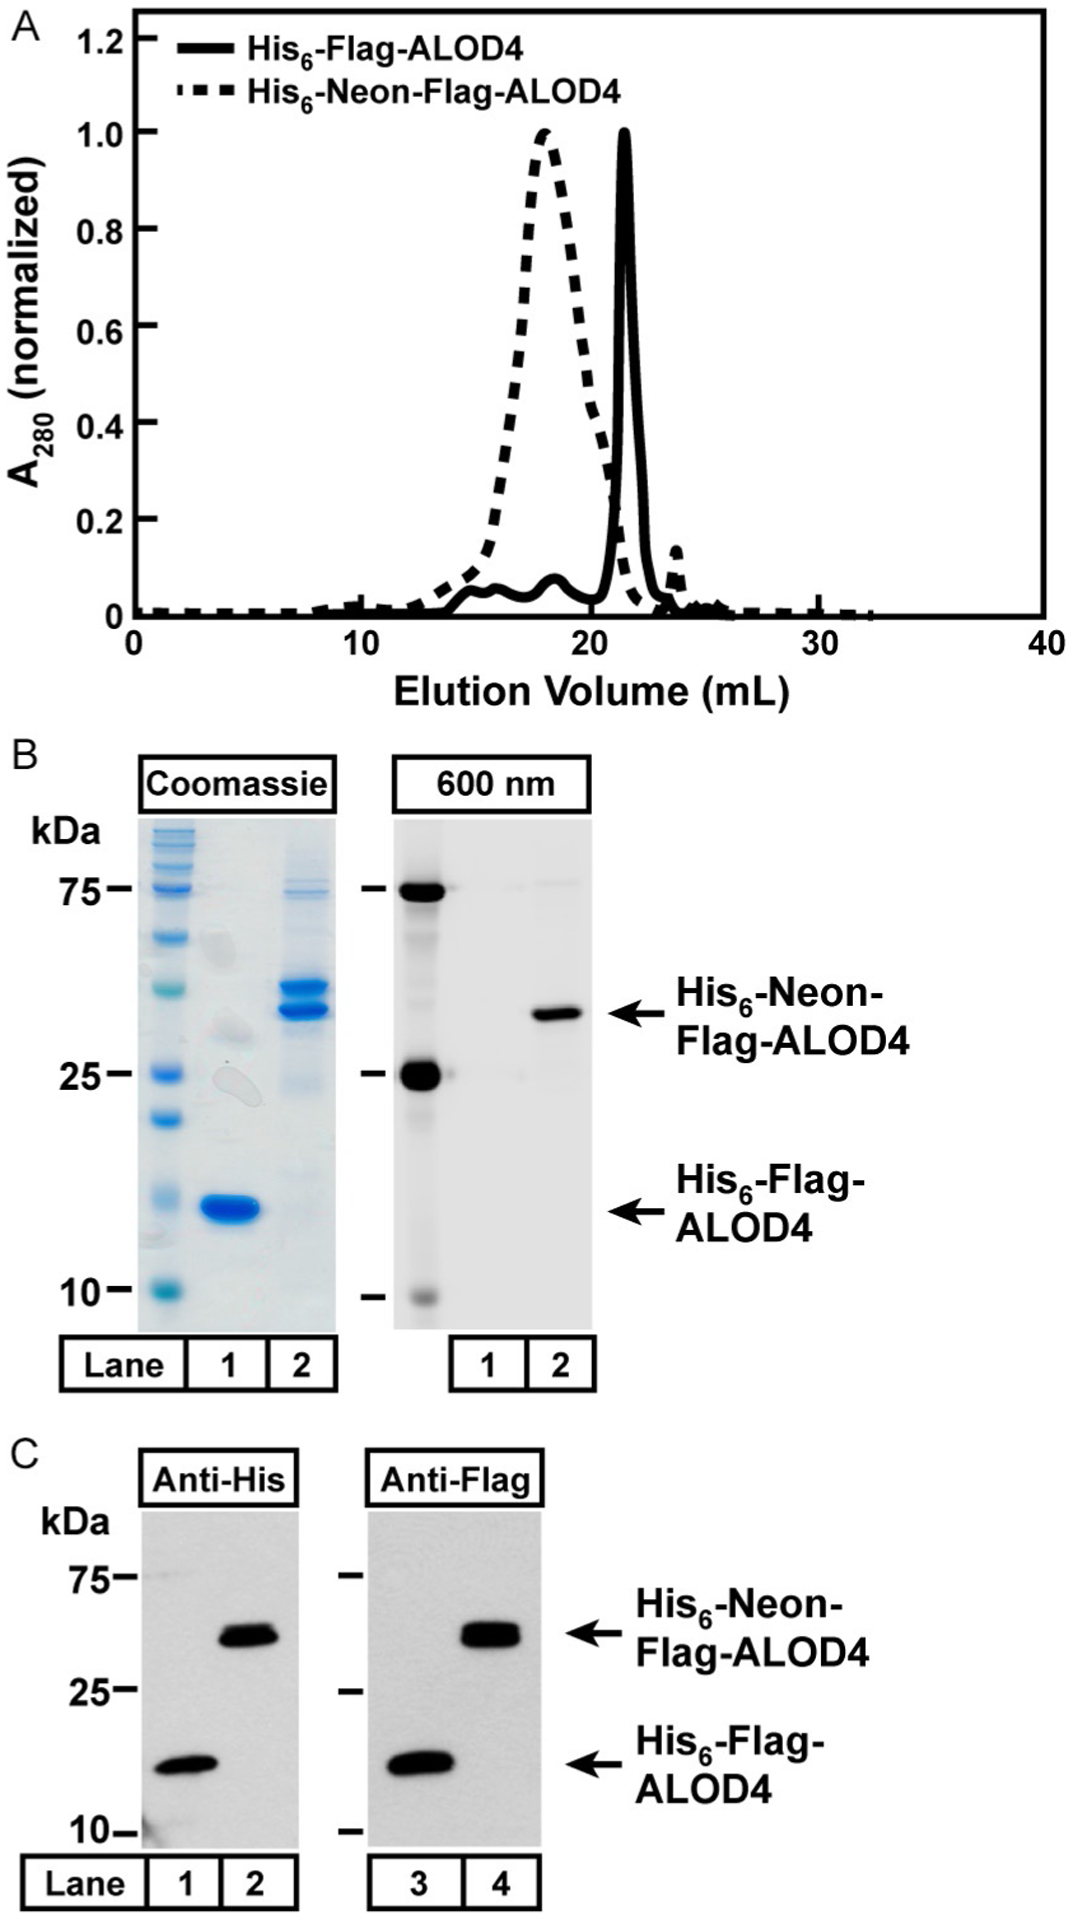
Purification of recombinant cholesterol binding toxins. (A) Representative Superdex 200 SEC profiles of purified recombinant His6-Flag-ALOD4 (solid line) and His6-Neon-Flag-ALOD4 (dashed line). The maximum values for the absorbance at 280 nm for each protein are normalized to 1 to allow for comparison of the two profiles. (B) 2 μg of purified His6-Flag-ALOD4 (lane 1) or His6-Neon-Flag-ALOD4 (lane 2) were subjected to 15% SDS PAGE, followed by Coomassie staining (left panel) or fluorescence imaging with a 600 nm filter on a LICOR imager (right panel). (C) 20 ng of purified His6-Flag-ALOD4 (lane 1) and His6-Neon-Flag-ALOD4 (lane 2) were subjected to 15% SDS PAGE, followed by immunoblot analysis with anti-His (left panel) or anti-Flag (right panel) antibodies.
3. Using toxins as cholesterol sensors on live cells
3.1. Background
Most of the total cellular cholesterol is localized in the PM. Within the PM, cholesterol is organized into three distinct pools (Das et al., 2014). Two of these pools of cholesterol are inaccessible due to (i) interactions with SM, or (ii) interactions with other membrane factors including gly-cerophospholipids containing phosphatidylcholine headgroups (Moe & Heuck, 2010). PM cholesterol in excess of these two pools constitutes a third pool that is accessible and can be transported to the ER to shut down cholesterol synthesis and uptake (see Section 5). In this section, methods to detect changes in accessible cholesterol with ALOD4 and SM-sequestered cholesterol with OlyA are described (Fig. 3). Degradation of SM in the PM using a bacterial sphingomyelinase (SMase) liberates cholesterol from the SM-sequestered pool, leading to an increase in accessible cholesterol levels as detected by ALOD4 and a decrease in SM-sequestered cholesterol levels as detected by OlyA (Fig. 3A). Accessible cholesterol can be depleted from PMs using low concentrations of hydroxypropyl-beta cyclodextrin (HPCD), SM-sequestered cholesterol can also be depleted, but require higher HPCD concentrations (Fig. 3A).
Fig. 3.
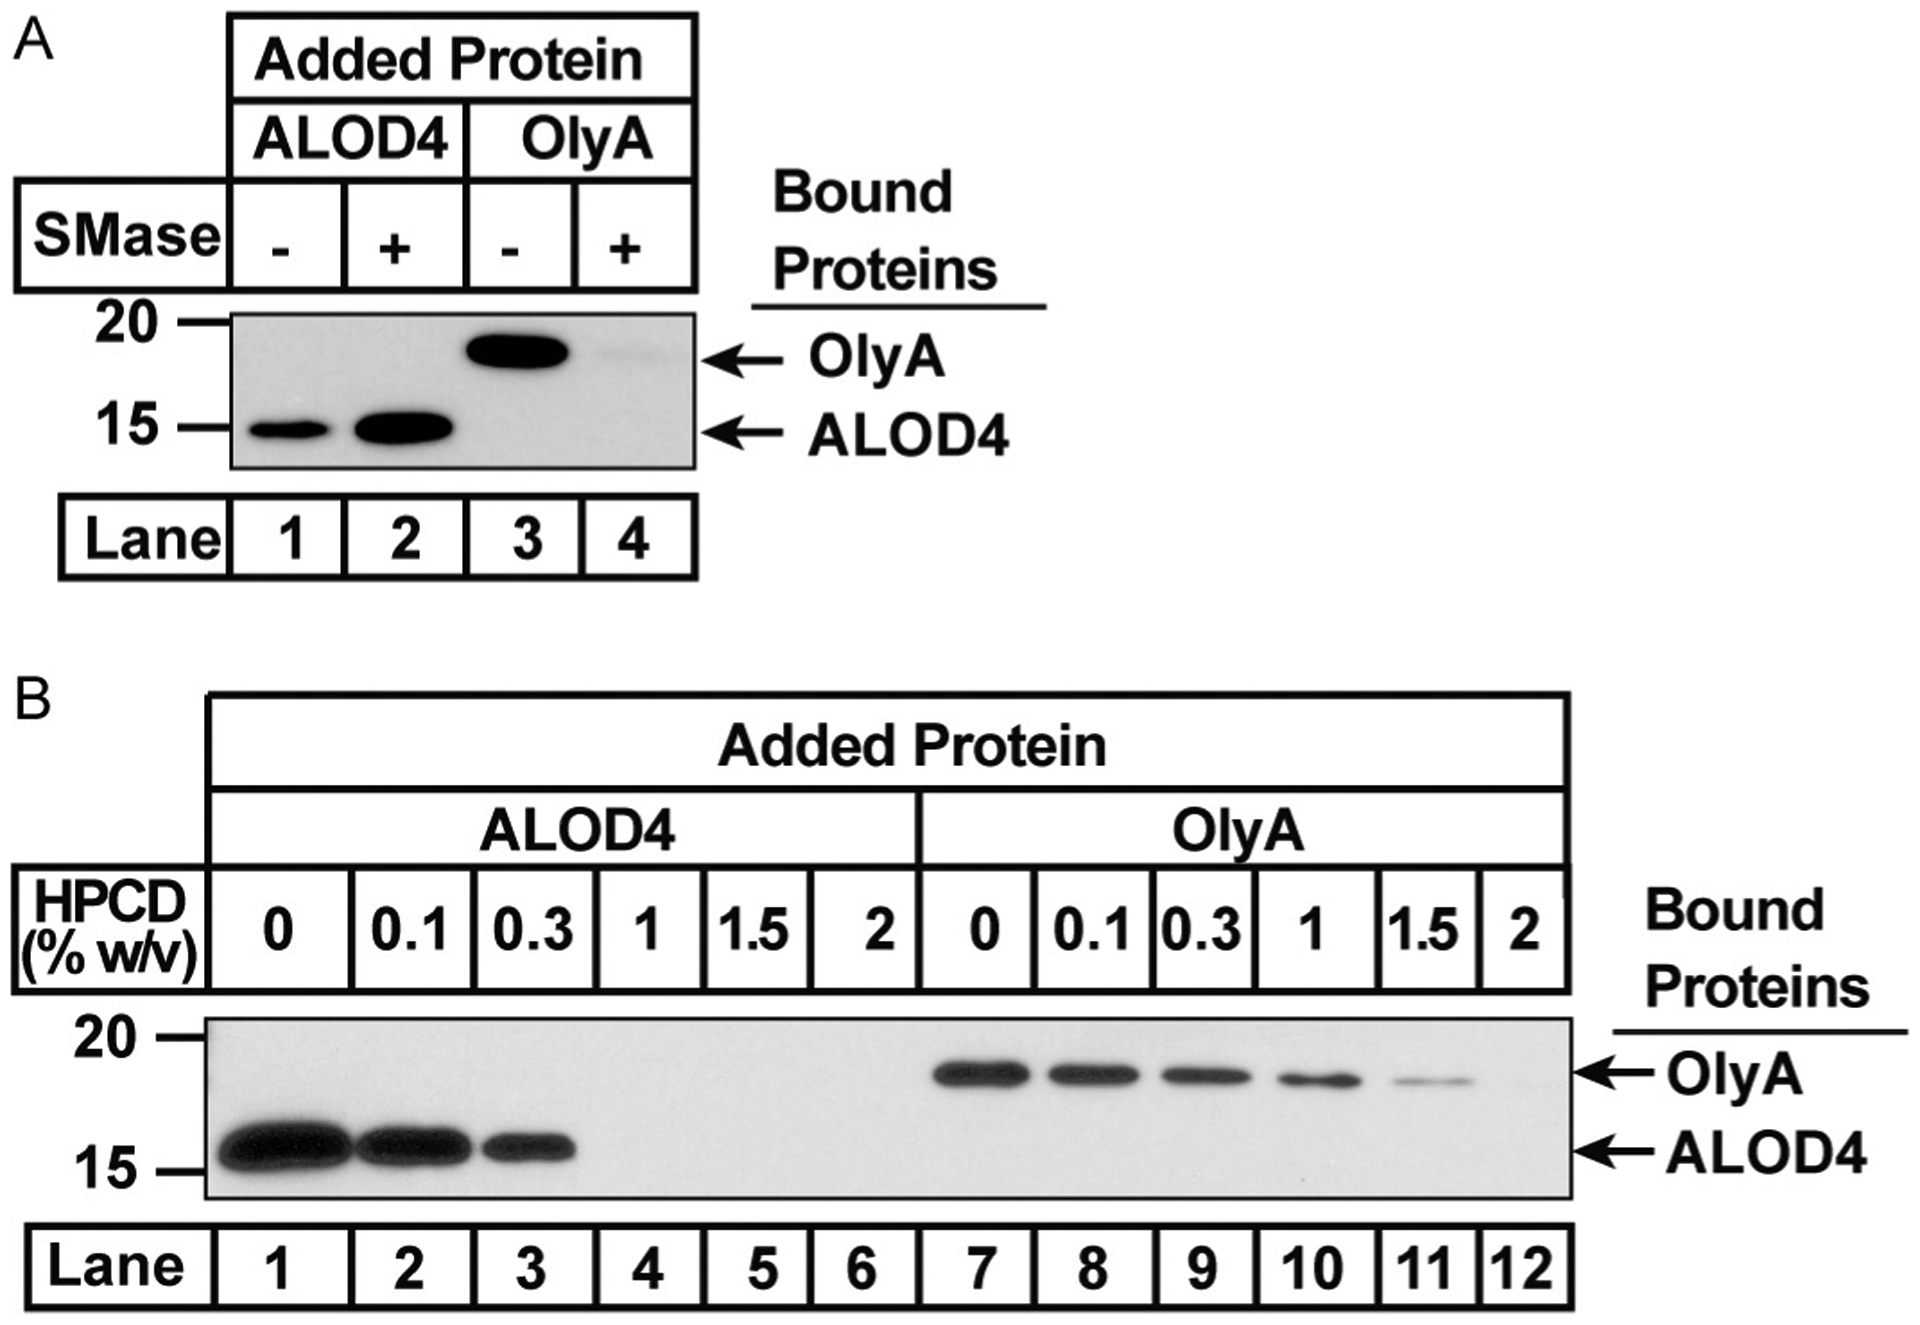
ALOD4 and OlyA detect different cholesterol pools in PM. On day 0, CHOK1 were set up in medium A at a density of 6 × 10⁴ cells per well of a 48 well plate. (A) On day 1, cells were washed twice with 500 μL PBS, then treated with 200 μL of medium A (without SMase) or sphingomyelin-depleting medium B (with SMase). After incubation for 30 min at 37°C, media was removed, cells were washed twice with PBS, then treated with 200 μL medium A containing either 3 μM His6-ALOD4 (lanes 1, 2) or 3 μM OlyA-His6 (lanes 3, 4). (B) On day 1, cells were washed twice with 500 μL PBS then treated with either 200 μL medium A or medium A supplemented with cholesterol-depleting medium C to produce the indicated concentration of HPCD. After incubation for 1h at 37°C, media was removed, cells were washed twice with 500 μL PBS then treated with 200 μL medium A containing either 3 μM His6-ALOD4 (lanes 1–6) or 3 μM OlyA-His6 (lanes 7–12). (A and B) After incubation with ALOD4 or OlyA for 1h at 37°C, cells were washed twice with 500 μL PBS, then harvested in 200 μL buffer C. Equal aliquots of each cell lysate (10% of total) was subjected to immunoblot analysis as described in Section 3.3.
3.2. Materials
Purified ALOD4 and OlyA proteins (see Section 2 and Endapally, Frias, et al., 2019; Endapally, Infante, et al., 2019). Similar results are obtained with all versions of ALOD4 described in Section 2.1, list 1 (also see Section 5).
Medium A, 1:1 mixture of Dulbecco’s modified Eagle’s medium (DMEM) and Ham’s F12 medium supplemented with 100 units/mL penicillin, 100 μg/mL streptomycin sulfate (1% (v/v) P/S), and 5% (v/v) fetal calf serum (FCS). Warm to 37°C prior to use.
Medium B, sphingomyelin-depleting medium, medium A supplemented with 100 mU/mL SMase (SMase, Sigma, Cat # S8633). Warm to 37°C prior to use.
Medium C, cholesterol-depleting medium, medium A supplemented with 2% (w/v) HPCD. Warm to 37°C prior to use.
Dulbecco’s phosphate-buffered saline (PBS)
Buffer C, 10 mM Tris–HCl (pH 6.8), 100 mM NaCl, 1% (w/v) SDS, 1 mM, EDTA, 1 mM EGTA, 20 μg/mL PMSF and protease inhibitors (1 tablet per 20 mL; Roche). Warm to room temperature (RT, 20–22°C) before use.
5 × SDS loading buffer, 10% (w/v) SDS, 10 mM β-mercaptoethanol, 20% (v/v) glycerol, 0.2 M Tris–HCl, pH6.8, 0.05% (w/v) bromophenol blue
15% SDS/PAGE gels
1 × SDS/PAGE running buffer, Tris/Glycine/SDS buffer (TGS), BioRad Cat #1610772
1 × Transfer buffer (4°C) from Trans-Blot Turbo 5 × transfer buffer, BioRad, Cat #10026938
Phosphate buffered saline (pH 7.4) supplemented with 0.05% (w/v) TWEEN 20 (PBST), Millipore Sigma, Cat #P3563
5% (w/v) milk in PBST
Anti-His antibody, Millipore, cat # 05-949, use 1:1000 dilution
Anti-mouse IgG, JacksonResearch, cat # 715-035-150, use 1:5000 dilution
SuperSignal West Pico PLUS Chemiluminescent Substrate, Thermo-Fisher Scientific, cat # 34580
3.3. Protocols
3.3.1. Sphingomyelin depletion protocol
On day 0, CHOK1 cells were set up in medium A at a density of 6 × 10⁴ cells per well of a 48 well plate.
On day 1, media was removed, cells were washed twice with 500 μL PBS, then treated with 200 μL of either medium A (without SMase) or sphingomyelin-depleting medium B (with SMase).
After incubation for 30 min at 37°C, cells were washed twice with PBS, then treated with 200 μL medium A containing either 3 μM ALOD4 or 3 μM OlyA.
After incubation for 1h at 37°C, cells were washed twice with 500 μL PBS, then harvested with 200 μL buffer C. Cell lysates were mixed with SDS loading buffer, 10% of each cell lysate was subjected to 15% SDS/PAGE followed by immunoblot analysis as described below.
Fig. 3A shows that SMase treatment of CHOK1 cells increases PM binding of ALOD4 (lanes 1, 2) while decreasing the PM binding of OlyA (lanes 3, 4).
3.3.2. Cholesterol depletion protocol
On day 0, CHOK1 cells were set up in medium A at a density of 6 × 10⁴ cells per well of a 48-well plate.
On day 1, media was removed, cells were washed twice with 500 μL PBS, then treated for 1h with either 200 μL cholesterol-depleting medium C or a mixture of medium A and C to achieve the indicated concentration of HPCD (0%, 0.1%, 0.3%, 1%, 1.5%, or 2% (w/v)). This HPCD treatment did not result in any significant cell death, as judged by normal cell morphology and the lack of any significant rounding up or loss of cells from the plate.
After incubation for 1h at 37°C as described above, cells were washed twice with 500 μL PBS and then treated with 200 μL medium A containing either 3 μM ALOD4 or 3 μM OlyA.
After incubation for 1h at 37°C, cells were washed twice with PBS then lysed with 200 μL buffer C. Cell lysates were mixed with SDS loading buffer, 10% of each cell lysate was subjected to 15% SDS/PAGE followed by immunoblot analysis as described below.
Fig. 3B shows that HPCD treatment of CHOK1 cells decreases PM binding of both ALOD4 (lanes 1–6) and OlyA (lanes 7–12), although with different sensitivities.
3.3.3. Immunoblot protocol
Proteins were transferred from electrophoresed gels onto nitrocellulose membranes using a BioRad Trans-Blot Turbo apparatus (2.5 A, 25V for 10 min).
Membranes were blocked for 1h at RT in 5% (w/v) milk in PBST.
To detect bound ALOD4 or OlyA, membranes were incubated with primary antibody (anti-His, 1:1000 dilution) in 5% (w/v) milk in PBST either overnight at 4°C on an orbital shaker or for 1h at room temperature on an orbital shaker.
Primary antibody was removed, and membranes were washed with PBST for 8 min. The wash step was repeated two additional times.
Membranes were then incubated with secondary antibody (anti-mouse, 1:5000 dilution) in 5% (w/v) milk in PBST.
After incubation for 30 min at RT, secondary antibody was removed and membranes were washed with PBST for 8 min, three times as described above.
Bound antibodies were visualized by chemiluminescence. The signal was developed by addition of SuperSignal Chemiluminescent substrate for 5 min. Membranes were then exposed to film for 1–30s, a Western blot imager such as a LICOR could also be used.
4. Using toxins to visualize cholesterol accessibility on PM
4.1. Background
While the analysis described in Section 3 captures overall changes in cholesterol pools, recent work has illuminated differences in the distribution of accessible and SM-sequestered cholesterol within PM. When fluorescently-labeled ALOD4 and OlyA were added to live cells, the overall binding patterns were largely distinct but also showed some regions of overlap (Johnson et al., 2019; Johnson & Radhakrishnan, 2020). Over the course of a few minutes, some of the bound OlyA was internalized while ALOD4 remained bound to the surface. In contrast to SM-sequestered cholesterol, which may recycle through endocytic pathways, accessible cholesterol relies on transport proteins to move from PM to ER where it performs regulatory signaling duties. Cholesterol transport proteins such as GramD/AsterB are enriched at PM-ER contact sites and are required for accessible cholesterol transport from PM to ER (Naito et al., 2019; Sandhu et al., 2018). Visualization of accessible and SM-sequestered pools of cholesterol could also shed light on how these cholesterol pools regulate Hedgehog signaling (Kinnebrew et al., 2019) and allow for cell-to-cell spread of pathogenic bacteria such as Listera monocytogenes (Abrams, Johnson, Perelman, et al., 2020; Abrams, Johnson, Radhakrishnan, & Alto, 2020). In this section, we describe the use of a new fluorescent version of ALOD4, His6-Neon-Flag-ALOD4, to visualize accessible cholesterol on PM of cells.
4.2. Materials
Fluorescent versions of ALOD4 where Neon, a monomeric fluorescent protein, is fused to ALOD4 (His6-Neon-Flag-ALOD4) or where the lone cysteine of ALOD4 (His6-ALOD4 or His6-Flag-ALOD4) is labeled with Alexa Fluor or equivalent fluorescent maleimide reagents and non-fluorescent versions of ALOD4 (His6-ALOD4 or His6-Flag-ALOD4) (see Section 2 for details of protein constructs). Fluorescent versions of OlyA-His6 can also be generated by labeling its lone cysteine with an Alexa Fluor or equivalent fluorescent maleimide reagent. The various fluorescent versions of ALOD4 and OlyA can be used individually or in combination.
Nunc Lab-Tek II chambered cover glass 8-well dish No. 1.5 glass (8-well imaging plate), Thermo Fisher Scientific, Cat # 12-565-338, or equivalent glass bottom dish suitable for imaging.
Medium A, 1:1 mixture of DMEM and Ham’s F12 supplemented with 100 units/mL penicillin and 100 μg/mL streptomycin sulfate and 5% (v/v) fetal calf serum (FCS). Warm to 37°C prior to use.
Medium B, medium A supplemented with 2% (w/v) HPCD. Warm to 37°C prior to use.
Dulbecco’s phosphate-buffered saline (PBS), Sigma, Cat # D8537
Buffer D, 4% paraformaldehyde solution in PBS, Alfa Aesar through Fisher Scientific, Cat # AAJ61899AK
Buffer E, 2% (w/v) bovine serum albumin (BSA) in PBS solution, sterile filtered through 0.22 μm filter before use. Lyophilized BSA is available from Sigma-Aldrich, Cat # A6003.
Anti-His antibody, Millipore, Cat # 05-949, use 1:500 dilution
Anti-Flag M2 antibody, Sigma-Aldrich, Cat # F1804, use 1:500 dilution
Goat anti-mouse-Alexa Fluor 594 secondary antibody, Thermo Fisher, Cat # A-21235, use 1:400 dilution
4′,6-diamidino-2-phenylindole (DAPI), 5000 × (5 mg/mL) stock solution in water, treat with 1 μg/mL, Millipore Sigma, Cat # 5087410001
Microscope for visualization such as a Nikon Eclipse Ti, Nikon
4.3. Protocols
4.3.1. Protocol using His6-Neon-Flag-ALOD4 to visualize accessible cholesterol on PM
On day 0, CHOK1 cells were set up in medium A at a density of 2 × 10⁴ cells/well of an 8-well imaging plate.
On day 1, media was removed, cells were washed twice with 500 μL PBS, then treated with 200 μL lipoprotein-rich medium A or 200 μL cholesterol-depleting medium B.
After incubation for 1h, cells were washed twice with 500 μL PBS, then treated with 200 μL medium A containing either 3 μM His6-Neon-Flag-ALOD4 or 3 μM His6-Neon-Flag-ALOD4 (Mut).
After incubation for 15 min, cells were washed twice with PBS and fixed by addition of 200 μL buffer D for 15 min.
After fixation, cells were washed 5 times with 500 μL PBS then treated with 500 μL buffer E on an orbital shaker.
After 30 min, blocking buffer was replaced with 500 μL buffer E containing 1 μg/mL DAPI.
- After 1h, cells were washed 5 times with PBS, postfixed with buffer D, then imaged to visualize bound His6-Neon-Flag-ALOD4.
- Representative images are shown for His6-Neon-Flag-ALOD4 binding to CHOK1 cells (Fig. 4A). When cells are incubated with lipoprotein-rich FCS, His6-Neon-Flag-ALOD4 binds robustly to the PM of cells. When cellular cholesterol is depleted with HPCD, binding is lost. His6-Neon-Flag-ALOD4 (Mut) does not bind to cells under either condition (Fig. 4A).
- Additional information on preparing and using Alexa Fluor labeled ALOD4 and OlyA is available in previous publications (Endapally, Infante, et al., 2019; Johnson et al., 2019; Kinnebrew et al., 2019).
Fig. 4.
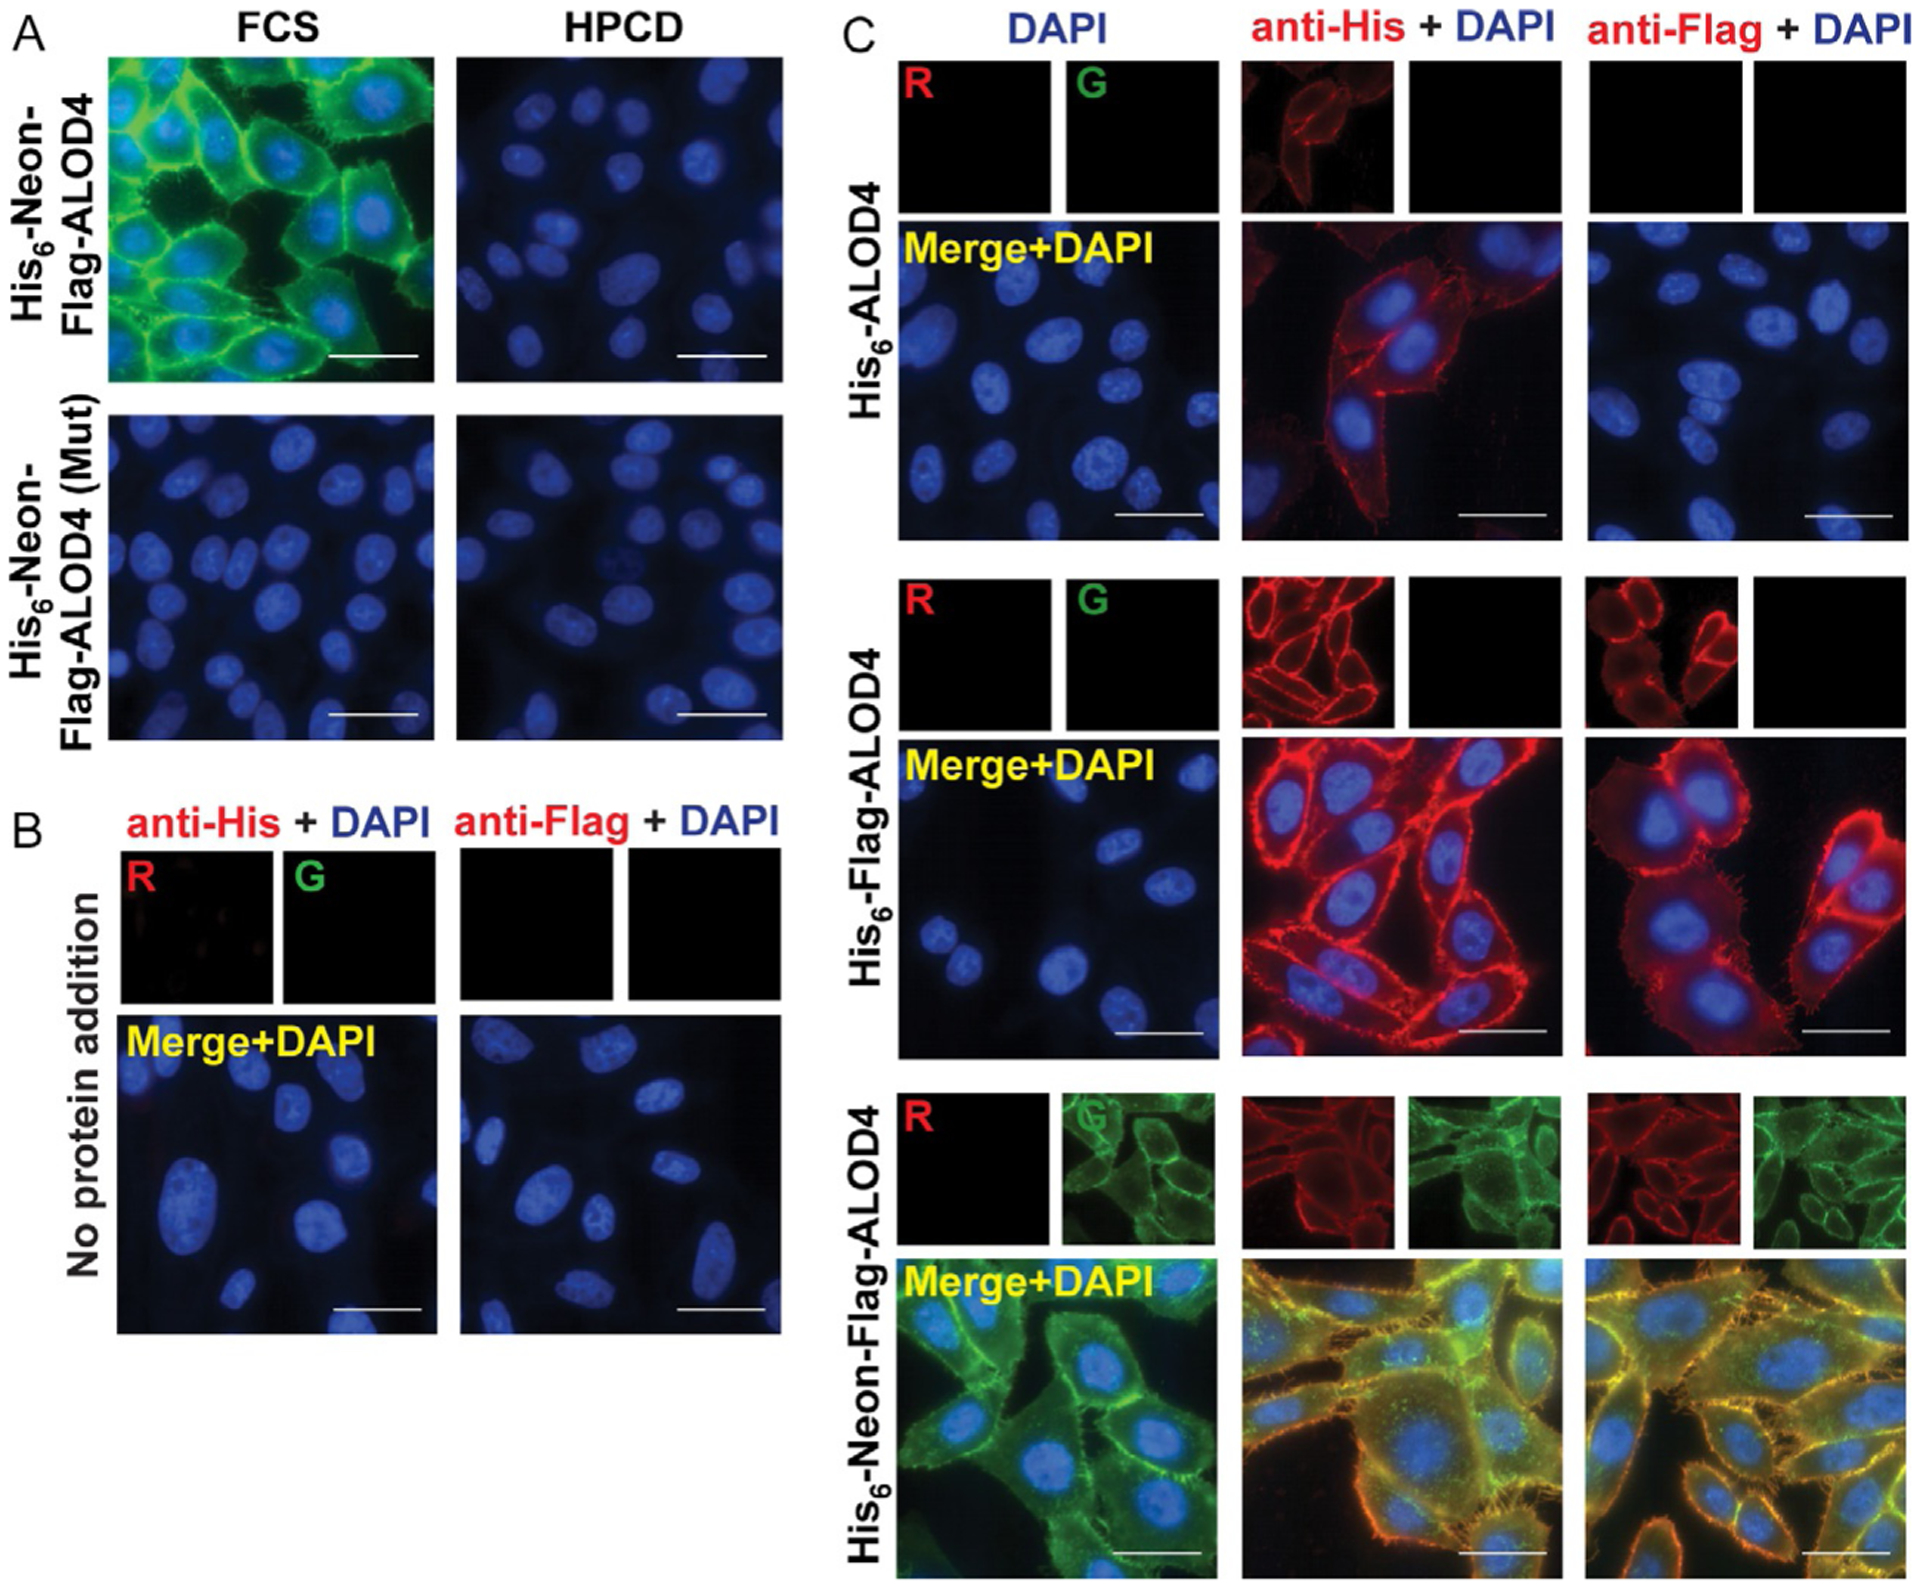
Visualizing PM accessible cholesterol with fluorescent ALOD4. On day 0, CHOK1 cells were set up in medium A at a density of 2 × 10⁴ cells per well of an 8-well glass bottom MatTeck imaging plate. (A) On day 1, cells were washed twice with 500 μL PBS then treated with 200 μL of either lipoprotein-rich medium A or cholesterol-depleting medium B. After 1h at 37°C, cells were washed twice with 500 μL PBS, then treated with 200 μL medium A supplemented with either 3 μM His6-Neon-Flag-ALOD4 or His6-Neon-Flag-ALOD4 (Mut). After 15 min at RT, cells were washed twice with 500 μL PBS, then fixed with 200 μL buffer D. After incubation for 15 min at RT, cells were washed five times with PBS and then treated with 500 μL blocking buffer E for 30 min. Cells were then treated with 500 μL buffer E containing 1 μg/mL DAPI. After incubation for 1h at RT, cells were washed five times with PBS, post-fixed with buffer D, then imaged with a Nikon Eclipse microscope. Scale bars are 20 μm. (B and C) On day 1, cells were washed twice with 500 μL PBS then treated with 200 μL of either medium A (B) or medium A supplemented with 3 μM of either His6-ALOD4, His6-Flag-ALOD4, or His6-Neon-Flag-ALOD4 (C). After incubation for 15 min at RT, cells were washed twice with 500 μL PBS, then fixed with 200 μL buffer D. After incubation for 15 min at RT, cells were washed five times with PBS, then treated with 500 μL buffer E. After incubation for 30 min at RT, buffer E was removed and replaced with 200 μL buffer E (C, left panel) or buffer E containing 1:1000 of either anti-His (B, left panel; C, center panel) or anti-Flag (B and C, right panel) antibodies. After incubation for 1h at RT, cells were washed six times with 500 μL PBS (5 min per wash), then treated with 200 μL buffer E containing 1:400 goat anti-mouse-594 secondary antibody and 1 μg/mL DAPI. After incubation for 1h at RT, cells were washed six times with 500 μL PBS (5 min per wash), then post-fixed with 200 μL buffer D for 10 min at RT, then washed five times with PBS. Cells were imaged with a Nikon Eclipse microscope. Scale bars are 20 μm.
4.3.2. Immunofluorescence protocol to visualize binding of fluorescent and non-fluorescent versions of ALOD4 to PMs
On day 0, CHOK1 cells were set up in medium A at a density of 2 × 10⁴ cells/well of an 8-well imaging plate.
On day 1, media was removed, and cells were washed twice with 500 μL PBS, then treated with 200 μL medium A containing 3 μM of His6-ALOD4, His6-Flag-ALOD4, or His6-Neon-Flag-ALOD4.
After incubation for 15 min, cells were washed twice with 500 μL PBS and fixed by addition of 200 μL buffer D for 15 min.
After fixation, cells were washed 5 times with 500 μL PBS then treated with 500 μL buffer E and placed on an orbital shaker (50rpm).
After 30 min, buffer E was removed and replaced with 200 μL buffer E supplemented with either anti-His (1:1000 dilution) or anti-Flag (1:1000 dilution).
After incubation for 1h, cells were washed by incubation with 500 μL PBS for 5 min. This wash step was repeated 5 additional times.
After washing, cells were treated with 200 μL buffer E supplemented with 1:400 goat anti-mouse-Alexa Fluor 647 secondary antibody and 1 μg/mL DAPI.
After incubation for 1h, cells were washed by incubation with 500 μL PBS for 5 min. The wash step was repeated 5 additional times, and the cells were then post-fixed with 200 μL buffer D for 10 m, followed by 5 washes with PBS.
- Cells were imaged to visualize bound ALOD4 as shown in Fig. 4B and C. When using immunofluorescence, it is important to include untreated samples to determine background signal of the antibodies used. Fig. 4B shows CHOK1 cells in the absence of ALOD4 addition after the complete immunofluorescence protocol with either anti-His (left panel) or anti-Flag (right panel) to confirm specificity of signal observed. Fig. 4C shows Neon (left panel), anti-His (middle panel), or anti-Flag (right panel) fluorescence signal after treatment with 3 μM His6-ALOD4 (top row), His6-Flag-ALOD4 (center row), or His6-Neon-Flag-ALOD4 (bottom row).
- This protocol can also be used to detect OlyA-His6 bound to cells.
5. Using toxins to study cholesterol sensing and transport
5.1. Background
Animal cells carefully regulate their cholesterol content. To enable such regulation, cells must measure cholesterol levels in their membranes. If the level is too low, cholesterol synthesis and uptake are initiated. If the level is too high, synthesis and uptake are terminated. These opposite outcomes are triggered by the actions of a sensor protein called Scap that resides in the ER membrane (Brown, Radhakrishnan, & Goldstein, 2018). Scap forms complexes with ER membrane-bound transcription factors called sterol regulatory element-binding proteins (SREBPs), which activate all the genes involved in synthesis of cholesterol and the LDL receptor which acquires exogenous cholesterol from LDL particles. Activation of SREBPs requires their transport by Scap to the Golgi where two proteases release their transcription factor domain that then enter the nucleus for target gene activation. When cholesterol in the ER rises and binds to Scap, it traps SREBPs in the ER, thus preventing proteolytic cleavage and nuclear entry. However, most of the cell’s cholesterol is located in the PM (Das et al., 2014; Lange, Ye, & Steck, 2004). How does the Scap/SREBP regulatory machine in the ER detect changes in PM cholesterol? A solution to this problem lies in the organization of cholesterol in PMs. As described in Section 3, PM cholesterol is organized into three distinct pools (Das et al., 2014). Two of these pools of cholesterol are inaccessible due to interactions with SM or interactions with other membrane factors. PM cholesterol in excess of these two pools constitutes a third pool that is accessible and is transported to the ER to terminate SREBP activation.
While the cholesterol sensing machinery in ER has been well characterized, how the various cholesterol sensing and transport machineries work in concert to maintain cholesterol homeostasis remains unclear. ALOD4 and OlyA are useful tools to study the connection between cholesterol levels in PM and the response of the cholesterol sensing machinery in ER. When ALOD4 binds accessible cholesterol on the outer leaflet of PM, cholesterol transport from PM-to-ER is blocked and ER cholesterol drops below a threshold concentration of 5 mol% of total ER lipids, triggering activation of SREBP transcription factors even though cellular cholesterol has not been diminished (Infante & Radhakrishnan, 2017). In this section, we describe assays to confirm functionality of our new ALOD4 protein constructs by testing whether they trigger SREBP processing.
5.2. Materials
Purified ALOD4 proteins (see Section 2 and Endapally, Infante, et al., 2019)
Medium A, 1:1 mixture of DMEM and Ham’s F12 supplemented with 100 units/mL penicillin and 100 μg/mL streptomycin sulfate (1% (v/v) P/S) and 5% (v/v) fetal calf serum (FCS). Warm to 37°C prior to use.
Dulbecco’s phosphate-buffered saline (PBS)
Buffer C, 10 mM Tris–HCl (pH 6.8), 100 mM NaCl, 1% (w/v) SDS, 1 mM EDTA, 1 mM EGTA, 20 μg/mL PMSF, and protease inhibitors (1 tablet (Roche) per 20 mL). Warm to RT before use.
5 × SDS loading buffer, 10% (w/v) SDS, 10 mM β-mercaptoethanol, 20% (v/v) glycerol, 0.2 M Tris–HCl, pH6.8, 0.05% (w/v) bromophenol blue
15% SDS/PAGE gel and 10% SDS/PAGE gel
1 × SDS/PAGE running buffer, Tris/Glycine/SDS buffer (TGS), BioRad Cat # 1610772
1 × Transfer buffer (4°C) from Trans-Blot Turbo 5 × transfer buffer, BioRad, Cat # 10026938
Phosphate buffered saline (pH 7.4) supplemented with 0.05% (w/v) TWEEN 20 (PBST), Millipore Sigma, Cat # P3563
5% Milk (w/v) in PBST
Anti-His antibody, Millipore, Cat # 05-949, use 1:1000 dilution
Anti-Flag M2 antibody, Sigma-Aldrich, Cat # F1804, use 1:1000 dilution
Anti- β-actin to detect actin, Cell Signaling Technology, Cat# 4970S, 13E5, use 1:1000 dilution
IgG-7D4, antibody to detect SREBP2, one of the three isoforms of SREBP, commercially available from ATCC CRL-2198, use 10 μg/mL dilution
Anti-rabbit IgG, JacksonResearch, Cat # 111-035-003, use 1:5000 dilution
Anti-mouse IgG, JacksonResearch, Cat # 715-035-150, use 1:5000 dilution
SuperSignal West Pico PLUS Chemiluminescent Substrate, Thermo-Fisher Scientific, Cat # 34580
5.3. Protocol
On day 0, CHOK1 cells were set up in medium A at a density of 6 × 10⁴ cells per well of a 48 well plate.
On day 1, cells were washed twice with PBS then treated with the indicated concentration of ALOD4 in medium A.
After incubation for 1h at 37°C, media was removed, cells were washed twice with 500 μL PBS, and harvested by addition of 200 μL buffer C. Cell lysates were mixed with SDS loading buffer, 10% of each cell lysate was subjected to 15% SDS/PAGE followed by immunoblot analysis described below.
10% of each cell lysate sample was subjected to either 10% SDS/PAGE or 15% SDS/PAGE followed by immunoblot analysis for SREBP2 and bound ALOD4, respectively.
- The immunoblot procedure described in Section 3.3.3 was followed.
- Use IgG 7D4 (10 μg/mL) to detect SREBP2, anti-His (1:1000 dilution) or anti-Flag M2 (1:1000 dilution) to detect bound ALOD4, and anti-β-Actin (1:1000 dilution) to detect actin.
Fig. 5 shows results of experiments assaying for the effects of various versions of ALOD4 on trapping accessible cholesterol on PMs and triggering SREBP2 processing. As shown in Fig. 5A, incubation with either His6-ALOD4 (lanes 1–4) or His6-Flag-ALOD4 (lanes 5–8) results in binding of these proteins to the PM and processing of SREBP2 to its activated nuclear form. Fig. 5B shows that His6-Neon-Flag-ALOD4 also binds to the PM and triggers the processing of SREBP2 (lanes 1–4) whereas His6-Neon-Flag-ALOD4 (Mut) shows no binding to PMs and does not trigger the processing of SREBP2 (lanes 5–8).
Fig. 5.
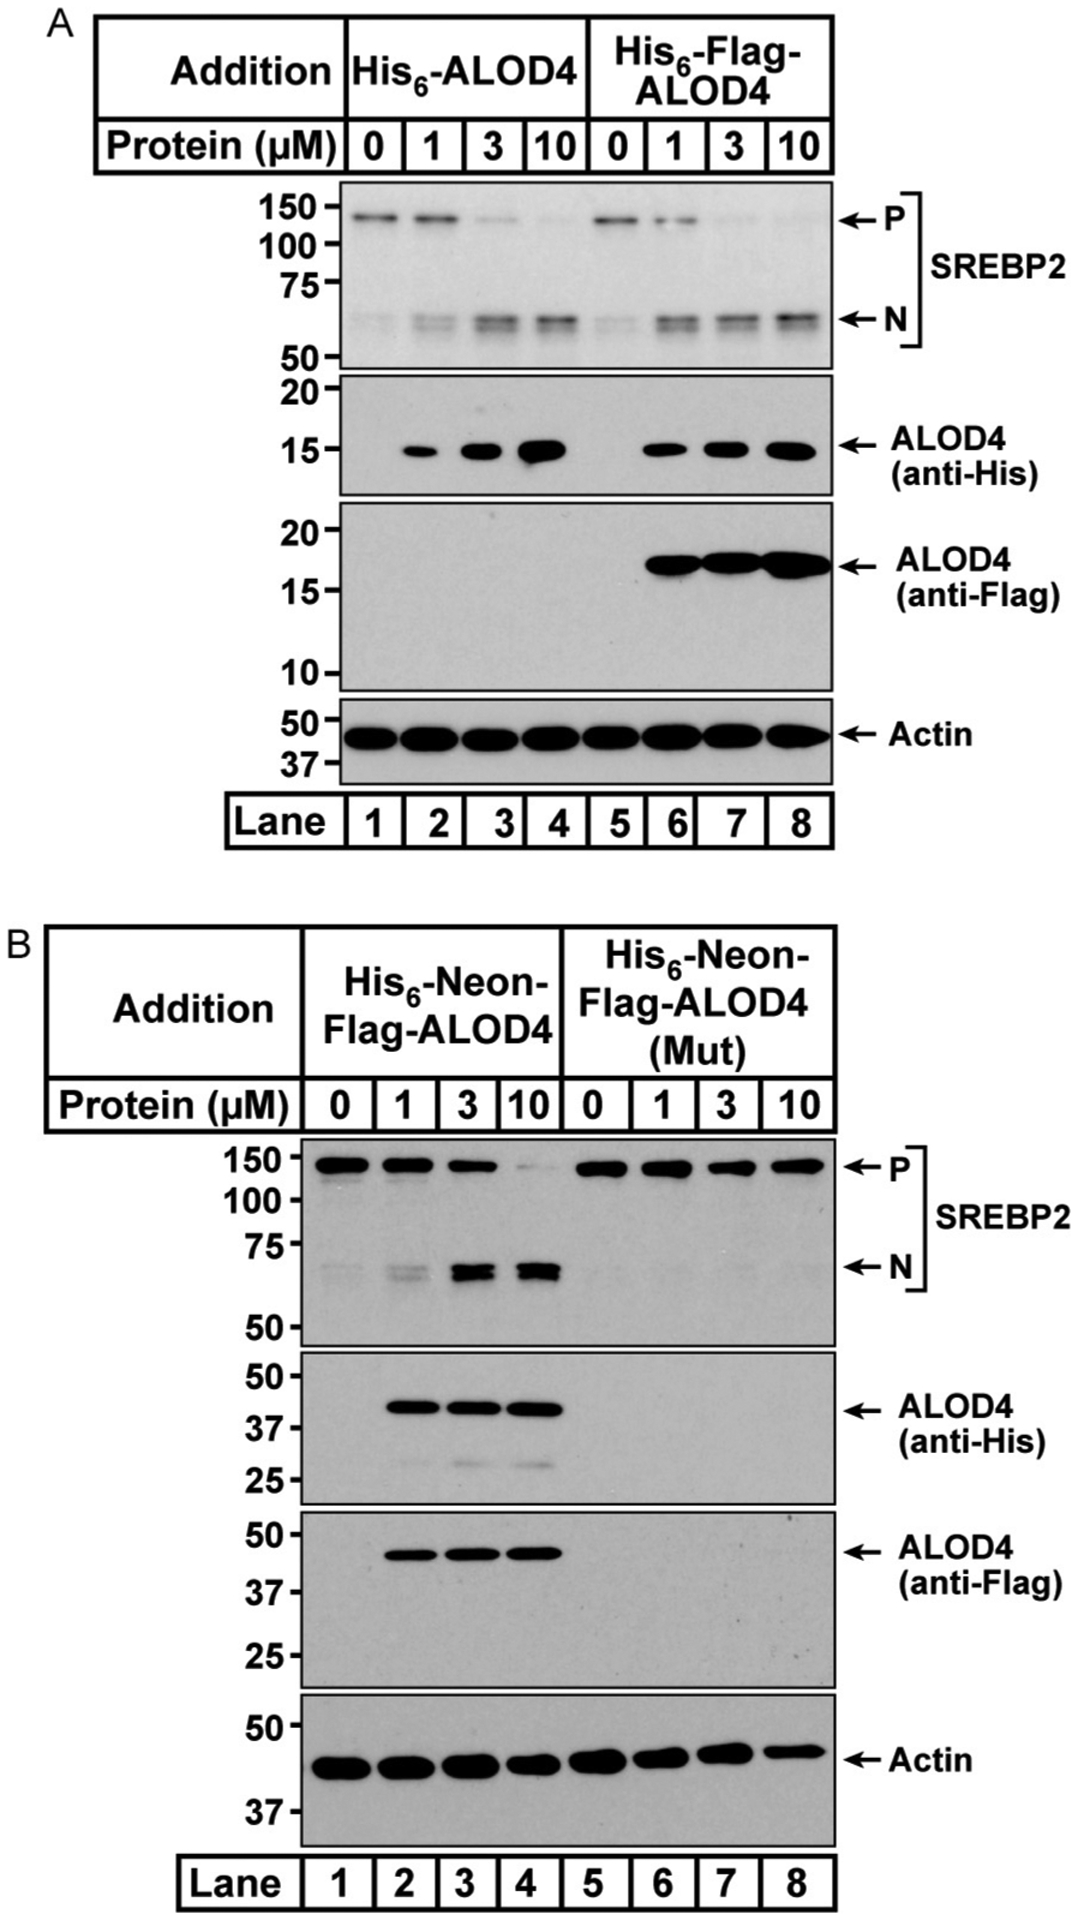
Depletion of ER cholesterol by ALOD4 binding to accessible cholesterol in PM. On day 0, CHOK1 were set up in medium A at a density of 6 × 10⁴ cells per well of a 48 well plate. On day 1, cells were washed twice with 500 μL PBS, then treated with 200 μL medium A supplemented with the indicated concentration of either His6-ALOD4 or His6-Flag-ALOD4 (A) or with either His6-Neon-Flag-ALOD4 or His6-Neon-Flag-ALOD4 (Mut) (B). After incubation for 1h at 37°C, cells were washed twice with 500 μL PBS, then harvested with 200 μL buffer C. 10% of each sample was subjected to immunoblot analysis as described in Section 5. P, precursor form of SREBP2; N, cleaved nuclear form of SREBP2.
6. Summary
Cholesterol dependent cytolysins such as ALOD4 and fungal toxins such as OlyA have been engineered to serve as laboratory tools to detect the level and distribution of cholesterol in animal membranes. These probes have allowed for the determination of three distinct pools of cholesterol in PMs and for elucidating the role of these pools in controlling various signaling processes in cells. While these tools are easy to work with and work robustly in a variety of animal cell types, caution must be used when interpreting results. For example, while ALOD4 and OlyA are excellent sensors for accessible and inaccessible cholesterol (see Section 3), these probes also rapidly inhibit transport of accessible cholesterol from PM to ER, triggering cholesterol uptake and synthesis pathways even though cellular cholesterol levels have not changed (see Section 5 and Infante & Radhakrishnan, 2017; Johnson et al., 2019). This feature of ALOD4 and OlyA binding to PMs can be useful in studying intracellular cholesterol transport; however, it should also not be ignored when using ALOD4 or OlyA as live-cell sensors.
Acknowledgments
We thank Danya Vazquez for excellent technical assistance. K.A.J. is the recipient of a postdoctoral fellowship from the Hartwell Foundation. We are grateful for support from the National Institutes of Health (HL20948), the Welch Foundation (I-1793), and the Leducq Foundation (19CVD04).
References
- Abrams ME, Johnson KA, Perelman SS, Zhang LS, Endapally S, Mar KB, et al. (2020). Oxysterols provide innate immunity to bacterial infection by mobilizing cell surface accessible cholesterol. Nature Microbiology, 5(7), 929–942. 10.1038/s41564-020-0701-5. [DOI] [PMC free article] [PubMed] [Google Scholar]
- Abrams ME, Johnson KA, Radhakrishnan A, & Alto NM (2020). Accessible cholesterol is localized in bacterial plasma membrane protrusions. Journal of Lipid Research, 61, 1538. 10.1194/jlr.ILR120000891. [DOI] [PMC free article] [PubMed] [Google Scholar]
- Anderluh G, & Macek P (2002). Cytolytic peptide and protein toxins from sea anemones (Anthozoa: Actiniaria). Toxicon, 40(2), 111–124. [DOI] [PubMed] [Google Scholar]
- Bernheimer AW, & Avigad LS (1979). A cytolytic protein from the edible mushroom, Pleurotus ostreatus. Biochimica et Biophysica Acta, 585(3), 451–461. [DOI] [PubMed] [Google Scholar]
- Bhat HB, Kishimoto T, Abe M, Makino A, Inaba T, Murate M, et al. (2013). Binding of a pleurotolysin ortholog from Pleurotus eryngii to sphingomyelin and cholesterol-rich membrane domains. Journal of Lipid Research, 54(10), 2933–2943. 10.1194/jlr.D041731. [DOI] [PMC free article] [PubMed] [Google Scholar]
- Bourdeau RW, Malito E, Chenal A, Bishop BL, Musch MW, Villereal ML, et al. (2009). Cellular functions and X-ray structure of anthrolysin O, a cholesterol-dependent cytolysin secreted by bacillus anthracis. The Journal of Biological Chemistry, 284(21), 14645–14656. 10.1074/jbc.M807631200. [DOI] [PMC free article] [PubMed] [Google Scholar]
- Brown MS, Radhakrishnan A, & Goldstein JL (2018). Retrospective on cholesterol homeostasis: The central role of Scap. Annual Review of Biochemistry, 87, 783–807. 10.1146/annurev-biochem-062917-011852. [DOI] [PMC free article] [PubMed] [Google Scholar]
- Das A, Brown MS, Anderson DD, Goldstein JL, & Radhakrishnan A (2014). Three pools of plasma membrane cholesterol and their relation to cholesterol homeostasis. Elife (Cambridge), 3, e02882. 10.7554/eLife.02882. [DOI] [PMC free article] [PubMed] [Google Scholar]
- Das A, Goldstein JL, Anderson DD, Brown MS, & Radhakrishnan A (2013). Use of mutant 125I-perfringolysin O to probe transport and organization of cholesterol in membranes of animal cells. Proceedings of the National Academy of Sciences of the United States of America, 110(26), 10580–10585. 10.1073/pnas.1309273110. [DOI] [PMC free article] [PubMed] [Google Scholar]
- Endapally S, Frias D, Grzemska M, Gay A, Tomchick DR, & Radhakrishnan A (2019). Molecular discrimination between two conformations of Sphingomyelin in plasma membranes. Cell, 176(5), 1040–1053.e1017. 10.1016/j.cell.2018.12.042. [DOI] [PMC free article] [PubMed] [Google Scholar]
- Endapally S, Infante RE, & Radhakrishnan A (2019). Monitoring and modulating intracellular cholesterol trafficking using ALOD4, a cholesterol-binding protein. Methods in Molecular Biology, 1949, 153–163. 10.1007/978-1-4939-9136-5_12. [DOI] [PMC free article] [PubMed] [Google Scholar]
- Gay A, Rye D, & Radhakrishnan A (2015). Switch-like responses of two cholesterol sensors do not require protein oligomerization in membranes. Biophysical Journal, 108(6), 1459–1469. 10.1016/j.bpj.2015.02.008. [DOI] [PMC free article] [PubMed] [Google Scholar]
- He C, Hu X, Jung RS, Weston TA, Sandoval NP, Tontonoz P, et al. (2017). High-resolution imaging and quantification of plasma membrane cholesterol by NanoSIMS. Proceedings of the National Academy of Sciences of the United States of America, 114(8), 2000–2005. 10.1073/pnas.1621432114. [DOI] [PMC free article] [PubMed] [Google Scholar]
- Heuck AP, Moe PC, & Johnson BB (2010). The cholesterol-dependent cytolysin family of gram-positive bacterial toxins. Sub-Cellular Biochemistry, 51, 551–577. 10.1007/978-90-481-8622-8_20. [DOI] [PubMed] [Google Scholar]
- Infante RE, & Radhakrishnan A (2017). Continuous transport of a small fraction of plasma membrane cholesterol to endoplasmic reticulum regulates total cellular cholesterol. Elife (Cambridge), 6, e25466. 10.7554/eLife.25466. [DOI] [PMC free article] [PubMed] [Google Scholar]
- Johnson KA, Endapally S, Vazquez DC, Infante RE, & Radhakrishnan A (2019). Ostreolysin a and anthrolysin O use different mechanisms to control movement of cholesterol from the plasma membrane to the endoplasmic reticulum. The Journal of Biological Chemistry, 294(46), 17289–17300. 10.1074/jbc.RA119.010393. [DOI] [PMC free article] [PubMed] [Google Scholar]
- Johnson KA, & Radhakrishnan A (2020). Accessibility of cholesterol at cell surfaces. Journal of Lipid Research, 61, 1307. 10.1194/jlr.ILR120000836. [DOI] [PMC free article] [PubMed] [Google Scholar]
- Kinnebrew M, Iverson EJ, Patel BB, Pusapati GV, Kong JH, Johnson KA, et al. (2019). Cholesterol accessibility at the ciliary membrane controls hedgehog signaling. Elife (Cambridge), 8, e50051. 10.7554/eLife.50051. [DOI] [PMC free article] [PubMed] [Google Scholar]
- Lange Y, Ye J, & Steck TL (2004). How cholesterol homeostasis is regulated by plasma membrane cholesterol in excess of phospholipids. Proceedings of the National Academy of Sciences of the United States of America, 101(32), 11664–11667. 10.1073/pnas.0404766101. [DOI] [PMC free article] [PubMed] [Google Scholar]
- Lukoyanova N, Kondos SC, Farabella I, Law RH, Reboul CF, Caradoc-Davies TT, et al. (2015). Conformational changes during pore formation by the perforin-related protein pleurotolysin. PLoS Biology, 13(2), e1002049. 10.1371/journal.pbio.1002049. [DOI] [PMC free article] [PubMed] [Google Scholar]
- Makino A, Abe M, Ishitsuka R, Murate M, Kishimoto T, Sakai S, et al. (2017). A novel sphingomyelin/cholesterol domain-specific probe reveals the dynamics of the membrane domains during virus release and in Niemann-pick type C. The FASEB Journal, 31(4), 1301–1322. 10.1096/fj.201500075R. [DOI] [PubMed] [Google Scholar]
- Moe PC, & Heuck AP (2010). Phospholipid hydrolysis caused by Clostridium perfringens alpha-toxin facilitates the targeting of perfringolysin O to membrane bilayers. Biochemistry, 49, 9498–9507. [DOI] [PubMed] [Google Scholar]
- Naito T, Ercan B, Krshnan L, Triebl A, Koh DHZ, Wei FY, et al. (2019). Movement of accessible plasma membrane cholesterol by the GRAMD1 lipid transfer protein complex. Elife (Cambridge), 8, e51401. 10.7554/eLife.51401. [DOI] [PMC free article] [PubMed] [Google Scholar]
- Ohno-Iwashita Y, Shimada Y, Hayashi M, Iwamoto M, Iwashita S, & Inomata M (2010). Cholesterol-binding toxins and anti-cholesterol antibodies as structural probes for cholesterol localization. Sub-Cellular Biochemistry, 51, 597–621. 10.1007/978-90-481-8622-8_22. [DOI] [PubMed] [Google Scholar]
- Ourisson G, Rohmer M, & Poralla K (1987). Prokaryotic hopanoids and other polyterpenoid sterol surrogates. Annual Review of Microbiology, 41, 301–333. 10.1146/annurev.mi.41.100187.001505. [DOI] [PubMed] [Google Scholar]
- Radhakrishnan A, Goldstein JL, McDonald JG, & Brown MS (2008). Switch-like control of SREBP-2 transport triggered by small changes in ER cholesterol: A delicate balance. Cell Metabolism, 8(6), 512–521. 10.1016/j.cmet.2008.10.008. [DOI] [PMC free article] [PubMed] [Google Scholar]
- Sandhu J, Li S, Fairall L, Pfisterer SG, Gurnett JE, Xiao X, et al. (2018). Aster proteins facilitate nonvesicular plasma membrane to ER cholesterol transport in mammalian cells. Cell, 175(2), 514–529.e520. 10.1016/j.cell.2018.08.033. [DOI] [PMC free article] [PubMed] [Google Scholar]
- Shaner NC, Lambert GG, Chammas A, Ni Y, Cranfill PJ, Baird MA, et al. (2013). A bright monomeric green fluorescent protein derived from Branchiostoma lanceolatum. Nature Methods, 10(5), 407–409. 10.1038/nmeth.2413. [DOI] [PMC free article] [PubMed] [Google Scholar]
- Skocaj M, Resnik N, Grundner M, Ota K, Rojko N, Hodnik V, et al. (2014). Tracking cholesterol/sphingomyelin-rich membrane domains with the ostreolysin A-mCherry protein. PLoS One, 9(3), e92783. 10.1371/journal.pone.0092783. [DOI] [PMC free article] [PubMed] [Google Scholar]
- Tomita T, Noguchi K, Mimuro H, Ukaji F, Ito K, Sugawara-Tomita N, et al. (2004). Pleurotolysin, a novel sphingomyelin-specific two-component cytolysin from the edible mushroom Pleurotus ostreatus, assembles into a transmembrane pore complex. The Journal of Biological Chemistry, 279(26), 26975–26982. 10.1074/jbc.M402676200. [DOI] [PubMed] [Google Scholar]
- Tweten RK (2005). Cholesterol-dependent cytolysins, a family of versatile pore-forming toxins. Infection and Immunity, 73(10), 6199–6209. 10.1128/iai.73.10.6199-6209.2005. [DOI] [PMC free article] [PubMed] [Google Scholar]
- Wang S, Li W, Hui H, Tiwari SK, Zhang Q, Croker BA, et al. (2020). Cholesterol 25-hydroxylase inhibits SARS-CoV-2 and coronaviruses by depleting membrane cholesterol. EMBO Journal, 39, e2020106057. 10.15252/embj.2020106057. [DOI] [PMC free article] [PubMed] [Google Scholar]
- Yamaji A, Sekizawa Y, Emoto K, Sakuraba H, Inoue K, Kobayashi H, et al. (1998). Lysenin, a novel sphingomyelin-specific binding protein. The Journal of Biological Chemistry, 273(9), 5300–5306. [DOI] [PubMed] [Google Scholar]
- Zhou QD, Chi X, Lee MS, Hsieh WY, Mkrtchyan JJ, Feng A-C, et al. (2020). Interferon-mediated reprogramming of membrane cholesterol to evade bacterial toxins. Nature Immunology, 21(7), 746–755. 10.1038/s41590-020-0695-4. [DOI] [PMC free article] [PubMed] [Google Scholar]