Abstract
Cardiac imaging depends on clear visualization of several different structural and functional components to determine left ventricular and overall cardiac health. Ultrasound imaging is confounded by the characteristic speckle texture resulting from sub-wavelength scatterers in tissues that is similar to a multiplicative noise on underlying tissue structure. Reduction of this texture can be achieved through physical means such as spatial or frequency compounding or through adaptive image processing. Techniques in both categories require a trade-off of resolution for speckle texture reduction, which together contribute to overall image quality and diagnostic value.
We evaluate this trade-off for cardiac imaging tasks using spatial compounding as an exemplary speckle reduction method. Spatial compounding averages the decorrelated speckle patterns formed by views of a target from multiple subaperture positions to reduce the texture at the expense of active aperture size (and in turn lateral resolution). We demonstrate the use of a novel synthetic aperture focusing technique to decompose harmonic backscattered data from focused beams to their aperture domain spatial frequency components to enable combined transmit and receive compounding. This tool allows the evaluation of matched data sets from a single acquisition over a wide range of spatial compounding conditions.
We quantified the trade-off between resolution and texture reduction in an imaging phantom and demonstrated improved lesion detectability with increasing levels of spatial compounding. We performed cardiac ultrasound on 25 subjects to evaluate the degree of compounding useful for diagnostic imaging. Of these, 18 subjects were included for both qualitative and quantitative analysis. We found that compounding improved detectability of the endocardial border according to the generalized contrast-to-noise ratio in all cases and more aggressive compounding made further improvements in 10 out of 18 cases. Three expert reviewers evaluated the images for their usefulness in several diagnostic tasks and ranked four compounding conditions (“None”, “Low”, “Medium”, “High”). Contrary to the quantitative metrics which suggested the use of high levels of compounding, the reviewers determined that “Low” was usually preferred (77.9%), while “None” or “Medium” were selected in 21.2% of cases. We conclude with a brief discussion of the generalization of these results to other speckle reduction methods using the imaging phantom data.
Index Terms—: cardiac imaging, echocardiography, spatial compounding, synthetic aperture, image quality
I. Introduction
Cardiac ultrasound imaging is a valuable tool for real-time analysis of both the structure and function of the heart. Evaluation of the left ventricle (LV) is of particular importance in diagnosing systolic heart failure, including motion of the endocardial border and estimation of ejection fraction [1]. Echocardiography also provides information about valves and the presence of any structural anomalies. These assessments are made difficult by the heterogeneous appearance of the LV wall and chamber due to speckle. Technologies such as harmonic imaging have served to reduce the impact of acoustic clutter [2], but at the expense of signal-to-noise ratio and without any improvements in texture.
Speckle texture is inherent to ultrasound images because it is a result of the interference pattern between sub-wavelength scatterers [3]. The stochastic pattern is temporally stable with spatial correlation similar to the resolution of the imaging system, meaning it can both obscure targets of interest and create the appearance of fine details in the image. This texture confounds both visual detection of targets [4] and spatial measurements made of cardiac structures [5]. Clinical ultrasound systems employ various forms of image and signal processing to reduce the variance of the speckle texture and improve the detectability of targets.
However, a primary consequence of speckle reduction is a loss of image resolution. For some signal processing approaches this loss can be well characterized. In spatial compounding the incoherent combination of images with decorrelated speckle patterns reduces texture variance [6]–[8]. These multiple views of the target are achieved by the electronic shifting of transmit and/or receive subapertures, necessitating a reduced active aperture size and corresponding degraded lateral resolution. Some have attempted to increase the effectiveness of compounding by using the motion of the heart itself to create decorrelation, but this approach is complicated by target registration methods [9]. A similar approach combines images with decorrelated speckle patterns produced by different imaging frequencies, requiring the use of sub-bands from the available spectrum and reducing axial resolution [10].
Image processing presents numerous other ways to reduce the appearance of speckle, potentially with less impact on resolution. Adaptive filters, for example, use the local statistics of each image pixel to reduce the texture variance in likely speckle regions [9], [11]. Other methods use domain transformations [12] or iterative processing [13] to reduce speckle but preserve features. These approaches require assumptions about the appearance of speckle and other structures that can be confounded by noise and acoustic clutter. Recent work has applied machine learning to reduce the speckle texture while avoiding explicit definition of these filters and structures [14]. In many of these methods larger spatial kernels or more iterations produce greater speckle reduction at the expense of resolution, but the exact cost varies between methods. These methods are difficult to assess as a whole because their implementations are often proprietary and they produce visibly different images across commercial scanners. Additionally they often require tuning for individual applications and rely on temporal smoothing to reduce frame-to-frame instabilities.
In this work we investigate the trade-off between resolution and speckle reduction and its impact on cardiac imaging tasks, extending preliminary results presented in [15]. We use spatial compounding as a representative method due to its well-understood characteristics and ability to reach a wide range of resolution/speckle reduction configurations. In Section II we present a synthetic aperture focusing method to decompose harmonic frequency channel data from focused beams into aperture domain spatial frequencies. This representation of the data allows for matched transmit/recieve spatial compounding across a wide range of subaperture configurations from a single data acquisition. Section III describes the experimental methods for data acquisition and analysis used in this work. In Section IV.A we present an experimentally derived resolution-texture trade-off curve for spatial compounding. In Sections IV.B and IV.C we present the evaluation of spatial compounding in clinical cardiac imaging using both quantitative detectability metrics and qualitative expert assessment in the context of cardiac diagnosis. In Section IV.D we compare the resolution-texture trade-off of spatial compounding to other sample speckle reduction methods. Section V contains discussion of the results as well as limitations and extensions of this work.
II. Theory
A. K-space spatial compounding
Spatial compounding is performed by creating partially decorrelated subimages from different effective aperture positions. The speckle pattern within these images is stochastic but decorrelates at a known expected rate with aperture translation [7], [8]. Recall that a conventional B-mode image senv is formed by coherent summation and envelope detection of the focused channel data sfoc at each pixel location :
| (1) |
where wrcv represents a receive aperture apodization for an array with M receive elements indexed by j. The magnitude operation can be used with quadrature demodulation or the Hilbert transform if sfoc is a real RF signal.
A receive compounded image can be formed by subdividing the data from the receiving elements using separated or partially overlapping subapertures. The focused channel data within each of P receive subarrays is coherently summed and envelope detected as in (1), and incoherently averaged together to produce a single image scomp with reduced speckle texture:
| (2) |
where w(p, j) is a window used to select each receive subarray indexed by p. The speckle texture variance is reduced by , where Peff is the effective number of independent aperture positions [7]. For receive compounding, this number is much smaller than the number of subapertures because the transmit aperture position common to all receive subapertures results in highly correlated speckle patterns.
More effective spatial compounding requires a shift of the transmit position as well, allowing further decorrelation between subimages. This can be accomplished by, for example, using a multiplexed transmit/receive subaperture across a larger physical array. However, this approach requires multiple transmissions for each image line to be compounded. Synthetic aperture methods have been previously demonstrated to reduce the total acquisition time using the “complete data set”, data collected individually from each transmit and receive element pair [16]. In this approach, arbitrarily positioned subapertures can be compounded from the focused multidimensional channel data using:
| (3) |
for N transmit elements indexed by i, where for a fully sampled array N = M. The transmit subaperture weights wtx and receive subaperture weights wrcv select an active segment of the array for each effective position, mimicking the physical multiplexing process.
Given the complete data set, we propose eschewing the physical subaperture paradigm in favor of “k-space compounding”. K-space as used here describes the 2-D spatial frequencies contained in the focused radio frequency data [17]. These can be directly observed from the focused data using the 2-D Fourier transform of a point target or homogeneous speckle region. K-space is an ideal domain in which to describe compounding because the overlap between two regions is equivalent to the correlation in the image domain. To produce decorrelated subimages we simply separate the focused echo data into different k-space regions.
The spatial locations of the individual elements in a transmitter and receiver pair determines the lateral k-space position of the data from that pair. While the complete data set provides three-dimensional data – transmit element i, receive element j, and spatial coordinate – these data can therefore be mapped onto a two-dimensional space k = i + j and as shown in Fig. 1. The triangle shape shown represents the redundancy of spatial frequencies – each end is formed by only a single transmit/receive pair on the edge of the array while the middle peak represents the summed contributions of element pairs mirrored across the center of the array. Similar to the receive compounding case in (2) we then specify P windowed sections across the array for compounding:
| (4) |
| (5) |
where wtri(k) represents the triangle weighting illustrated in Fig. 1, normalizing the k-space spectrum, and wksp(p, k) is a window that selects a region of k-space for each subaperture. For a chosen pair of transmit and receive apodization functions, the equivalent wksp window can be formed by their cross-correlation function. In this work wksp is chosen to be a triangular weighting to mimic the k-space sampling of a unity-weighted array, although other windowing functions can be used to apply apodization. Note that the limitations of receive compounding, where a fixed transmit aperture is used with varying receive subapertures, can be directly observed in this domain by the significant overlap of its weighting functions. Additionally, although similar to conventional transmit/receive compounding, k-space compounding includes transmit/receive element pairs that would not be found on a contiguous subarray and therefore may benefit from additional signal averaging at each k-space location.
Fig. 1.

K-space compounding. (from top left, clockwise) Individual element data are focused and combined according to their k-space index – the sum of their transmit and receive array positions. K-space is partitioned into overlapping regions, each of which forms a low resolution subimage. Subimages are incoherently combined by averaging envelope data to produce an image with reduced texture and improved detectability.
K-space described in the aperture domain directly relates to the k-space observed in the image domain. The sampled extent of k-space is inversely related to the image resolution by the properties of the Fourier transform. K-space compounding therefore provides a straightforward way to specify the trade-off between resolution and speckle reduction using the size and overlap between the k-space windowing functions. Smaller windowing functions allow more decorrelated images to be formed from the fixed k-space available, reducing speckle texture at the expense of resolution. Some overlap between the windows, as illustrated in Fig. 1, is also expected to improve texture reduction [7].
B. Recovery of the complete data set
The compounding methods described above require the complete data set, typically acquired by transmitting from each individual element of the array in sequence. However, the transmission from a single element is weak compared to a conventional transmission using the full array and is expected to have a poor signal-to-noise ratio. Multi-element diverging waves [18] can be used to approximate individual elements and spatial/temporal encodings [19]–[22] can be used to recover individual element contributions over multiple designed transmissions, but neither approach is able to generate a sufficient harmonic pressure field essential to acoustic clutter reduction in clinical imaging [23], [24]. A focused transmission is required, usually focused with one of a large number of synthetic focusing schemes [25]–[29]. Unfortunately these methods do not provide the complete data set required for spatial compounding in post-processing.
We have previously demonstrated Retrospective Encoding For Conventional Sequences (REFoCUS) [30], [31], a method to not only enable synthetic transmit focusing but also recover the complete data set. This method is compatible with the steered, focused transmission sequences typically used for cardiac imaging and with pulse inversion harmonic processing [32]. For a phased array scan, each of N transmissions uses all M elements on the array with varying time delays τn,m used for steering and focusing. Individual element signals are estimated from the focused transmit data S in the frequency domain using the adjoint (*) of the time delay encoding matrix H:
| (6) |
| (7) |
for each temporal frequency ω in the sampled bandwidth. The inverse Fourier transform of provides the complete data set with high signal-to-noise ratio. This decomposition of a sequence of data from focused transmissions into a sequence of data from individual element transmissions given receive channel data and the applied focusing delays is summarized in Fig. 2. Unlike other synthetic focusing techniques for focused beams, REFoCUS provides the ability to perform focusing and post-processing operations on each element independently, including the ability to define arbitrary transmit/receive subapertures as described in the spatial compounding section.
Fig. 2.

REFoCUS beamforming. (a) Focused transmission from M elements. Array elements produce individual diverging waves delayed to form a coherent converging wavefront. (b) One sample diverging wave synthesized by REFoCUS using N transmissions, coherently reinforcing the desired component from different focused waves by applying time delays to the recorded data.
III. Methods
A. Data acquisition
For all studies, scanning was performed with a Verasonics Vantage 256 ultrasound research scanner (Verasonics Inc., Redmond, WA) using a P4-2v phased array transducer (64 elements, 0.3 mm pitch). Transmission was performed using a 2.25 MHz center frequency with an excitation duty cycle of 67% and duration of two half-cycles. Each frame consisted of 75 beams focused at 5 cm spread across a 74 degree span (1 degree spacing).
Pulse inversion harmonic imaging was performed and receive data were sampled at 18.5 MHz to capture the first harmonic frequency content. Transmit voltage was selected based on calibrated hydrophone measurements to remain within FDA limits for acoustic output, achieving an MI of 1.01. Raw radio frequency (RF) channel data were stored for each acquisition for offline processing. Live B-mode imaging with this configuration was also provided to guide acquisition.
B. Data processing
RF data were processed by first summing over the inverted pulse pairs and applying a 5th order Butterworth bandpass filter around 4.5 MHz with 40% bandwidth to isolate the harmonic component. REFoCUS was applied to the recorded data as described in Section II to recover the complete data set – the contributions of individual transmit i and receive j element pairs s[t, i, j] through time t. Synthetic focusing was performed in polar coordinates for each pixel in the image using the time of flight tij:
| (8) |
with a radial spacing of λ/8 = 0.041 mm and an angular spacing of 0.25 degrees.
For the transmit element located at and the receive element located at , the time of flight for a selected imaging point is:
| (9) |
For receive-only compounding, images were formed from these focused data using (2) after summation over all transmissions. Subapertures of L elements were defined by dividing M elements into G groups with fractional overlap x (rounded down to the nearest element):
| (10) |
where x for this study was chosen to be 0.5 and G was varied in integer steps. wrcv for these subapertures was selected to be unity. Note that the nonlinear propagation that generated the harmonic signal is expected to provide an effective transmit apodization to reduce overall sidelobe levels [33]. While not performed in this study, continuous definition of subapertures could be achieved using interpolation across the aperture.
For k-space compounding, images were formed from these focused data using (5). Subapertures were defined by the autocorrelation of a unity-weighted window of L elements, producing a triangular-weighted window of length 2L − 1 in the k-space domain. As with receive compounding, continuous definition of the subapertures could be achieved using interpolation across either the aperture or k-space domain.
Images were scan converted after compounding to produce a Cartesian image and log compressed for display. Image quality metrics were computed using defined regions of interest (ROIs). Speckle signal-to-noise ratio (speckle SNR), contrast, contrast-to-noise ratio (CNR) [4], and generalized CNR (gCNR) [34] were measured:
| (11) |
| (12) |
| (13) |
| (14) |
where μi and μo are the mean pixel values and σi and σo are the standard deviation values for detected but uncompressed images. pi and po are the individual pixel values inside and outside a target structure in the log compressed images (compressed to create a more normal distribution for measurement). gCNR is a detectability metric based on the histogram overlap between two targets. As formulated above, improvement in each metric is indicated by an increasing value.
C. Phantom imaging
Phantom imaging was performed using the ATS 549 General & Small Parts phantom (ATS, Norfolk, VA). Ten images were acquired of a −15 dB 1 cm contrast lesion with varying speckle realizations by moving the transducer in elevation. Varying receive compounding was applied to the data by varying the number of receive subapertures from 1 (no compounding) to 64 (all elements individually compounded). Some numbers were omitted because they produced the same subapertures as computed by (10). Varying k-space compounding was applied to the data by varying the number of subapertures from 1 to 10.
Speckle SNR, contrast, CNR, and gCNR were computed as above using a 3 mm radius circular ROI inside the lesion and a 7.5–10 mm annular ROI covering the speckle background outside the lesion. Space was left between the ROIs and the true lesion boundary to allow for resolution loss during compounding. Resolution loss was measured using the edge resolution of the lesion as shown in Fig. 3.
Fig. 3.

To measure edge resolution in phantom imaging, (left) radial lines from the center of the lesion were averaged over ±10° from lateral. (right) The radial average was normalized by the mean values inside and outside the lesion, and resolution was defined by the 20–80% rise distance.
The circular lesion was radially unwrapped from ±10° from lateral (on both sides of the lesion) to produce a straight edge that could be averaged across angle to produce a 1-D function of radius. The edge function was normalized by subtracting the mean value inside the lesion and scaling by the mean value outside the lesion. Edge resolution was defined using the rise distance – the distance between the 20% and 80% points on this curve.
D. Cardiac imaging study
Cardiac imaging was performed using volunteers at Duke University and subjects at the Duke University Medical Center with IRB approval. All subjects provided written informed consent. 25 total subjects were recruited without consideration of any previous cardiac diagnosis. A cardiac sonographer obtained 3 seconds (90 frames) of data from an apical four-chamber view in each subject. In review, 7 subjects were omitted from the study as having non-diagnostic image quality with insufficient endocardial border visible to make either qualitative or quantitative assessment.
1). Quantitative analysis:
The effect of cardiac compounding was quantitatively assessed using the image quality metrics described above to characterize texture, contrast, and detectability. ROI selection was performed using the synthetically focused data without spatial compounding. For each subject, a cardiac sonographer selected a single frame at a point in the cardiac cycle where the chamber of the LV and the LV endocardial border were most clearly identified. The sonographer used a pen tool to manually outline the two regions in each frame. Each region could be composed of multiple segments to include non-contiguous areas as needed. An example frame is shown in Fig. 4.
Fig. 4.
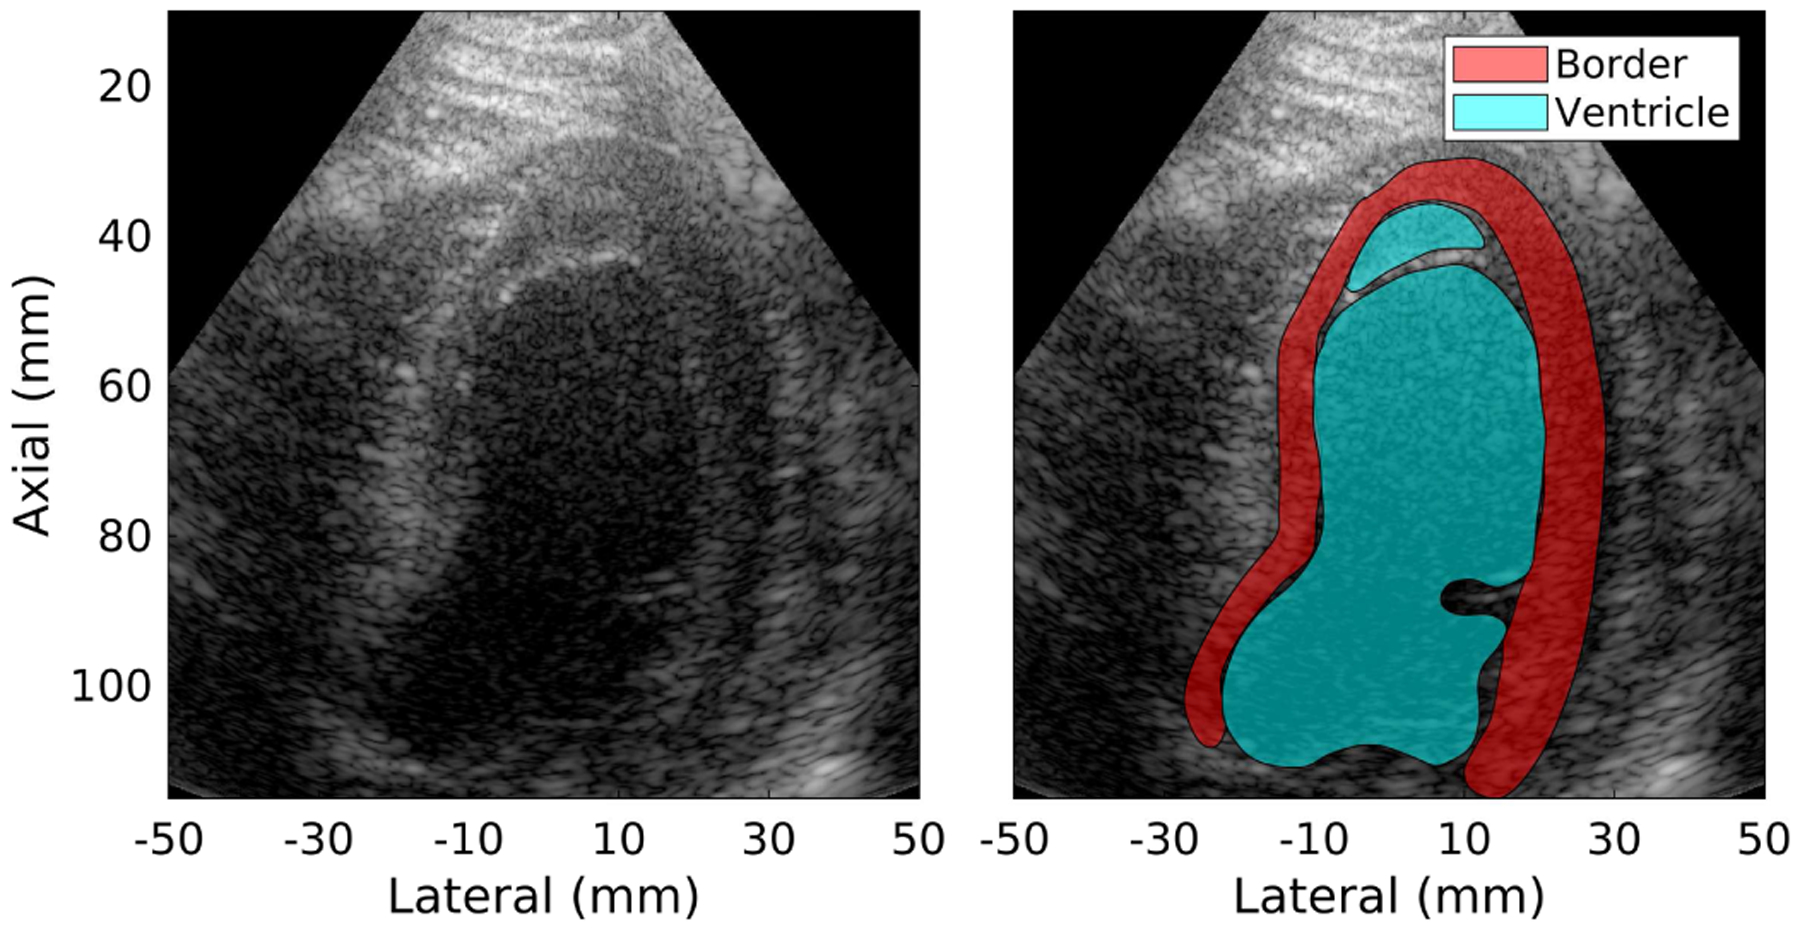
(left) Sample B-mode image for subject 11. (right) Regions of interest – LV endocardial border and chamber of the LV – drawn by an experienced sonographer using the B-mode image. ROIs may contain multiple sections as necessary, in this example excluding a visible chord.
The selected frames were processed using four spatial compounding conditions described in Table I. The control case was the “None” condition, using the entire aperture coherently. “Low” was selected based on preliminary optimization of receive compounding as a balance between speckle reduction and lateral resolution that could be accomplished with either receive or k-space compounding (receive selected here). “Medium” and “High” were selected as modes uniquely enabled by k-space compounding that more aggressively reduced speckle texture at the expense of resolution. For each condition, speckle SNR was measured in the endocardial border region while contrast and detectability metrics were computed between the two regions.
TABLE I.
Spatial compounding configurations
| Name | Compounding method | Subapertures | Overlap |
|---|---|---|---|
| None | None | 1 | - |
| Low | Receive | 7 | 50% |
| Medium | K-space | 5 | 50% |
| High | K-space | 8 | 50% |
2). Qualitative analysis:
In addition to the image quality metrics computed, differences in image quality were subjectively assessed by expert reviewers. The reviewers – two cardiac sonographers and one cardiologist – were asked to assess the videos from each subject for four different tasks:
Rank the images by your confidence of detecting the presence/absence of LV apical thrombus
Rank the images by your confidence in diagnosing LV wall motion abnormalities and LV ejection fraction
Rank the images by your confidence in assessing mitral valve pathology (thickening, calcification, mass, etc)
Rank the images by your overall impression
For the apical four chamber view, the first three tasks roughly correspond to structures in the top, middle, and bottom sections of the images. Note that only a single video clip was collected for each subject so views and processing were not optimized separately for each assessment task.
The reviewers assessed all subjects for each task in a randomized order. For each subject, reviewers were simultaneously presented with videos from all four compounding conditions in a random, blinded order. Sample images for one subject are shown in Fig. 5 and videos for all subjects are provided as supplemental material. Reviewers were given the ability to vary the displayed dynamic range. Reviewers were asked to rank their preference for the four videos given a particular task and were given the option to not evaluate individual videos if they could not be assessed for that task (e.g. if the mitral valve were not visible for task 3). Across all tasks, subjects, and reviewers, 43/864 (5.0%) of assessments were marked as unable to be evaluated. Reviewers were prompted to only assess their preference between the simultaneously displayed videos without regard for overall image quality or comparison with other subjects.
Fig. 5.
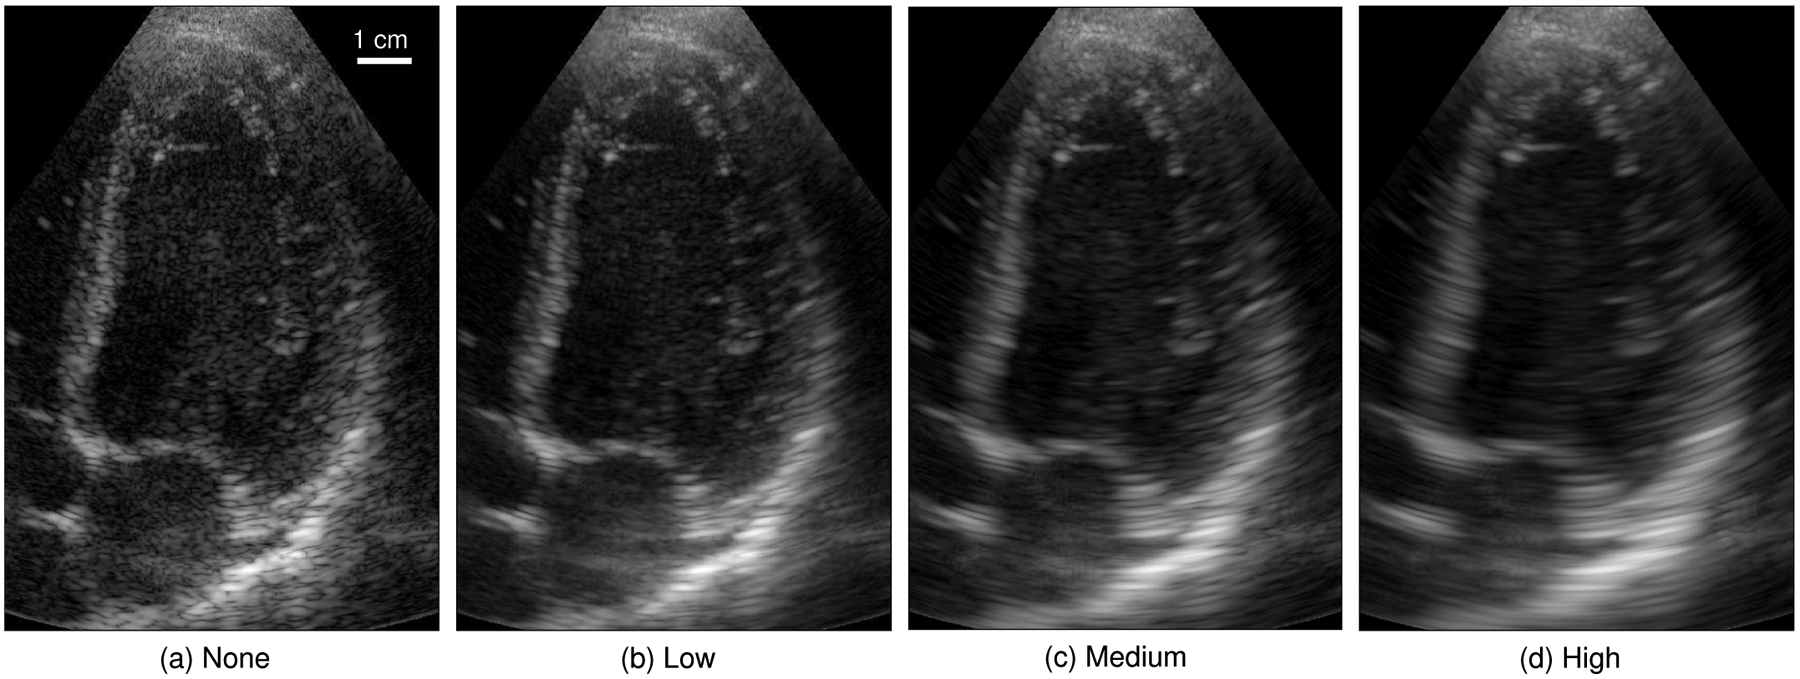
Sample cardiac frame from subject 12 across the four selected compounding conditions. For each subject, all 90 image frames were processed and shown as a 3 second (real-time) video clip. The mean and standard deviation of each image were normalized to match a reference frame in order to reduce the visual impact of differences in normalization and grayscale mapping between frames and compounding conditions.
E. Image processing
Two sample image processing methods were applied to the phantom data to investigate their performance in speckle reduction against lateral resolution loss.
A radial blur was performed by applying a radial frequency Gaussian window to the two-dimensional Fourier transform of the envelope data. The width of the window was varied using the α parameter defined by MATLAB from 1 to 16.
Adaptive filtering was performed using the Bayesian Nonlocal Means (BNLM) filter available online in association with [35]. This filter attempts to classify pixels as signal or noise by statistically comparing values to surrounding regions. The algorithm is designed for a noise model that mimics log compressed speckle, so the code was run on log compressed images before scan conversion with values normalized between 0 and 255. The filter used a patch size of 3×3 and a search region of 7×7 pixels with a value offset of 1. The resulting images were then scaled and shifted back to the original linear image space and scan converted for the computation of image metrics. The smoothing parameter was varied from 0.125 to 16 by factors of 2. These parameters were selected based on the sample code provided but further optimization may be possible based on spatial sampling and speckle size.
The BNLM filter was also combined with spatial compounding to evaluate combined performance of the two methods of speckle reduction. The same filter parameters were used as above after applying the “Low” and “Medium” compounding conditions and log compressing the resulting image. As above, the resulting image was scaled and shifted back to the original linear image space for evaluation. Although spatial compounding is expected to change the statistical properties of the speckle background, the filter was used as provided without modification.
IV. Results
A. Phantom imaging
Phantom imaging was used to establish a trade-off curve between edge resolution and target detectability. It is expected that increased spatial compounding reduces speckle texture (increases speckle SNR) and therefore improves detectability at the expense of lateral resolution.
Fig. 6 shows this trade-off in terms of the four measured image quality metrics. Note that the individual points marked on the curves represent discrete measurements made using the subaperture definitions described above but do not represent all possible compounding configurations. The speckle SNR plots for receive and k-space compounding closely tracked together from 1.80 at no compounding up to 2.48 at the limit of receive compounding, increasing with more aggressive compounding (i.e. more and smaller subapertures). K-space compounding continued to trade resolution for speckle reduction, reaching a maximum speckle SNR of 3.56 at the most aggressive compounding tested.
Fig. 6.
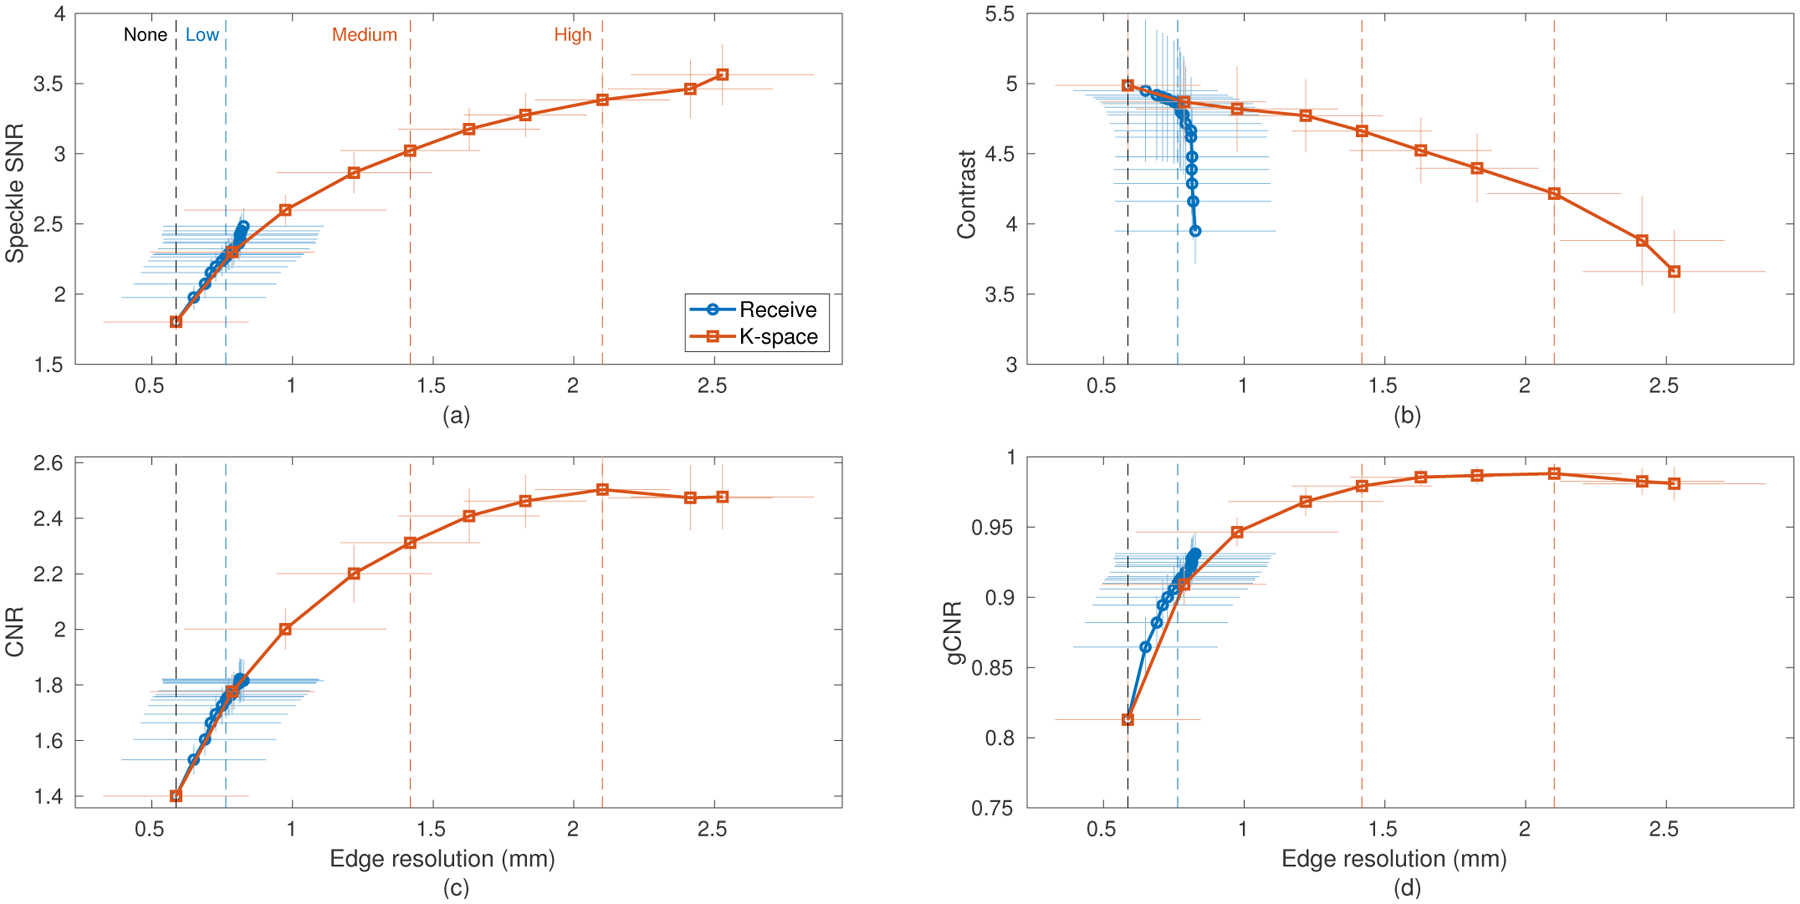
Experimental data of a −15 dB lesion phantom demonstrating the resolution-image quality trade-off produced by spatial compounding using both receive and k-space compounding with varying numbers of subapertures. Horizontal and vertical error bars are drawn to represent one standard deviation (N=10). The four imaging conditions used in the cardiac study are labeled by vertical dashed lines. (a) Speckle SNR, (b) Contrast, (c) CNR, and (d) gCNR plotted against edge resolution. Increased compounding (larger edge resolution) corresponds to reduced speckle texture and increased target detectability, but lower contrast.
Contrast was reduced by increased compounding as noise and off-axis scatter within the hypoechoic lesion were worsened. Receive compounding was observed to have an effective maximum edge resolution due to the fixed transmit aperture, limiting its ability to continue to improve the image quality metrics past around 14 overlapped subapertures. Past this point receive compounding produced reduced contrast but increased speckle SNR that largely offset in overall detectability.
CNR and gCNR both showed improved detectability with increasing compounding. These improvements appear to be driven primarily by texture reduction in the speckle background. Both metrics reached a plateau as contrast fell faster than speckle SNR rose, indicating that there is a practical limit to the amount of compounding that may be useful, especially in complex clinical targets.
With the exception of contrast, the receive and k-space compounding methods produced similar image quality for the edge resolutions achievable by both. The four selected compounding configurations are well spaced on these curves, providing a representative sample of image quality across possible amounts of spatial compounding to be tested clinically. These include two points (“Medium”, “High”) beyond what is reachable with conventional receive compounding. Also, while the “Low” case to be tested in the cardiac study was performed with receive compounding, it could be equivalently performed with k-space compounding according to these metrics.
B. Cardiac imaging - quantitative
The acquired data were quantitatively assessed for visiblity of the LV endocardial border relative to the chamber using ROIs drawn by a cardiac sonographer. Fig. 7 shows the measured gCNR for each subject across the four tested compounding conditions. Compounding was required in all cases to optimize the gCNR and the optimum compounding configuration was mostly split between the “Low” and “High” conditions. While several of the subjects with lower gCNR benefited from less compounding and those with higher gCNR from more compounding, this trend has clear outliers (subjects 3 and 18) and is not statistically significant. CNR was optimized by “High” compounding in 16 cases and “Medium” in 2, showing a stronger recommendation for aggressive speckle reduction at the cost of lateral resolution.
Fig. 7.
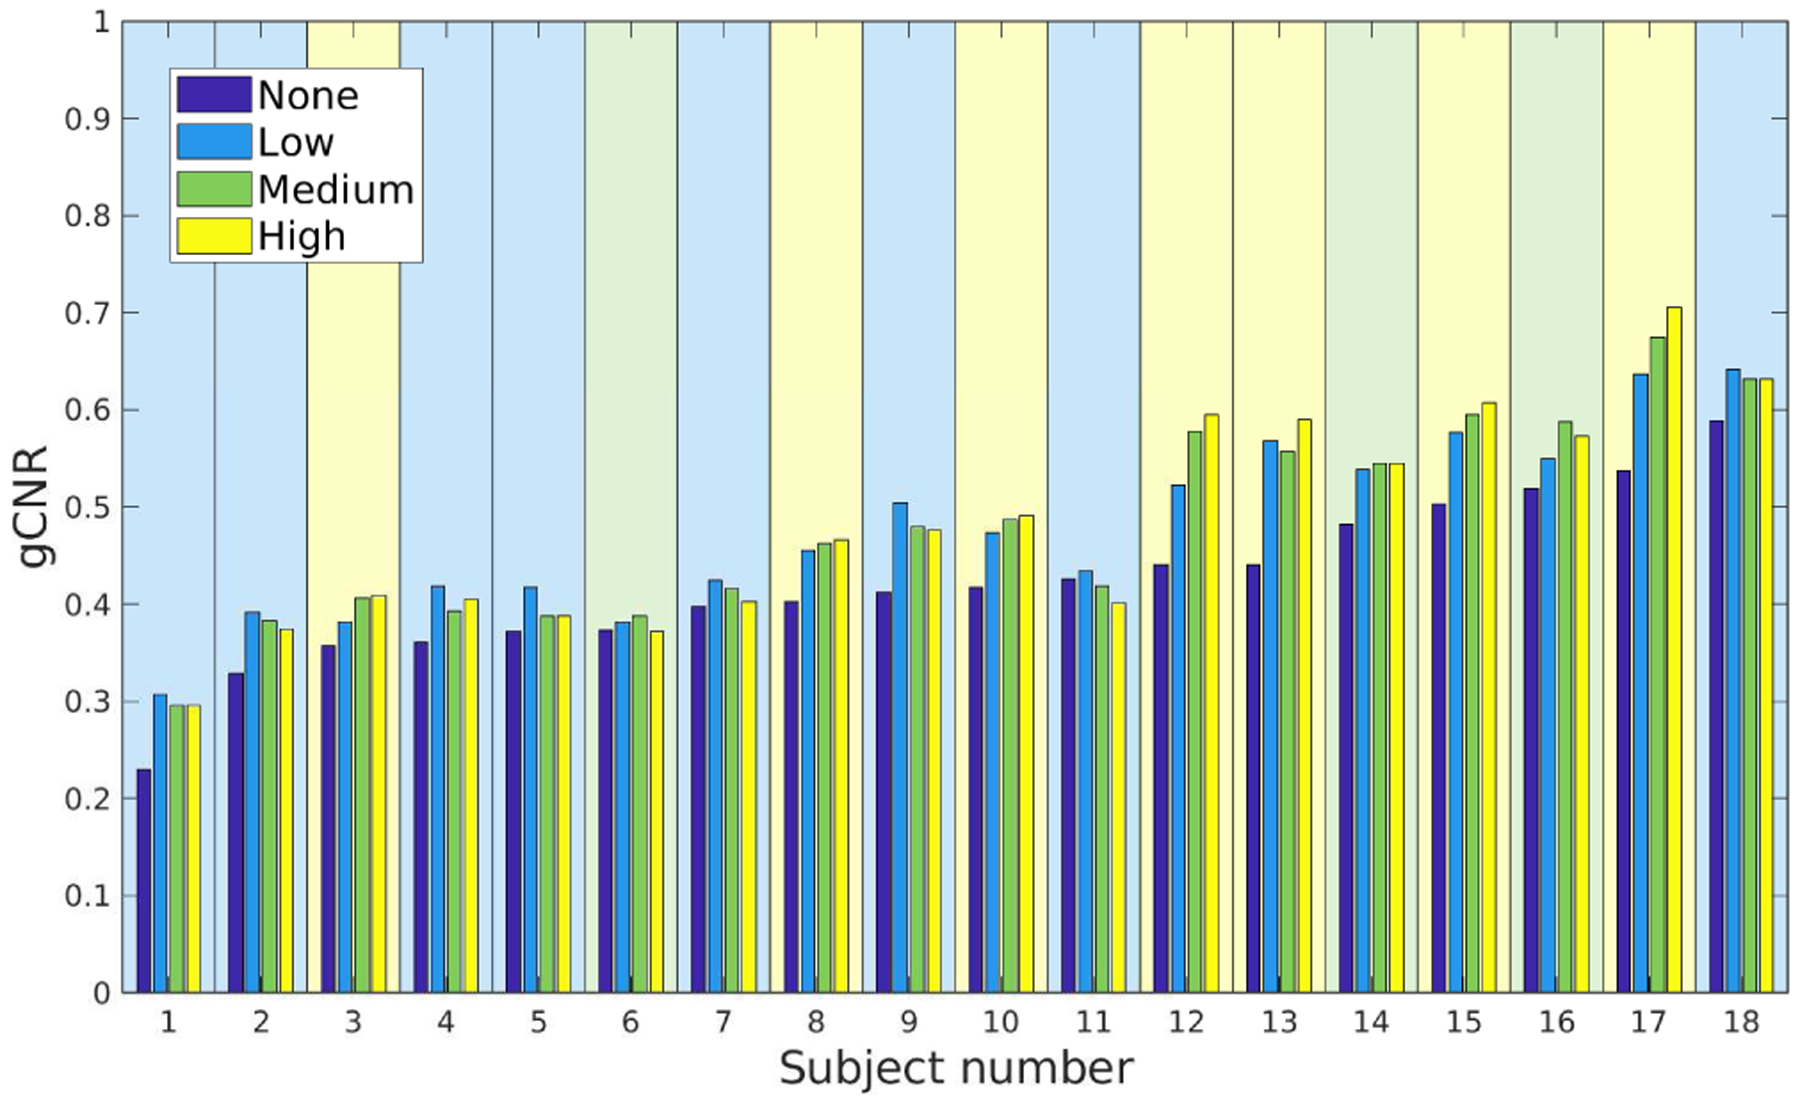
Detectability of LV endocardial border versus chamber of the LV measured by gCNR across subjects and compounding conditions. The background of each subject is shaded to reflect the best-performing compounding condition (“None”: 0, “Low”: 8, “Medium”: 3, “High”: 7). Subjects were sorted from lowest to highest gCNR in the “None” case.
Paired statistics for all four image quality metrics are shown in Fig. 8. As suggested by the split discussed above, there was no statistical difference between the three compounding methods for gCNR but all were different from the no compounding case. All pairs were significantly different for CNR, increasing detectability with more compounding. Very small but statistically significant differences were observed between the cases for contrast. More compounding resulted in higher speckle SNR with statistical significance between each group except “None” and “Low”.
Fig. 8.
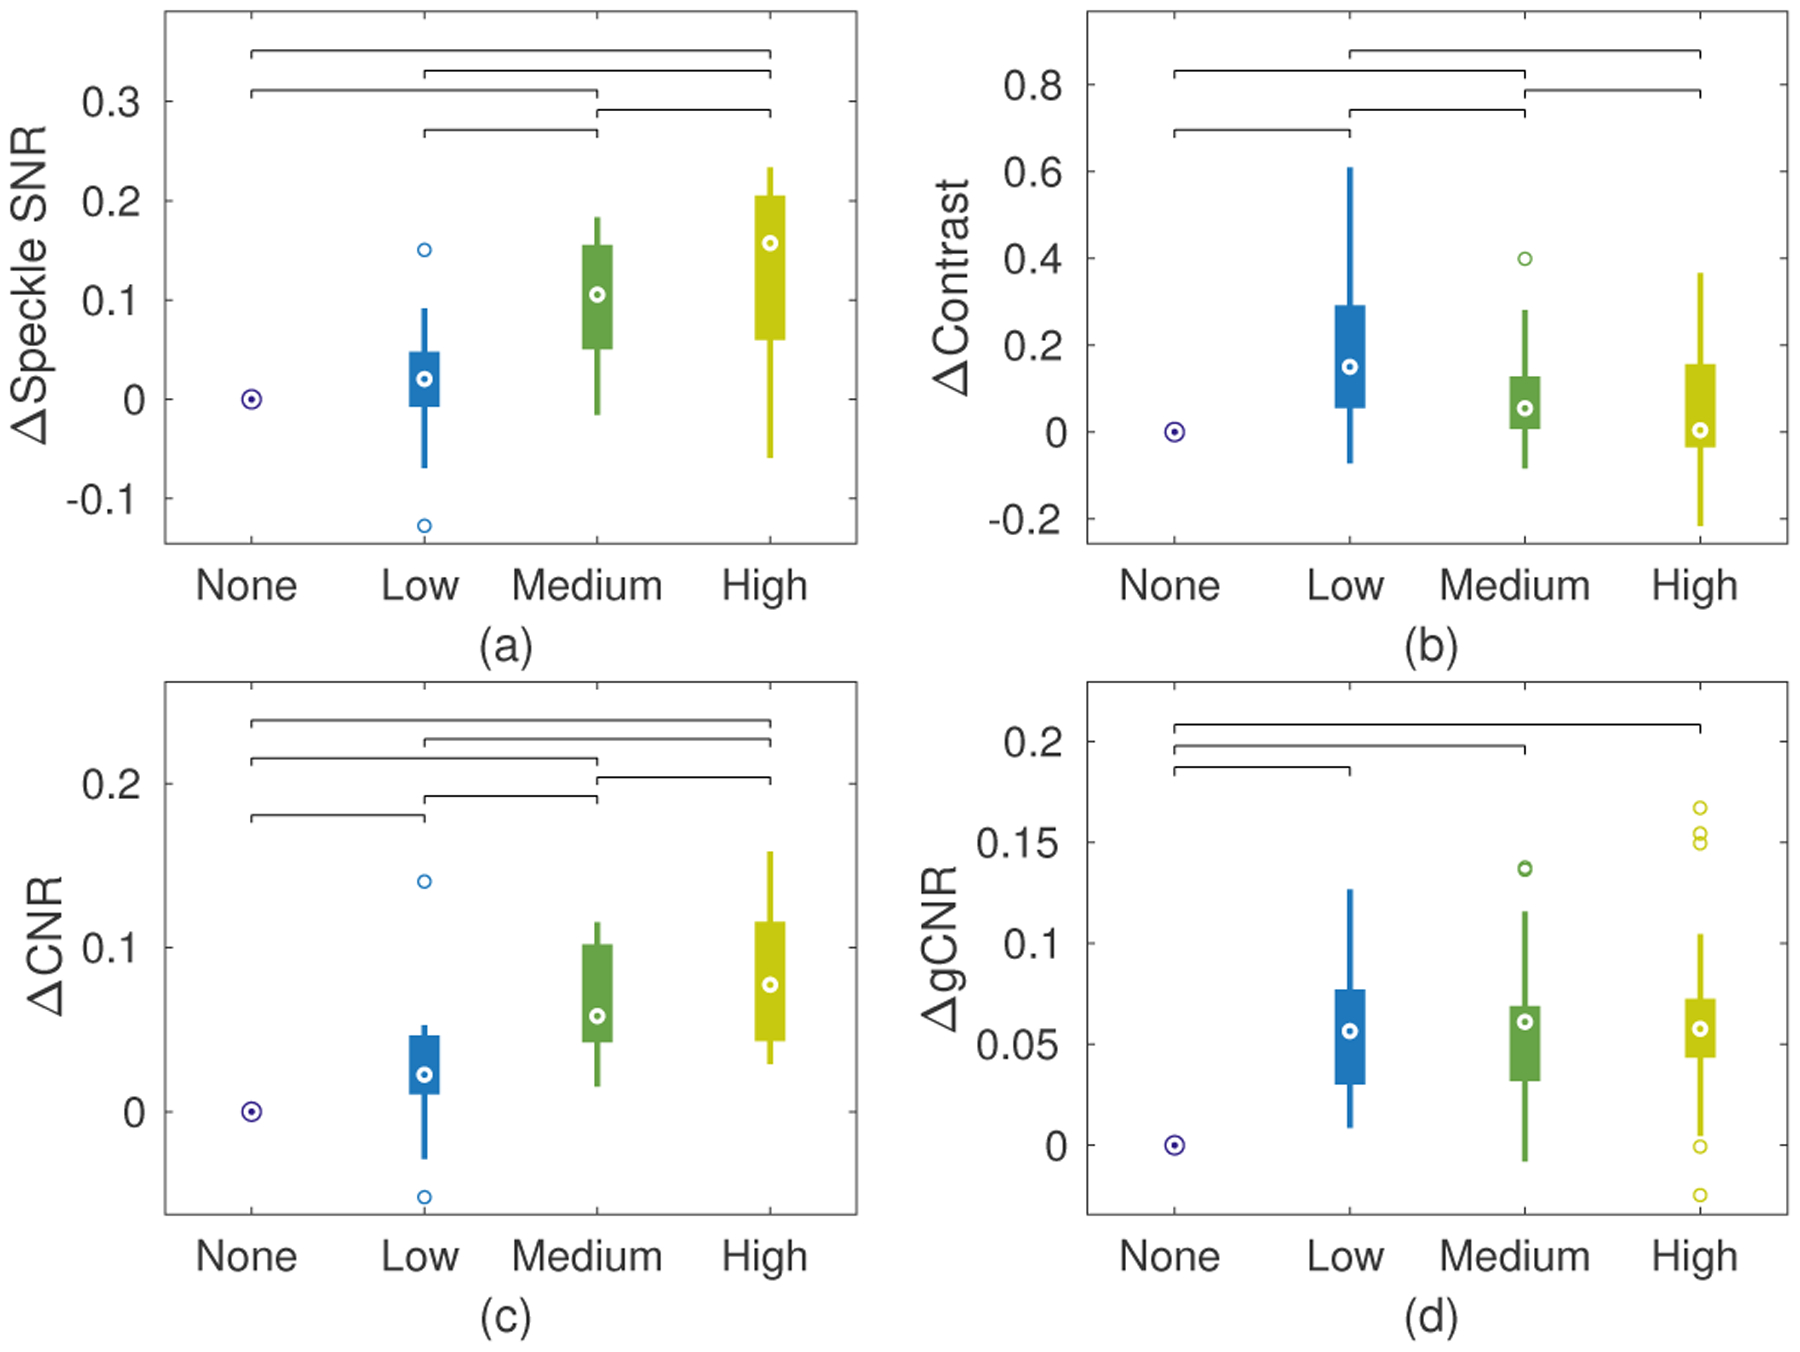
Paired data boxplots of image quality metrics from LV endocardial border and chamber of the LV: (a) speckle SNR, (b) contrast, (c) CNR, and (d) gCNR. Data are presented relative to the “None” condition by subtracting each set of paired data points. Brackets between conditions represent statistical significance (p<.05) using a paired t-test.
It is important to note that all of these quality metrics indicate relatively small improvements with compounding compared to phantom cases. This is likely due to the fact that texture reduction is limited for structures like the endocardial border where there is not fully developed speckle to be compounded. For example, average speckle SNR without compounding was measured to be 0.80, much lower than the expected 1.91 for homogeneous tissue [3]. With only small changes in contrast, the CNR should be strongly correlated with speckle SNR [36], resulting in only small changes in CNR as well for these cases. Despite these metrics, strong visual differences were observed between the compounding conditions.
C. Cardiac imaging - qualitative
Expert reviewer rankings serve to capture not only the characteristics measured by the image quality metrics but also the unquantifiable properties related to clinical structures of interest. The total rankings across tasks and reviewers are given in Table II and shown as stacked bars for each compounding condition in Fig. 9. The reviewers showed clear preference for the “Low” compounding case, ranked first in 77.9% of evaluated cases. Conversely, reviewers ranked the “High” compounding condition last in 78.7% of cases. The “None” and “Medium” cases were selected with approximately the same frequency as each other across all rankings. These two conditions were ranked first in a combined 21.2% of cases, indicating that adjustable levels of compounding may be desired for clinical implementation.
TABLE II.
Total rankings across assessment tasks and reviewers
| Compounding | 1st | 2nd | 3rd | 4th | Not eval. |
|---|---|---|---|---|---|
| None | 25 | 66 | 87 | 27 | 11 |
| Low | 162 | 38 | 7 | 1 | 8 |
| Medium | 19 | 94 | 77 | 15 | 11 |
| High | 2 | 8 | 34 | 159 | 13 |
Fig. 9.
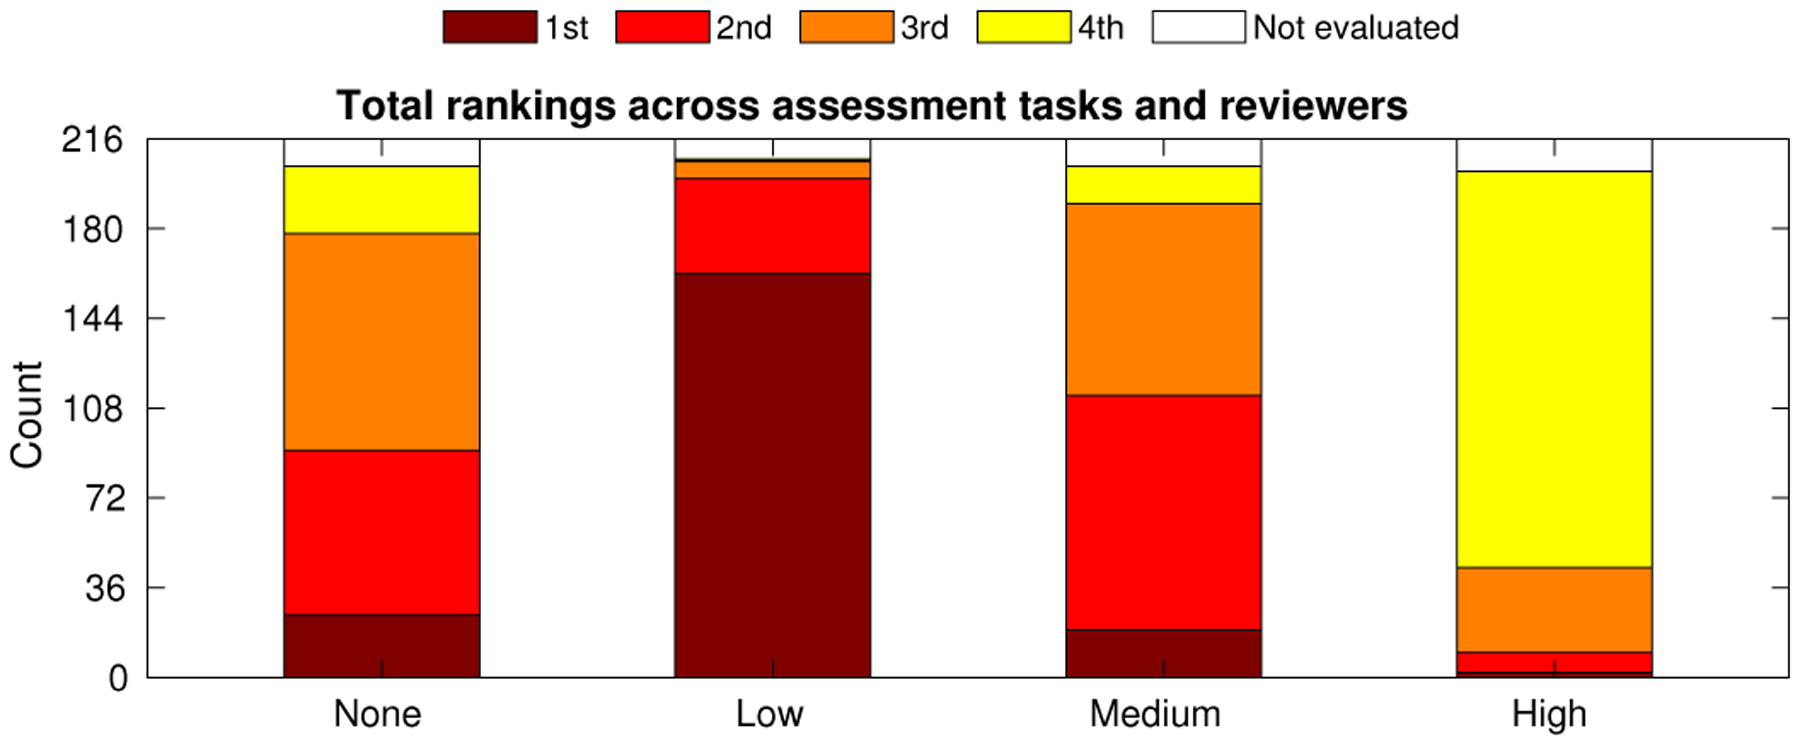
Expert reviewer ranked preferences of compounding conditions tabulated across all four cardiac assessment tasks and three reviewers. Counts for each bar are found in Table II.
Fig. 10 shows a more detailed look at the data of Table II, showing the frequency of individual rankings and connections between them. The dot size reflects the frequency of each ranking for each condition, for example showing that “Low” was most frequently selected first, and the weight of the line between them reflects the frequency with which that pair were selected in order. Importantly, this graph shows that it was approximately equally likely that the reviewers would choose more or less compounding as their second choice, followed by the opposite as their third choice. This gives a sense of what reviewers may have chosen given a more continuous set of compounding conditions, reflecting a distribution centered at “Low” and lying symmetrically on each side. The plot also shows interesting smaller groups of cases. For example, if “None” or “Medium” were selected first, “Low” was the most likely second choice. This may be expected if the continuum of compounding configurations results in a continuous variation in image characteristics as perceived by the reviewers. An interesting anomaly is the connection between 3rd–“High” and 4th–“None”, showing a strong preference in those cases for moderate compounding rather than either extreme.
Fig. 10.
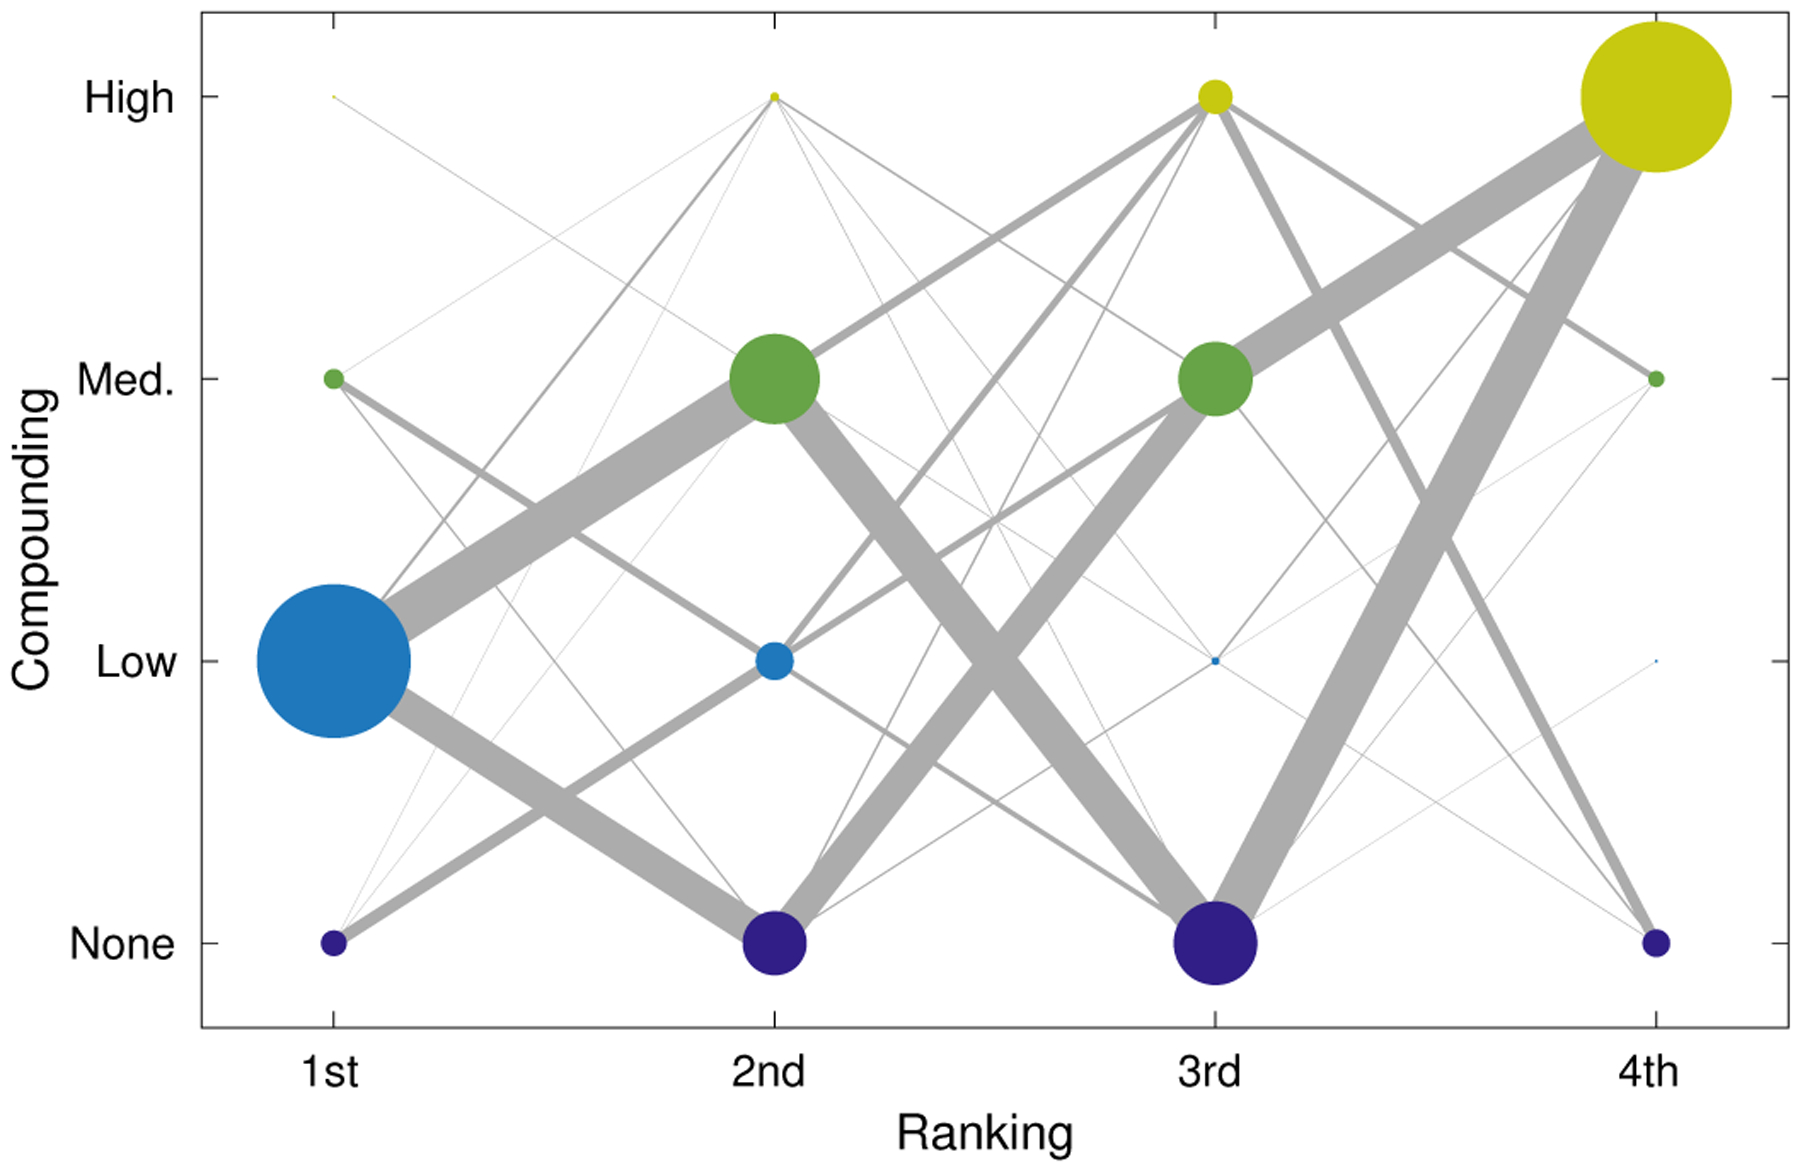
Weighted graph showing ordering of preferences across all tasks and reviewers. Marker size indicates relative frequency of a ranking for a particular compounding condition and matches the counts provided in Table II. Edges between markers represent a sequential ranking of two compounding conditions and the thickness of the line indicates relative frequency of the ordering. For example, reviewers most commonly selected “Low” first and approximately equally selected “Medium” and “None” second.
Insights can also be gained from subsets of the review data. Fig. 11 shows the ranking results for individual tasks and reviewers. We observed consistency between the three reviewers with one notable exception. Reviewer two (middle bar in each group) selected “Low” first most frequently like the others did, but showed a strong preference for “None” over “Medium” as second choice in the apical and wall motion tasks. This may reflect the preference of that reviewer for increased resolution for those tasks. Fig. 11 also shows fairly consistent reviews across tasks with two exceptions. There was a distinct preference for “Medium” as second choice over “None” in the overall impression task, with all three reviewers visually preferring the reduced texture of increased compounding despite their more balanced preferences in individual tasks. There was also a slight preference for “None” over “Medium” in the mitral valve task. This may be expected because of the importance of resolution to the identification of valve thickness and any masses on this fairly narrow structure.
Fig. 11.
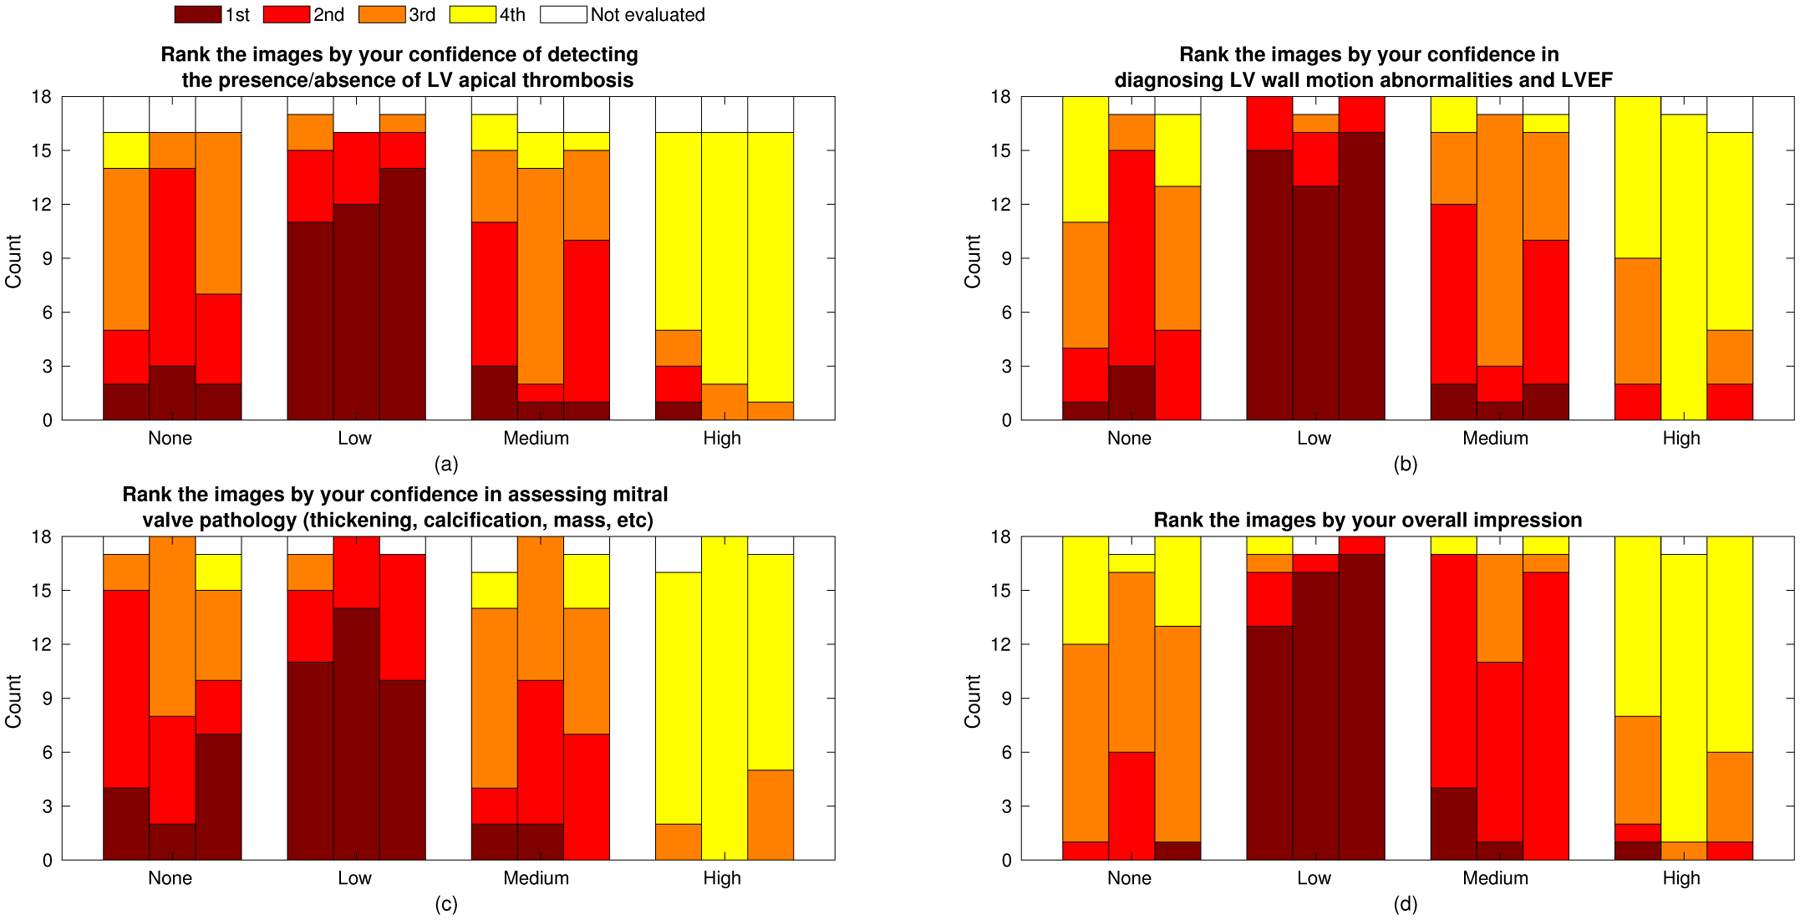
Expert reviewer ranked preferences for the four individual assessment tasks. Adjoining bars represent the independent rankings of three reviewers (order maintained across graphs). The sum of counts across the three reviewers and four tasks is given in Table II.
D. Comparison of speckle reduction methods
The cardiac imaging study in this paper focused on a single trade-off curve between resolution and speckle texture produced by the signal processing operation of spatial compounding. However, a wide range of signal and image processing methods are employed in commercial systems to achieve the same goal of speckle texture reduction. In order to place these results in a broader context we present a preliminary comparison of two image processing techniques using the same phantom data and lesion imaging task as above.
Radial blurring and Bayesian nonlocal means filtering were evaluated on the same criteria as spatial compounding using edge resolution, speckle SNR (texture), contrast, CNR, and gCNR. Fig. 12 shows the resolution trade-off curves for these methods compared to the k-space spatial compounding curves. Fig. 13 shows the results of the different processing methods on the evaluated lesion target for conditions that produced approximately the same edge resolution (1.3 mm, equivalent to the “Medium” compounding case). The dynamic range of these images have been modified by matching the mean values inside the lesion and speckle background to the unprocessed image. This choice of shift and stretch maintains the apparent contrast of the lesion between all methods, allowing evaluation of texture inside and outside the lesion as well as the same perception of edge resolution as was measured.
Fig. 12.
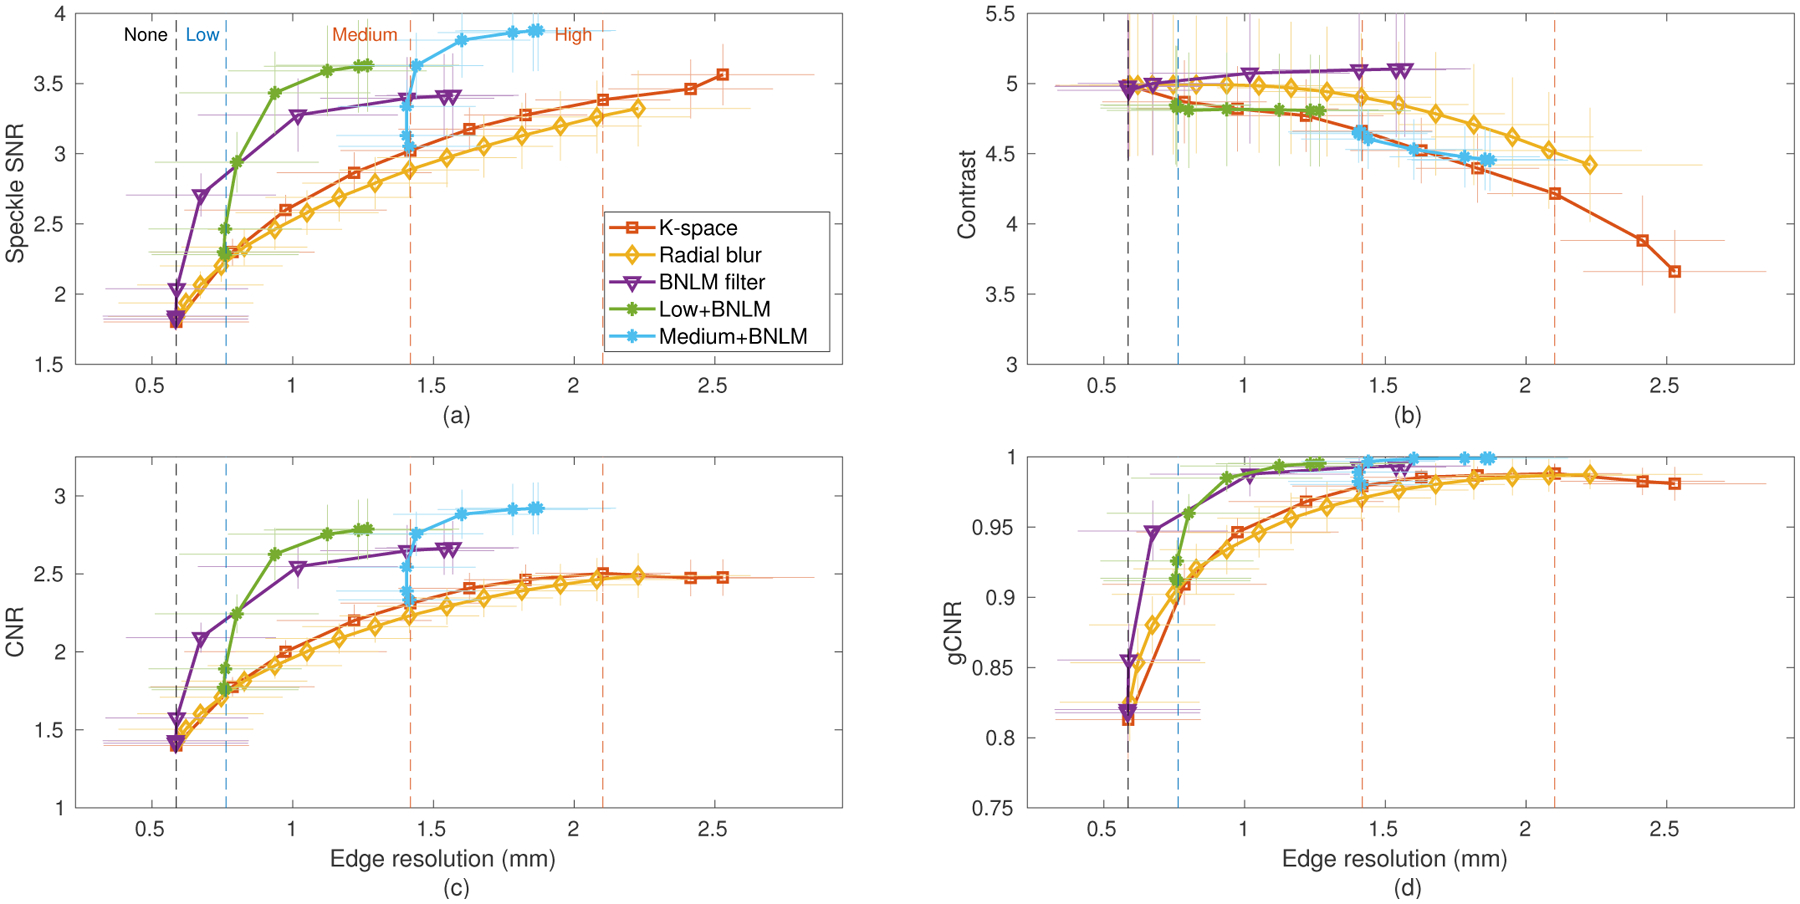
Comparison of the resolution-image quality trade-off of radial blur and Bayesian nonlocal means image processing against spatial compounding using the data of Fig. 6. The Bayesian nonlocal means (BNLM) filter was also combined with the “Low” receive compounding and “Medium” k-space compounding configurations using various values of the smoothing parameter.
Fig. 13.
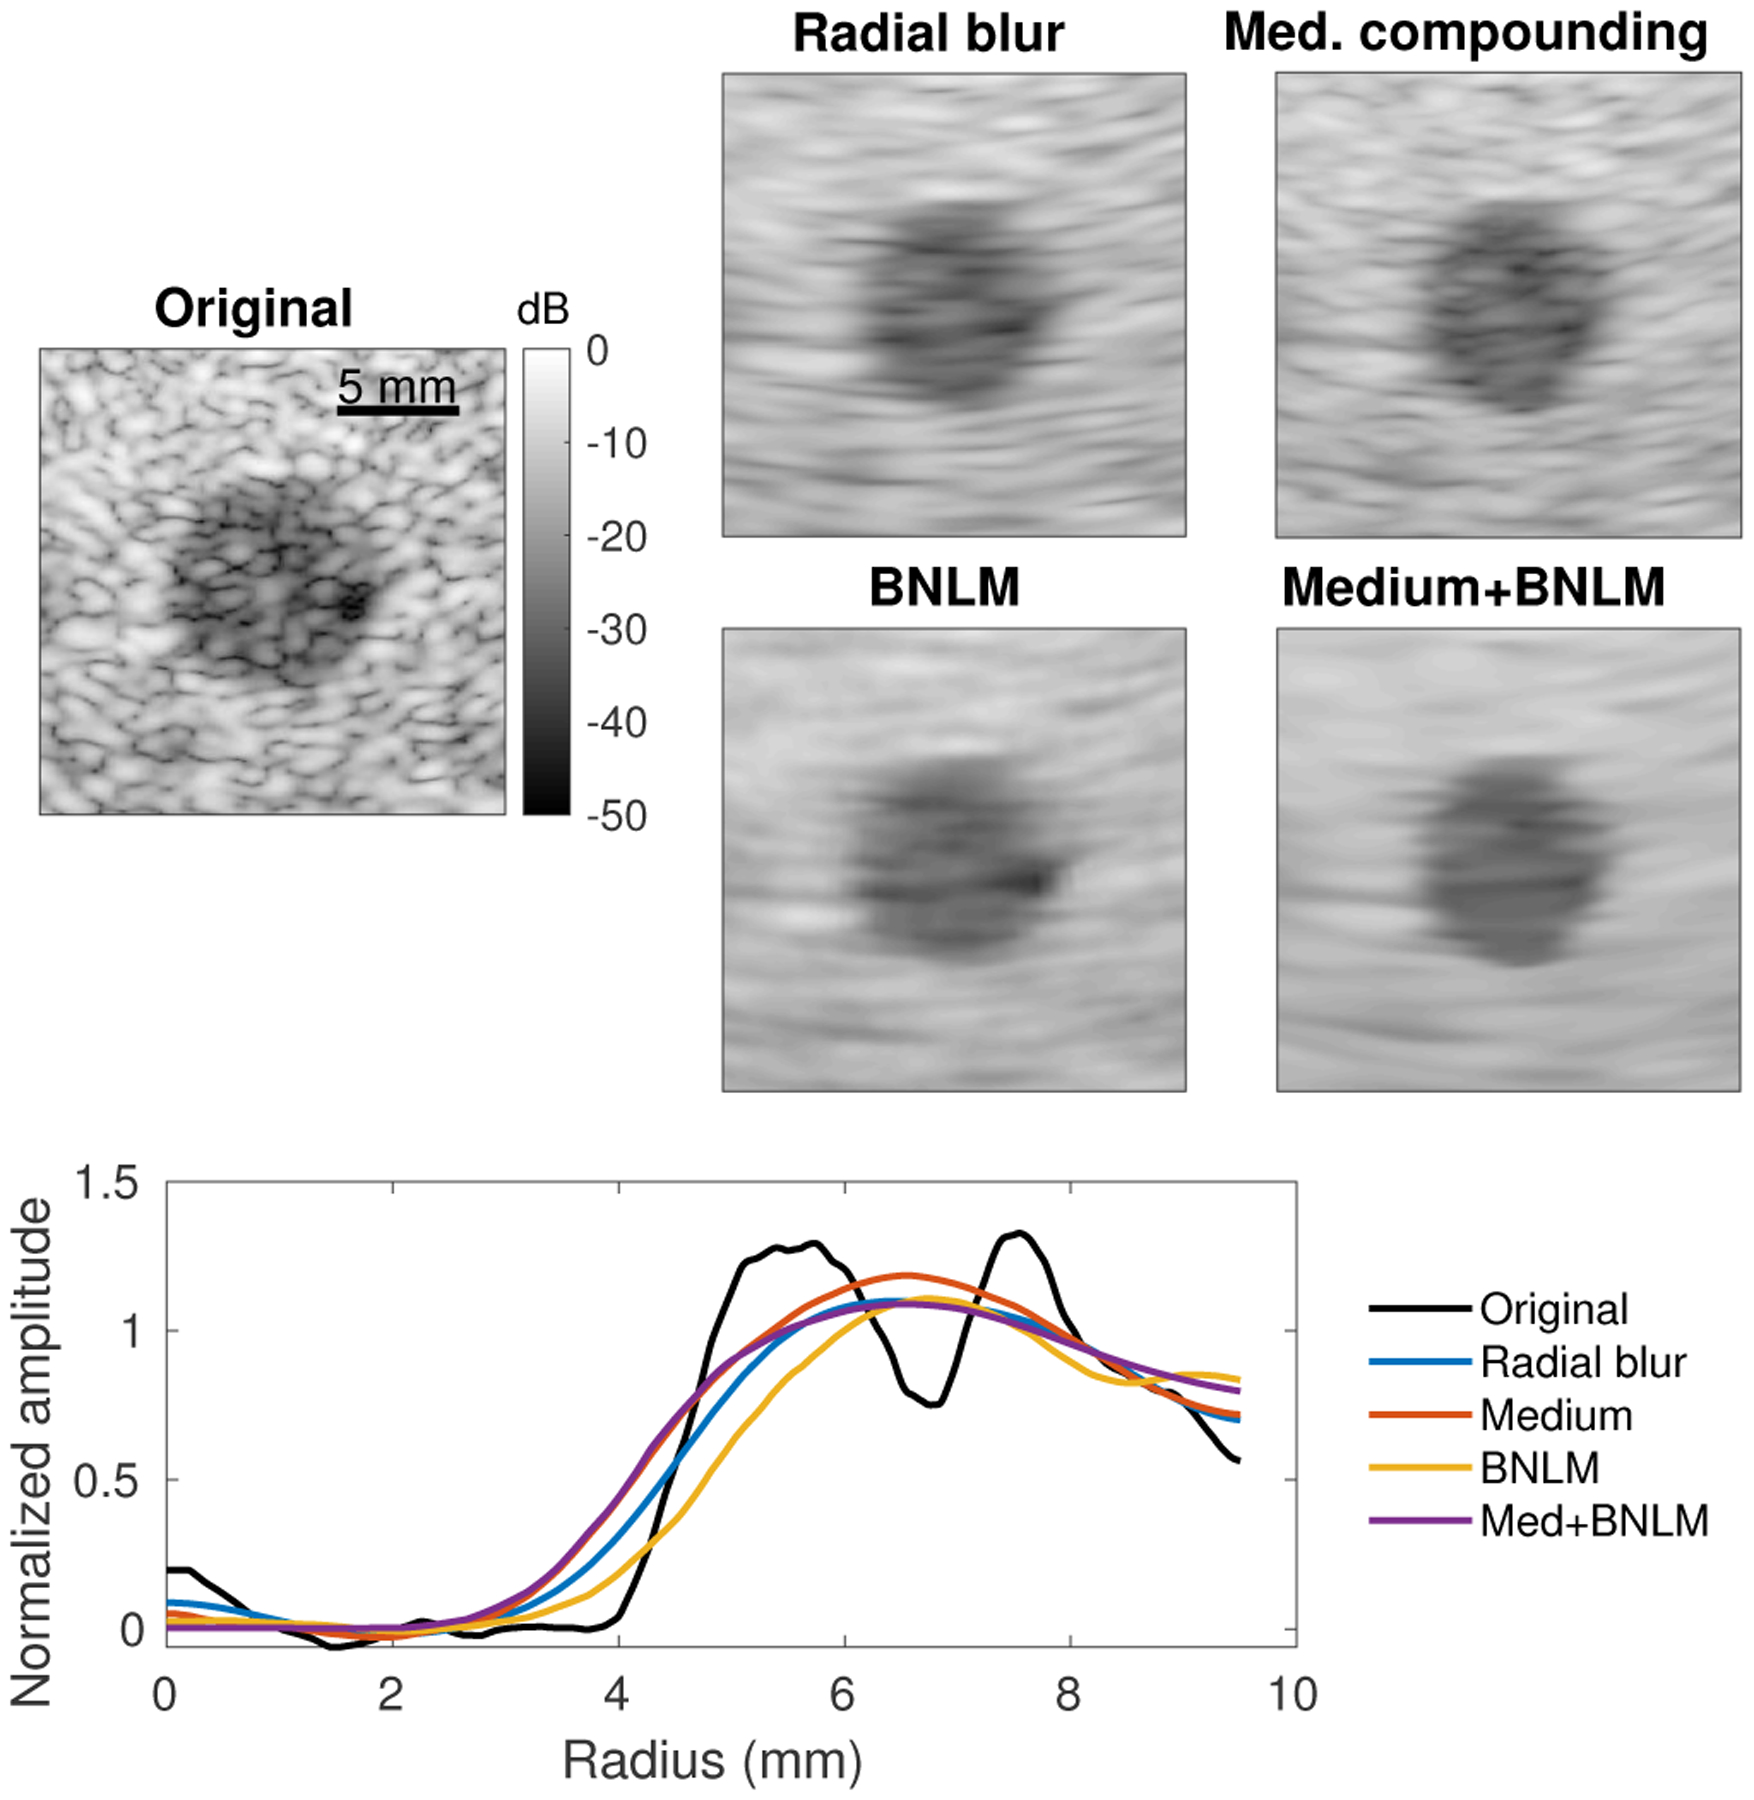
Comparison of spatial compounding and image processing (radial blur, BNLM filter) of a −15 dB lesion phantom. All texture reduction methods were tuned to produce an edge resolution of approximately 1.3 mm (equivalent to the “Medium” compounding case) and images are displayed with matched background and lesion means (matched contrast). Edge resolution for each is plotted as in Fig. 3.
Across all metrics radial blurring showed similar performance to k-space compounding, with a slight loss of speckle SNR and CNR and relatively small gains in contrast at any given edge resolution. This may be expected since both methods effectively limit the radial spatial frequencies in the final image. However, the speckle texture and noise reduction mechanisms differ in that the compounded images do not solely rely on the radial blur for averaging and actually re-randomize the speckle and noise patterns between subimages. This can be observed in the differences in the remaining texture in Fig. 13, where the radial blur shows a characteristic radial smearing that is more pronounced than in the compounding case.
The adaptive BNLM filtering performed very differently from compounding, demonstrating improved texture reduction and in turn detectability with lower resolution losses. In this particular implementation, the improvements reached a plateau where the images suffered resolution loss without further quality gain. Interestingly, Fig. 13 shows that the BNLM filtered lesion has less apparent loss in width than the blurred or compounded lesions despite the same measured edge resolution. The measured resolution, here defined by a sharpness criteria, does not take into account a shift in the edge location. The improved lesion size representation is another reason to pursue adaptive filtering for speckle reduction.
Synergistic performance was observed for the spatial compounded images with adaptive filtering applied. The two techniques use different mechanisms for texture reduction and therefore can complement each other. For both the “Low” and “Medium” compounding configurations, the application of the BNLM filter reduced speckle texture and improved lesion detectability with little additional loss in edge resolution. Fig. 13 shows significantly improved texture reduction both inside and outside the lesion for the synergistic case. Even though all the processed images were chosen to have the same edge resolution, the apparent lesion size (radius) varied between the methods. Also note that spatial compounding (or blurring) is expected to change the speckle texture statistics, meaning that the BNLM filter used should perform sub-optimally on these images. Further improvements may be possible by changing the assumptions made in the filtering step.
These observations motivate further study of adaptive filtering applied to cardiac imaging, possibly in combination with speckle reduction strategies such as spatial compounding. However, such a study likely requires a much larger reader preference study than the one presented here due to a much larger parameter space to explore. For example, the BNLM filter used here can perform further speckle reduction using a larger kernel or neighborhood but as shown in Fig. 4 of [35] it can behave differently for lesions of different contrasts, distort the lesion boundary, and fail to accurately represent some targets such as points. Optimization of such adaptive filters must be performed for a particular imaging configuration, type of target, and assessment task.
V. Discussion
The phantom and cardiac studies presented all suggest the need for the capability to apply texture reduction to improve image quality. Quantitative metrics consistently indicated that more texture reduction should lead to improved target detectability. Yet, expert reviewers indicated that the “Low” compounding configuration was most often the desirable balance between texture reduction and resolution loss for this particular trade-off curve. The reviewers did, however, indicate the preference to apply more or less compounding in particular cases. This discrepancy is explained by the fact that the texture and detectability metrics do not fully capture the impact of resolution loss on complex structures such as those found in the heart, but an expert observer can integrate all of these features into an assessment. Additionally, the large ROIs used in the quantitative heart study mean that blurring of the endocardial border into the ventricular space would only have a minor impact on the measured quality metrics.
The k-space spatial compounding scheme shown here is one example of the possible compounding implementations and is meant to be representative of varying image quality with subaperture size. The method used in this work uses a fixed subaperture size for the entire image, producing worsening diffraction-limited resolution with increased imaging depth. A more spatially uniform image could be produced using a subaperture growth scheme, performing more compounding shallower in the image and preserving resolution deep in the image. This change would possibly affect assessment of the four clinical tasks and better balance speckle reduction of the LV wall and noise suppression in the chamber with preservation of the resolution of the mitral valve. Similarly, other adaptive schemes could be implemented to vary the amount of spatial compounding throughout the image based on some automated ROI selection or surrogate quality metric. Image processing schemes do this already when they identify speckle regions for smoothing.
One concern with synthetic transmit focusing is the impact of motion on coherent beamforming [37]. In this study, the acquisition time of each frame was minimized to reduce the risk of motion artifact (i.e. destructive interference). Each set of 75 beams (150 including pulse inversion) required 28 ms to acquire, short relative to even the isovolumetric contraction time [38]. However, slight differences were observed between the dynamic receive and synthetically focused images during periods of peak velocity of the mitral valve. The sensitivity of the REFoCUS technique to motion, especially combined with harmonic imaging, is still largely unknown since it relies on a different method of synthetic focusing than virtual source methods and it should be carefully assessed in future work.
A confounding factor in the qualitative assessment study is that the three reviewers all regularly review images from clinical cardiac ultrasound systems that implement speckle reduction techniques. The Duke University Medical Center Department of Cardiology uses both the GE Vivid and Philips EPIQ which apply adaptive post-processing methods to reduce speckle, among other image enhancements. These experienced reviewers have therefore trained to read for anatomical defects, motion abnormalities, and other clinically significant features using images that are most like the “Low” condition and may therefore show a bias in their preferences. This study sought to mitigate these biases using multiple feature-based tasks in addition to the overall assessment.
VI. Conclusions
We have presented both an image metric analysis and expert reviewer study of the trade-off between resolution and speckle texture reduction in cardiac images. Spatial compounding presents one realization of this trade-off that is well-behaved (target independent) and can be adjusted from a single acquisition using synthetic aperture focusing methods. While quantitative metrics suggested that image quality should continue to improve with reduced speckle texture (and degraded lateral resolution), the expert reviewers in most cases found that more than a modest loss in resolution impaired their reading of images across several clinical tasks. However, they indicated strong preference for at least some texture reduction compared to unprocessed images. Adaptive image processing presents another method to achieve such texture reduction with smaller impact on resolution, possibly in combination with spatial compounding or similar processing.
Supplementary Material
Acknowledgments
The authors thank Ned Danieley for technical support and Kristine Arges for study coordination. The authors would also like to thank the reviewers of this work for their valuable feedback.
This work was funded by the Duke-Coulter Translational Partnership and NIH R01-EB026574 from the National Institute of Biomedical Imaging and Bioengineering.
Contributor Information
Nick Bottenus, Department of Mechanical Engineering, University of Colorado Boulder, Boulder, CO. He was previously with the Department of Biomedical Engineering, Duke University, Durham, NC..
Gregg Trahey, Department of Biomedical Engineering and the Department of Radiology, Duke University, Durham, NC..
References
- [1].Chengode S, “Left ventricular global systolic function assessment by echocardiography,” Annals of Cardiac Anaesthesia, vol. 19, no. 5, pp. S26–S34, 2016. [DOI] [PMC free article] [PubMed] [Google Scholar]
- [2].Chirillo F, “Impact of harmonic imaging on transthoracic echocardiographic identification of infective endocarditis and its complications,” Heart, vol. 91, no. 3, pp. 329–333, 2005. [DOI] [PMC free article] [PubMed] [Google Scholar]
- [3].Wagner R, Smith S, Sandrik J, and Lopez H, “Statistics of Speckle in Ultrasound B-Scans,” IEEE Transactions on Sonics and Ultrasonics, vol. 30, no. 3, pp. 156–163, 1983. [Google Scholar]
- [4].Smith SW, Wagner RF, Sandrik JM, and Lopez H, “Low contrast detectability and contrast/detail analysis in medical ultrasound,” IEEE Transactions on Sonics and Ultrasonics, vol. 3, no. 3, pp. 164–173, 1983. [Google Scholar]
- [5].Massay RJ, Logan-Sinclair RB, Bamber JC, and Gibson DG, “Quantitative effects of speckle reduction on cross sectional echocardiographic images,” British Heart J, vol. 62, pp. 298–304, 1989. [DOI] [PMC free article] [PubMed] [Google Scholar]
- [6].Shattuck D and von Ramm O, “Compound scanning with a phased array,” Ultrasonic Imaging, vol. 4, pp. 93–107, 1982. [DOI] [PubMed] [Google Scholar]
- [7].Trahey G, Smith S, and von Ramm O, “Speckle Pattern Correlation with Lateral Aperture Translation: Experimental Results and Implications for Spatial Compounding,” IEEE Transactions on Ultrasonics, Ferroelectrics and Frequency Control, vol. 33, no. 3, pp. 257–264, 1986. [DOI] [PubMed] [Google Scholar]
- [8].O’Donnell M and Silverstein S, “Optimum displacement for compound image generation in medical ultrasound.” IEEE Transactions on Ultrasonics, Ferroelectrics, and Frequency Control, vol. 35, no. 4, 1987. [DOI] [PubMed] [Google Scholar]
- [9].Perperidis A, “Post-processing approaches for the improvement of cardiac ultrasound B-mode images: a review.” IEEE Transactions on Ultrasonics, Ferroelectrics, and Frequency Control, vol. 63, no. 3, pp. 470–485, 2016. [DOI] [PubMed] [Google Scholar]
- [10].Trahey G, Allison JW, Smith SW, Ramm OV, Trahey GE, and Von Ramm OT, “A quantitative approach to speckle reduction via frequency compounding,” Ultrasonic Imaging, vol. 164, no. 3, pp. 151–164, 1986. [DOI] [PubMed] [Google Scholar]
- [11].Loupas T, McDicken WN, and Allan PL, “An Adaptive Weighted Median Filter for Speckle Suppression in Medical Ultrasonic Images,” IEEE Transactions on Circuits and Systems, vol. 36, no. 1, pp. 129–135, 1989. [Google Scholar]
- [12].Pižurica A, Philips W, Lemahieu I, and Acheroy M, “A versatile wavelet domain noise filtration technique for medical imaging,” IEEE Transactions on Medical Imaging, vol. 22, no. 3, pp. 323–331, 2003. [DOI] [PubMed] [Google Scholar]
- [13].Krissian K and Westin C, “Oriented speckle reducing anisotropic diffusion,” IEEE Transactions on Image Processing, vol. 16, no. 5, pp. 1412–1424, 2007. [DOI] [PubMed] [Google Scholar]
- [14].Hyun D, Brickson LL, Looby KT, and Dahl JJ, “Beamforming and speckle reduction using neural networks,” IEEE Transactions on Ultrasonics, Ferroelectrics, and Frequency Control, vol. 66, no. 5, pp. 898–910, 2019. [DOI] [PMC free article] [PubMed] [Google Scholar]
- [15].Bottenus N, LeFevre M, Cleve J, Crowley AL, and Trahey G, “K-space compounding for improved endocardial border detection,” in 2019 IEEE International Ultrasonics Symposium (IUS), 2019, pp. 1294–1297. [Google Scholar]
- [16].Hansen JM and Jensen JA, “Compounding in synthetic aperture imaging,” IEEE Transactions on Ultrasonics, Ferroelectrics, and Frequency Control, vol. 59, no. 9, pp. 2054–2065, 2012. [DOI] [PubMed] [Google Scholar]
- [17].Walker WF and Trahey GE, “The application of k-space in pulse echo ultrasound.” IEEE Transactions on Ultrasonics, Ferroelectrics and Frequency Control, vol. 45, no. 3, pp. 541–558, 1998. [DOI] [PubMed] [Google Scholar]
- [18].Karaman M and O’Donnell M, “Synthetic aperture imaging for small scale systems,” IEEE Transactions on Ultrasonics, Ferroelectrics and Frequency Control, vol. 42, no. 3, pp. 429–442, 1995. [DOI] [PubMed] [Google Scholar]
- [19].Chiao RY and Thomas LJ, “Synthetic transmit aperture imaging using orthogonal Golay coded excitation,” 2000 IEEE Ultrasonics Symposium, pp. 1677–1680, 2000, iSBN: 0780363655. [Google Scholar]
- [20].Misaridis TX and Jensen J. a., “Space-time encoding for high frame rate ultrasound imaging,” Ultrasonics, vol. 40, pp. 593–597, 2002. [DOI] [PubMed] [Google Scholar]
- [21].Harrison T, Samplaleanu A, and Zemp R, “S-sequence spatially-encoded synthetic aperture ultrasound imaging,” IEEE Transactions on Ultrasonics, Ferroelectrics, and Frequency Control, vol. 61, no. 5, pp. 886–890, 2014. [DOI] [PubMed] [Google Scholar]
- [22].Gong P, Kolios MC, and Xu Y, “Delay-encoded transmission and image reconstruction method in synthetic transmit aperture imaging,” IEEE Transactions on Ultrasonics, Ferroelectrics, and Frequency Control, vol. 62, no. 10, pp. 1745–1756, 2015, iSBN: 9781479970490. [DOI] [PubMed] [Google Scholar]
- [23].Thomas JD and Rubin DN, “Tissue harmonic imaging: Why does it work?” Journal of the American Society of Echocardiography, vol. 11, no. 8, pp. 803–808, August. 1998. [DOI] [PubMed] [Google Scholar]
- [24].Pinton GF, Trahey GE, Jeremy J, and Dahl JJ, “Sources of image degradation in fundamental and harmonic ultrasound imaging: a non-linear, full-wave, simulation study.” IEEE Transactions on Ultrasonics, Ferroelectrics, and Frequency Control, vol. 58, no. 6, pp. 1272–83, June. 2011. [DOI] [PMC free article] [PubMed] [Google Scholar]
- [25].Passmann C and Ermert H, “A 100-MHz ultrasound imaging system for dermatologic and ophthalmologic diagnostics,” IEEE Transactions on Ultrasonics Ferroelectrics and Frequency Control, vol. 43, no. July, pp. 545–552, 1996. [Google Scholar]
- [26].Bae M-H and Jeong M-K, “A Study of Synthetic-Aperture Imaging with Virtual Source Elements in B-Mode Ultrasound Imaging Systems,” IEEE Transactions on Ultrasonics, Ferroelectrics and Frequency Control, vol. 47, no. 6, pp. 1510–1519, 2000. [DOI] [PubMed] [Google Scholar]
- [27].Thiele K, Jago J, Entrekin R, and Peterson R, “Exploring nSIGHT Imaging a totally new architecture for premium ultrasound,” Philips Healthcare, Bothell, WA, Tech. Rep, 2013. [Google Scholar]
- [28].Loftman R, “IN Focus Coherent Technology,” Siemens Medical Solutions, USA, Inc., Mountain View, CA, Tech. Rep, 2017. [Google Scholar]
- [29].Nguyen NQ and Prager RW, “High-Resolution Ultrasound Imaging With Unified Pixel-Based Beamforming,” IEEE Transactions on Medical Imaging, vol. 35, no. 1, pp. 98–108, 2016. [DOI] [PubMed] [Google Scholar]
- [30].Bottenus N, “Recovery of the complete data set from focused transmit beams,” IEEE Transactions on Ultrasonics, Ferroelectrics, and Frequency Control, vol. 65, no. 1, pp. 30–38, 2018. [DOI] [PMC free article] [PubMed] [Google Scholar]
- [31].Bottenus N, “Comparison of virtual source synthetic aperture beamforming with an element-based model,” Journal of the Acoustical Society of America, vol. 143, no. April, pp. 2801–2812, 2018. [DOI] [PMC free article] [PubMed] [Google Scholar]
- [32].Bottenus N, “Synthetic recovery of the complete harmonic data set,” Proceedings of SPIE, vol. 10580, no. March, p. 8, 2018, iSBN: 9781510616493. [Google Scholar]
- [33].Averkiou M, “Tissue harmonic imaging,” in 2000 IEEE Ultrasonics Symposium. Proceedings. An International Symposium, vol. 2. San Juan, Puerto Rico: IEEE, 2000, pp. 1563–1572. [Google Scholar]
- [34].Rodriguez-Molares A, Rindal OMH, Dhooge J, Msy S, Austeng A, Bell MAL, and Torp H, “The generalized contrast-to-noise ratio: a formal definition for lesion detectability,” IEEE Transactions on Ultrasonics, Ferroelectrics, and Frequency Control, pp. 1–16, 2019. [DOI] [PMC free article] [PubMed] [Google Scholar]
- [35].Coupe P, Hellier P, Kervrann C, and Barillot C, “Nonlocal means-based speckle filtering for ultrasound images,” IEEE Transactions on Image Processing, vol. 18, no. 10, pp. 2221–2229, October. 2009. [Online]. Available: http://ieeexplore.ieee.org/document/4982678/ [DOI] [PMC free article] [PubMed] [Google Scholar]
- [36].Bottenus N, Byram BC, and Trahey GE, “A synthetic aperture study of aperture size in the presence of noise and in vivo clutter,” in Medical Imaging 2013: Ultrasonic Imaging, Tomography, and Therapy, Bosch JG and Doyley MM, Eds., vol. 8675, International Society for Optics and Photonics. SPIE, 2013, pp. 226–235. [Google Scholar]
- [37].Denarie B, Tangen TA, Ekroll IK, Rolim N, Torp H, Bjastad T, and Lovstakken L, “Coherent plane wave compounding for very high frame rate ultrasonography of rapidly moving targets,” IEEE Transactions on Medical Imaging, vol. 32, no. 7, pp. 1265–1276, 2013, iSBN: 1558–254X (Electronic)$\backslash$n0278–0062 (Linking). [DOI] [PubMed] [Google Scholar]
- [38].Fabian J, Epstein EJ, and Coulshed N, “Duration of phases of left ventricular systole using indirect methods I: Normal subjects,” Heart, vol. 34, no. 9, pp. 874–881, 1972. [DOI] [PMC free article] [PubMed] [Google Scholar]
Associated Data
This section collects any data citations, data availability statements, or supplementary materials included in this article.


