

Abstract
Cognitive function is a substantially heritable trait related to numerous important life outcomes. Several genome-wide association studies of cognitive function have in recent years led to the identification of thousands of significantly associated loci and genes. Individuals included in these studies have rarely been nonagenarians and centenarians, and since cognitive function is an important component of quality of life for this rapidly expanding demographic group, there is a need to explore genetic factors associated with individual differences in cognitive function at advanced ages.
In this study, we pursued this by performing a genome-wide association study of cognitive function in 490 long-lived Danes (age range 90.1–100.8 years). While no genome-wide significant SNPs were identified, suggestively significant SNPs (P < 1×10⁻⁵) were mapped to several interesting genes, including ZWINT, CELF2, and DNAH5, and the glutamate receptor genes GRID2 and GRM7. Additionally, results from a gene set over-representation analysis indicated potential roles of gene sets related to G protein-coupled receptor (GPCR) signaling, interaction between L1 and ankyrins, mitogen-activated protein kinase (MAPK) signaling, RNA degradation, and cell cycle.
Larger studies are needed to shed further light on the possible importance of these suggestive genes and pathways in cognitive function in nonagenarians and centenarians.
Keywords: Cognitive function, long-lived individuals, genome-wide association study, gene-based analysis, pathway analysis
1. Introduction
General cognitive function is a major contributor to economic and health-related life outcomes, and is known to be positively correlated with education, occupational status, income, health, and longevity, among others (Deary, 2012). Thus, understanding the factors that contribute to cognitive function and its underlying biology is of great importance.
Cognitive function is a complex trait affected by both genetic and environmental factors. Twin studies have estimated that the heritability of cognitive function is around 50–80%, increasing from childhood to approximately 65 year of age (Polderman et al., 2015). The heritability after age 65 has been debated, as some studies have shown that the heritability decreases in very old age (Finkel and Reynolds, 2009; Lee et al., 2010), while others have shown that it remains stable (McGue and Christensen, 2013). Regardless, the heritability remains above 50%, indicating a substantial genetic contribution to individual differences in cognitive functioning. In recent years, a number of genome-wide association studies (GWASs) of cognitive function or similar phenotypes, e.g. intelligence, have been published, resulting in identification of thousands of significantly associated genetic loci and genes (e.g. (Davies et al., 2015; Davies et al., 2018; Davies et al., 2016; Davies et al., 2011; Hill et al., 2019; Lam et al., 2017; Savage et al., 2018; Sniekers et al., 2017; Trampush et al., 2017; Xu et al., 2017)). The most recent studies included genome-wide association meta-analyses of general cognitive function and intelligence (Davies et al., 2018; Savage et al., 2018), and a study combining two large GWASs of intelligence and education (Hill et al., 2019). The meta-analysis of general cognitive function by Davies et al. included 300,486 individuals of European ancestry from 57 population-based cohorts and identified 148 significantly associated independent loci, 709 significantly associated genes, and 7 significant gene sets related to neurogenesis, regulation of nervous system development, neuron projection, neuron differentiation, regulation of cell development, and dendrite (Davies et al., 2018). In the meta-analysis of intelligence by Savage et al., including 269,867 individuals from 14 independent epidemiological cohorts of European ancestry, the authors found 205 significantly associated genomic loci, 1,016 significantly associated genes, and 6 significant gene sets: neurogenesis, neuron differentiation, central nervous system neuron differentiation, regulation of nervous system development, positive regulation of nervous system development, and regulation of synapse structure or activity (Savage et al., 2018). In the study of 248,482 individuals by Hill et al., the authors combined a meta-GWAS of intelligence with a GWAS of education (Okbay et al., 2016), resulting in significant associations with 187 loci, 538 genes, and gene sets related to neurogenesis, regulation of nervous system development, regulation of cell development, neuron projection, central nervous system neuron differentiation, synapse, neuron differentiation, and oligodendrocyte differentiation (Hill et al., 2019). While the GWASs of cognitive function and related phenotypes published so far have included impressive numbers of individuals, most participants have been young, middle-aged, and elderly individuals, and thus there is a general lack of studies focusing on more extreme age groups like nonagenarians and centenarians. With an increasingly aging population (Vaupel, 2010), cognitive impairment is a major concern, both for the individual and for society. Retaining cognitive abilities in old age is important for the ability to live independently, and is a key element of successful aging and of quality of life (McGue and Christensen, 2001, 2002). It has also been shown that greater variation is observed for cognitive function in older compared to younger individuals (Harris and Deary, 2011), and that this variation becomes increasingly important with age as the level of cognitive function approaches the threshold required for everyday functioning (Tucker-Drob, 2011). Another aspect is that the selection pressure has been and is markedly different for nonagenarians and centenarians compared to younger individuals. At advanced ages individuals are increasingly subjected to selective mortality, i.e. the most frail and disabled individuals tend to die first, leaving the best functioning individuals in the population (Christensen et al., 2008), and it is therefore possible that different genes influence cognition at different ages as it has been seen for the APOE gene (Davies et al., 2015; Dokkedal et al., 2020) and that the findings of this study may be different from the findings of studies of younger individuals.
Therefore, to explore genetic variants associated with cognitive function among the very old, we performed a GWAS of cognitive function assessed by a cognitive composite score derived from 5 cognitive tests in a homogenous study population of 490 long-lived Danes (mean age 96.8 years, age range 90.1–100.8 years).
2. Materials and Methods
2.1. Study population
The study population consisted of 490 long-lived individuals drawn from four population-based, nation-wide surveys conducted at the University of Southern Denmark: the 1905 birth cohort study (N = 182), the 1910 birth cohort study (N = 128), the 1915 birth cohort study (N = 140), and the Longitudinal Study of Ageing Danish Twins (LSADT, N = 40)). All surveys were without exclusion criteria but required that the participant could provide informed consent. Briefly, the 1905 birth cohort study is an in-depth survey of all Danes born in 1905. The study was initiated in 1998 and follow-up surveys of participating survivors were conducted in 2000, 2003, and 2005. The 1910 and 1915 birth cohort studies include all Danes born in 1910 and 1915, respectively, and alive and living in Denmark on September 1st 2010. The 1915 birth cohort study was followed up in 2015, when participants reached 100 years of age. The 1905, 1910, and 1915 birth cohort studies have been described in more details elsewhere (Rasmussen et al., 2017). From the 1905 and 1915 birth cohort studies, participants for the present study were selected among individuals reaching an age of at least 96 years. However, the blood samples and the applied cognitive scores were collected as part of the intake surveys (for the 1905 birth cohort study either in 1998 at 92–93 years of age or in 2005 at 100 years of age, for the 1910 birth cohort study in 2010 at 100 years of age, and for the 1915 birth cohort study in 2010 at 95 years of age). LSADT includes Danish twins aged 70 years and older and was initiated in 1995 with follow-up surveys carried out in 1997, 1999, 2001, 2003, and 2005 (Pedersen et al., 2019). From LSADT, one individual from each twin pair was randomly selected among participants that had reached an age of at least 90 years, blood samples were collected in 1997, and the applied cognitive score was from the highest age possible/the latest survey (1997 (N = 3), 1999 (N = 2), 2001 (N = 5), 2003 (N = 6), and 2005 (N = 24).
Written informed consents were obtained from all participants. Collection and use of biological material and survey information were approved by the Regional Committees on Health Research Ethics for Southern Denmark, and the study was approved by the Danish Data Protection Agency.
2.2. Cognitive function
Cognitive function was assessed using a five-component cognitive score including tests of verbal fluency, forward and backward digit span, and immediate and delayed recall (McGue and Christensen, 2001). To create the cognitive composite scores, the individual scores of the five tests were standardized using the means and standard deviations obtained in 46–50 year old individuals born from 1949 to 1952, summed and converted into a T-score with a mean of 50 and a standard deviation of 10 in the 46–50 year age group.
To evaluate cognitive impairment among study participants, Mini Mental State Examination (MMSE) scores were included. MMSE ranges from 0 to 30, and individuals with scores between 0 and 17 are graded as severely cognitively impaired, individuals with scores between 18 and 23 as mildly cognitively impaired, and individuals with scores between 24 and 30 as normal/having no cognitive impairment. The MMSE is further described in the previous literature (McGue and Christensen, 2001; Mengel-From et al., 2016).
2.3. Genotyping and quality control
DNA was extracted from whole blood using a manual (Miller et al., 1988) or a semi-automatic (Autopure, Qiagen, Hilden, Germany) salting out method, or from filter cards using the Extract-N-Amp Blood PCR Kit (Sigma Aldrich, St. Louis, MO, USA) followed by amplification using the GenomePlex Complete Whole Genome Amplification (WGA) Kit (Sigma Aldrich, St. Louis, MO, USA).
Samples were genotyped using the Illumina Human OmniExpress Array (Illumina San Diego, CA, USA) following the manufacturer’s protocols. Quality control was carried out in GenomeStudio (Illumina San Diego, CA, USA), Plink (https://www.cog-genomics.org/plink/1.9/) (Chang et al., 2015; Purcell et al., 2007) and R version 3.3.1. Post-genotyping/pre-imputation quality control included filtering SNPs on cluster separation < 0.40, the mean of the normalized theta value of the heterozygote cluster < 0.20 or > 0.80, the mean normalized intensity of the heterozygote cluster < 0.25, call rate < 95%, HWE P < 1×10⁻⁴, and MAF < 1%. In addition, SNPs with a significantly different (P < 1×10⁻⁴) minor allele frequency between individuals with DNA extracted from whole blood and individuals with DNA extracted from filter cards followed by whole genome amplification were excluded. Individuals were excluded based on call rate < 95%, relatedness (1 individual from sample pairs with proportion of IBD > 0.1875) and gender mismatch between genetic and reported gender. Pre-phasing and imputation to the 1000 Genomes phase I v.3 reference panel was performed using IMPUTE2 (Howie et al., 2009). After imputation, genotype probabilities were converted to hard-called genotypes in Plink using a cut-off of 90%, meaning that only genotypes with a probability of more than 90% were called. SNPs with no genotype probabilities above 90% were set to missing. Post-imputation quality control included the removal of insertions and deletions, non-autosomal variants, tri-allelic SNPs, and SNPs with a call rate < 95%, HWE P < 1×10⁻⁵, MAF < 1%, and an imputation quality (INFO) score < 0.80, resulting in 4.827.900 bi-allelic, autosomal SNPs available for analysis.
2.4. Statistical analyses
2.4.1. SNP-based analysis
A SNP-based genome-wide association analysis was performed in Plink (https://www.cog-genomics.org/plink/1.9/) (Chang et al., 2015; Purcell et al., 2007) applying a linear regression model with the cognitive composite score as the dependent variable and the hard-called genotype (assuming an additive model with genotype coded 0, 1, or 2 depending on the number of minor alleles) as the independent variable. Age and sex were included as covariates. As all study participants are ethnic Danes, no adjustment for population stratification was performed. A Bonferroni-corrected significance level of 5×10⁻⁸ was used as the genome-wide significance level, whereas a significance level of 1×10⁻⁵ was used as a suggestive significance level. A post hoc power calculation performed in Quanto (version 1.2.4, http://biostats.usc.edu/Quanto.html) revealed that assuming an additive model and given a N of 490, a minor allele frequency of at least 0.01, a significance level of of 5×10⁻⁸, a mean cognitive composite score and corresponding standard deviation of 27.1 and 9.3, respectively, beta-coefficients of 18.5 and 3.7 could be detected with a power of at least 80% at minor allele frequencies of 0.01 and 0.50.
Manhattan and quantile-quantile (Q-Q) plots (see Figure 1) were created in R using the package qqman.
Figure 1.
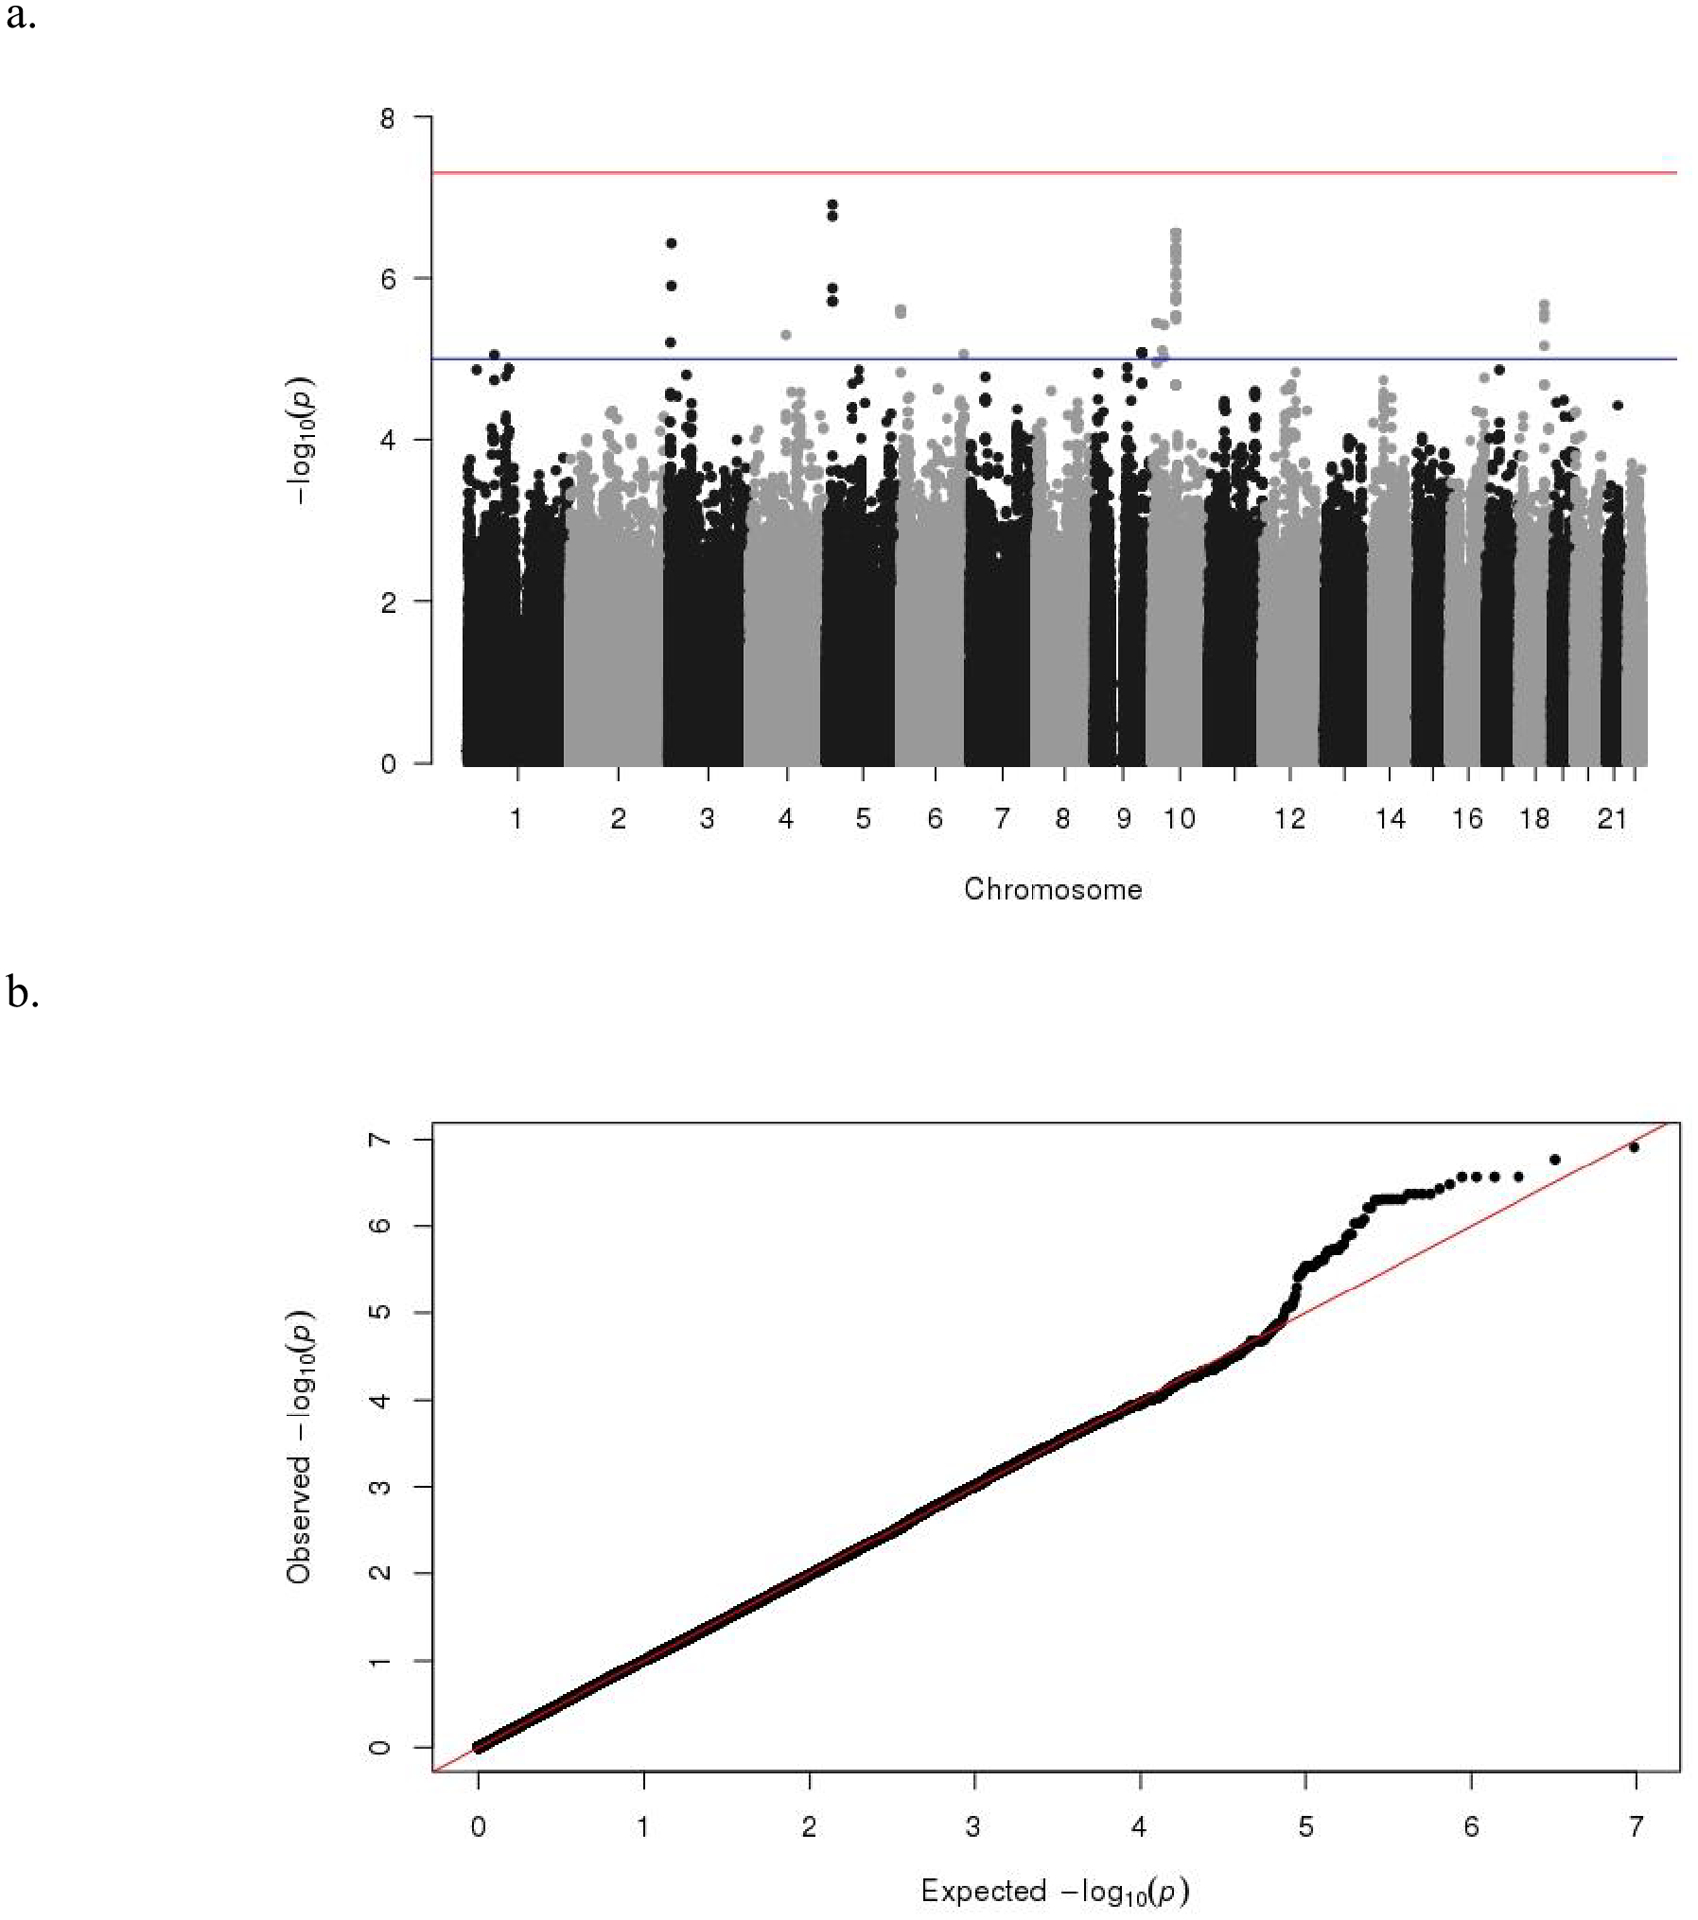
Manhattan (a) and Q-Q (b) plots of P-values of the association between single nucleotide polymorphisms (SNPs) and cognitive function. The threshold for genome-wide significance (P < 5×10⁻⁸) is indicated by the red line and the threshold for suggestive significance (P < 1×10⁻⁵) is indicated by the blue line.
2.4.2. Gene-based analysis
A gene-based analysis was conducted using MAGMA (de Leeuw et al., 2015) as implemented in FUMA v1.3.4 (http://fuma.ctglab.nl/) (Watanabe et al., 2017), which is a web-based platform facilitating functional annotation of GWAS results. Default parameters, including the SNP-wide mean model, were applied along with the 1000G Phase3 EUR reference panel (Genomes Project et al., 2015). To allow for regulatory SNPs to be included in the gene-based analysis, all SNPs located within ±10 kb of a gene were used to derive a P-value for the association between that gene and cognitive function. In total, 18339 protein-coding, autosomal genes defined by the NCBI Build 37.3 were investigated, resulting in a Bonferroni-corrected genome-wide significance threshold of P < 2.73×10⁻⁶.
2.4.3. Gene-set analyses
A gene-set analysis was also performed in MAGMA (de Leeuw et al., 2015) as implemented in FUMA v1.3.4 (http://fuma.ctglab.nl/) (Watanabe et al., 2017) using 10678 curated gene sets and GO terms from MSigDB v6.2 (Liberzon et al., 2011). The MAGMA gene-set analysis is competitive in the sense that it tests if genes within a gene set are more strongly associated with cognitive function than the genes within other gene sets. Bonferroni correction was applied to control for multiple testing.
As the MAGMA gene-set analysis uses the full distribution of gene P-values from the MAGMA gene-based analysis, we additionally performed an over-representation analysis to identify gene sets over-represented only among the nominally significant genes (P < 0.05). Thus, these were submitted to MSigDB (http://software.broadinstitute.org/gsea/msigdb/index.jsp) (Liberzon et al., 2011) using the REACTOME and KEGG databases as reference. A false discovery rate (FDR) < 0.05 was used to identify significant gene sets.
2.4.4. Gene-property analysis
A gene-property analysis was carried out using MAGMA (de Leeuw et al., 2015) as implemented in FUMA v1.3.4 (http://fuma.ctglab.nl/) (Watanabe et al., 2017) to examine the tissue-specificity of cognitive function by testing the correlations between tissue-specific expression profiles and the associations between genes and cognitive function. Gene expression values for 53 specific tissues types were obtained from GTEx v6 (Consortium, 2015), and the full distribution of gene P-values from the MAGMA gene-based analysis was used. The control for multiple testing was done using a Bonferroni correction.
2.4.5. Gene mapping
Prior to gene mapping, independent SNPs, lead SNPs, candidate SNPs, and genomic loci were defined from the results of the SNP-based analysis using FUMA v1.3.4 (http://fuma.ctglab.nl/) (Watanabe et al., 2017). Firstly, independent SNPs were defined as SNPs with P < 1×10⁻⁵ and independent of other suggestively significant SNPs at r2 < 0.6. Secondly, lead SNPs were defined as a subset of the independent SNPs as those that were independent from each other at r2 < 0.1. Thirdly, candidate SNPs were defined as SNPs with a MAF ≥ 0.01 and in LD (r2 ≥ 0.6) with any of the independent SNPs. The candidate SNPs were identified from the 1000G Phase3 EUR reference panel (Genomes Project et al., 2015), and thus they were not necessarily a part of our initially performed GWAS. Only SNPs with a MAF ≥ 0.01 in the 1000G Phase 3 EUR reference panel were included in the annotation, for which reason six of the suggestively significant SNPs (rs17265690, rs114933297, rs141363063, rs148488001, rs192345176, and rs138203943; see Table 2) were not taken into account by FUMA. Finally, genomic loci were defined by merging lead SNP-containing loci less than 250 kb apart, and with the borders of the loci defined by the candidate SNPs. LD patterns and MAFs were deduced from the 1000G Phase3 EUR reference panel (Genomes Project et al., 2015).
Table 2.
Summary statistics for the 65 SNPs associated with cognitive function at a suggestive significance level (P < 1×10⁻⁵). SNP positions and distance to nearest gene are based on the GRCh37/hg19 genome build. Nearest gene refers to nearest RefSeq gene. SNPs identified by FUMA as independent SNPs are highlighted in bold. Independent SNPs in LD with candidate SNPs found to replicate (P < 0.05) are marked with *.
| SNP | Chr | Position | Locus | Ma | MAF | Beta | P | Nearest Gene | Distance |
|---|---|---|---|---|---|---|---|---|---|
| rs17265690 | 5 | 13816888 | 5p15.2 | G | 0.0138 | 13.63 | 1.22E-07 | DNAH5 | 0 (intron) |
| rs114012368 | 5 | 13845391 | 5p15.2 | G | 0.0153 | 11.14 | 1.70E-07 | DNAH5 | 0 (intron) |
| rs187473706* | 10 | 58207108 | 10q21.1 | A | 0.1277 | −4.579 | 2.73E-07 | ZWINT | 86074 |
| rs4405235 | 10 | 58103101 | 10q21.1 | G | 0.1313 | −4.577 | 2.74E-07 | ZWINT | 14098 |
| rs11005326 | 10 | 58117124 | 10q21.1 | G | 0.1313 | −4.577 | 2.74E-07 | ZWINT | 75 |
| rs11005338 | 10 | 58125900 | 10q21.1 | G | 0.1313 | −4.577 | 2.74E-07 | ZWINT | 4866 |
| rs11005320 | 10 | 58096959 | 10q21.1 | C | 0.1319 | −4.564 | 3.32E-07 | ZWINT | 20240 |
| rs28502528 | 3 | 7210895 | 3p26.1 | G | 0.3073 | 3.391 | 3.74E-07 | GRM7 | 0 (intron) |
| rs58796432 | 10 | 58208170 | 10q21.1 | T | 0.1304 | −4.493 | 4.30E-07 | ZWINT | 87136 |
| rs11005358 | 10 | 58209898 | 10q21.1 | A | 0.1304 | −4.493 | 4.30E-07 | ZWINT | 88864 |
| rs74137635 | 10 | 58210671 | 10q21.1 | C | 0.1304 | −4.493 | 4.30E-07 | ZWINT | 89583 |
| rs12266849 | 10 | 58218034 | 10q21.1 | G | 0.1304 | −4.493 | 4.30E-07 | ZWINT | 97000 |
| rs12257459 | 10 | 58208672 | 10q21.1 | G | 0.1303 | −4.487 | 4.94E-07 | ZWINT | 87638 |
| rs2087837 | 10 | 58222830 | 10q21.1 | A | 0.1303 | −4.487 | 4.94E-07 | ZWINT | 101796 |
| rs11005363 | 10 | 58237680 | 10q21.1 | C | 0.1302 | −4.487 | 4.94E-07 | ZWINT | 116646 |
| rs58386275 | 10 | 58241470 | 10q21.1 | C | 0.1301 | −4.487 | 4.94E-07 | ZWINT | 120436 |
| rs11005366 | 10 | 58242596 | 10q21.1 | T | 0.1301 | −4.487 | 4.94E-07 | ZWINT | 121562 |
| rs4935645 | 10 | 58021087 | 10q21.1 | C | 0.1391 | −4.405 | 5.04E-07 | ZWINT | 96112 |
| rs2393046 | 10 | 58023980 | 10q21.1 | T | 0.1388 | −4.405 | 5.04E-07 | ZWINT | 93219 |
| rs74137642 | 10 | 58243119 | 10q21.1 | G | 0.1306 | −4.427 | 6.16E-07 | ZWINT | 122085 |
| rs7091142 | 10 | 58244433 | 10q21.1 | T | 0.1306 | −4.427 | 6.16E-07 | ZWINT | 123399 |
| rs141232317 | 10 | 58206613 | 10q21.1 | T | 0.1208 | −4.453 | 8.32E-07 | ZWINT | 85579 |
| rs2263916 | 10 | 58161893 | 10q21.1 | G | 0.1317 | −4.386 | 9.30E-07 | ZWINT | 40859 |
| rs10763369 | 10 | 58175630 | 10q21.1 | A | 0.1315 | −4.386 | 9.30E-07 | ZWINT | 54596 |
| rs10733958 | 10 | 58179399 | 10q21.1 | G | 0.1315 | −4.386 | 9.30E-07 | ZWINT | 58365 |
| rs1516302 | 3 | 7208953 | 3p26.1 | A | 0.3005 | 3.199 | 1.24E-06 | GRM7 | 0 (intron) |
| rs11005287 | 10 | 58024579 | 10q21.1 | A | 0.1378 | −4.246 | 1.24E-06 | ZWINT | 92620 |
| rs114240283 | 5 | 13799563 | 5p15.2 | A | 0.0148 | 11.63 | 1.33E-06 | DNAH5 | 0 (intron) |
| rs12264147 | 10 | 58025087 | 10q21.1 | T | 0.1387 | −4.187 | 1.62E-06 | ZWINT | 92112 |
| rs2393054 | 10 | 58056974 | 10q21.1 | C | 0.1395 | −4.167 | 1.66E-06 | ZWINT | 60225 |
| rs12257337 | 10 | 58062019 | 10q21.1 | T | 0.1390 | −4.146 | 1.86E-06 | ZWINT | 55180 |
| rs7099218 | 10 | 58067127 | 10q21.1 | C | 0.1390 | −4.146 | 1.86E-06 | ZWINT | 50072 |
| rs12255620 | 10 | 58076723 | 10q21.1 | G | 0.1387 | −4.146 | 1.86E-06 | ZWINT | 40476 |
| rs73280169 | 10 | 58077515 | 10q21.1 | T | 0.1388 | −4.146 | 1.86E-06 | ZWINT | 39684 |
| rs114740310 | 5 | 13870802 | 5p15.2 | T | 0.0144 | 11.17 | 1.92E-06 | DNAH5 | 0 (intron) |
| rs114933297 | 5 | 13874625 | 5p15.2 | T | 0.0145 | 11.17 | 1.92E-06 | DNAH5 | 0 (intron) |
| rs595286 | 18 | 60280097 | 18q21.33 | G | 0.4679 | −2.964 | 2.10E-06 | ZCCHC2 | 26121 |
| rs9392881 | 6 | 791124 | 6p25.3 | G | 0.1214 | −4.441 | 2.42E-06 | LOC101927691 | 77374 |
| rs9392150 | 6 | 791318 | 6p25.3 | A | 0.1211 | −4.421 | 2.46E-06 | LOC101927691 | 77180 |
| rs62384998 | 6 | 791566 | 6p25.3 | C | 0.1212 | −4.426 | 2.47E-06 | LOC101927691 | 76932 |
| rs7763687 | 6 | 791850 | 6p25.3 | T | 0.1212 | −4.426 | 2.47E-06 | LOC101927691 | 76648 |
| rs306213 | 18 | 60291954 | 18q21.33 | A | 0.3434 | −3.146 | 2.67E-06 | ZCCHC2 | 37978 |
| rs62385000 | 6 | 792759 | 6p25.3 | A | 0.1214 | −4.432 | 2.79E-06 | LOC101927691 | 75739 |
| rs11005317 | 10 | 58088163 | 10q21.1 | G | 0.1407 | −4.021 | 2.90E-06 | ZWINT | 29036 |
| rs3750796 | 10 | 58088534 | 10q21.1 | G | 0.1407 | −4.021 | 2.90E-06 | ZWINT | 28665 |
| rs7094892 | 10 | 58088575 | 10q21.1 | T | 0.1407 | −4.021 | 2.90E-06 | ZWINT | 28624 |
| rs2393065 | 10 | 58089291 | 10q21.1 | C | 0.1407 | −4.021 | 2.90E-06 | ZWINT | 27908 |
| rs9971280 | 10 | 58090264 | 10q21.1 | C | 0.1406 | −4.021 | 2.90E-06 | ZWINT | 26935 |
| rs59704796 | 10 | 58090554 | 10q21.1 | C | 0.1406 | −4.021 | 2.90E-06 | ZWINT | 26645 |
| rs637216 | 18 | 60282910 | 18q21.33 | G | 0.4677 | −2.919 | 3.18E-06 | ZCCHC2 | 28934 |
| rs3750795 | 10 | 58088644 | 10q21.1 | G | 0.1403 | −4.012 | 3.30E-06 | ZWINT | 28555 |
| rs72773940 | 10 | 11148581 | 10p14 | T | 0.0287 | −8.131 | 3.58E-06 | CELF2 | 0 (intron) |
| rs117481327 | 10 | 11154826 | 10p14 | G | 0.0293 | −8.121 | 3.61E-06 | CELF2 | 0 (intron) |
| rs2016129* | 10 | 29288295 | 10p12.1 | T | 0.0682 | 5.091 | 3.84E-06 | C10orf126 | 117468 |
| rs114594327 | 4 | 91942029 | 4q22.1 | T | 0.0268 | 7.955 | 5.09E-06 | CCSER1 | 0 (intron) |
| rs74897566 | 3 | 5083637 | 3p26.1 | C | 0.0196 | 10.88 | 6.29E-06 | BHLHE40 | 56771 |
| rs306216 | 18 | 60295543 | 18q21.33 | G | 0.3009 | −3.131 | 6.92E-06 | ZCCHC2 | 41567 |
| rs1556397* | 10 | 24851710 | 10p12.1 | A | 0.3311 | −2.923 | 7.86E-06 | KIAA1217 | 14938 |
| rs141363063 | 9 | 116670492 | 9q32 | T | 0.0110 | 11.55 | 8.44E-06 | ZNF618 | 0 (intron) |
| rs148488001 | 9 | 116691092 | 9q32 | G | 0.0110 | 11.55 | 8.44E-06 | ZNF618 | 0 (intron) |
| rs192345176 | 9 | 116700201 | 9q32 | G | 0.0109 | 11.55 | 8.44E-06 | ZNF618 | 0 (intron) |
| rs138203943 | 9 | 116704225 | 9q32 | A | 0.0109 | 11.55 | 8.44E-06 | ZNF618 | 0 (intron) |
| rs56139919* | 6 | 155914380 | 6q25.3 | A | 0.0207 | 8.531 | 8.72E-06 | LOC105378068 | 67228 |
| rs489500 | 1 | 65525901 | 1p31.3 | G | 0.0139 | 9.476 | 8.94E-06 | JAK1 | 0 (intron) |
| rs11007349 | 10 | 29287378 | 10p12.1 | T | 0.0674 | 5.102 | 9.50E-06 | C10orf126 | 116551 |
The identified candidate SNPs were mapped to genes in FUMA using three strategies: 1) positional mapping, where SNPs were mapped to genes based on physical distance (+/− 10 kb); 2) expression quantitative trait loci (eQTL) mapping, where SNPs were mapped to genes with which the SNPs showed a significant (FDR < 0.05) eQTL association (i.e. allelic variation at the SNP is associated with the expression level of that gene); 3) chromatin interaction mapping, where SNPs were mapped to genes when there is a significant (FDR < 1×10⁻⁶) 3D DNA-DNA interaction between the SNP region and the gene region.
2.5. Verification
Verification of the results of the SNP-based analysis (independent SNPs and candidate SNPs as defined in the section ‘Gene mapping’) was sought by in silico look-up in the results of the already published meta-GWASs on general cognitive function (Davies et al., 2018) and intelligence (Savage et al., 2018), and in the results of the study combining GWASs of intelligence and education (Hill et al., 2019). For the studies by Hill et al. and Davies et al., information was only available for genome-wide significant (P < 5×10⁻⁸) and suggestively significant (P < 1×10⁻⁵) SNPs, respectively, and therefore the replication was primarily based on the results of the study by Savage et al. where summary statistics were available for all SNPs included in the study.
2.6. Replication of results of previous studies
Replication of previously reported genome-wide significant findings was sought in the present study by comparing the results of the SNP- and gene-based analyses to the findings of the meta-GWASs published by Davies et al. (Davies et al., 2018), Savage et al. (Savage et al., 2018), and Hill et al. (Hill et al., 2019).
3. Results
Study population characteristics are shown in Table 1. Notably, the study population of long-lived individuals had a mean cognitive score of 27.1, corresponding to more than 2 SDs lower than the average score for 46–50 year old individuals born from 1949–1952, indicating, as expected, a clear cross-sectional age-related decline in cognitive function. The cognitive score range of 4.1 to 63.9 (IQR 20.6–32.6) reveals that there is substantial variation among the study population participants.
Table 1.
Study population characteristics.
| N | 490 |
| N Women (%) | 383 (78.2) |
| Age, mean (SD)* | 96.8 (3.1) |
| Age, range* | 90.1–100.8 |
| Birth Year, range | 1901–1915 |
| Cognitive Score, mean (SD) | 27.1 (9.3) |
| Cognitive Score, range | 4.1–63.9 |
| N with severe cognitive impairment, MMSE 0–17 (%) | 78 (15.9) |
| N with mild cognitive impairment, MMSE 18–23 (%) | 169 (34.6) |
| N with no cognitive impairment, MMSE 24–30 (%) | 242 (49.5) |
Age at cognitive assessment.
No genome-wide significant (P < 5×10⁻⁸) SNPs were identified in the SNP-based association analysis. However, 65 SNPs (see Table 2) were found to associate with cognitive function at a suggestive significance level (P < 1×10⁻⁵). Manhattan- and QQ-plots for the SNP-based association analysis are shown in Figure 1. According to the genomic loci characterization implemented in FUMA, the 65 SNPs represent 14 independent signals distributed across 12 genomic loci on chromosomes 1, 3, 4, 5, 6, 10, and 18.
The MAGMA gene-based (see Supplementary Table 1), gene-set (see Supplementary Table 2) and gene-property analyses did not reveal any significant results. Interestingly, however, a striking tendency was seen in the gene-property analysis results where the 10 tissue-specific expression profiles most correlated with the results of the gene-based analysis were of various parts of the brain (see Figure 2). Also, the MSigDB over-representation analysis of the nominally significant genes identified in the MAGMA gene-based analysis, revealed significant enrichment (FDR < 0.05) for gene sets related to G protein-coupled receptor (GPCR) signaling (the Reactome gene sets ‘Signaling by GPCR’, ‘GPCR ligand binding’, ‘Class A/1 (Rhodopsin-like receptors)’, ‘GPCR downstream signaling’, ‘Peptide ligand-binding receptors’, and ‘G alpha (12/13) signaling events’), interaction between L1 and ankyrins, mitogen-activated protein kinase (MAPK) signaling, RNA degradation, and cell cycle (see Table 3).
Figure 2.

Results of the gene-property analysis carried out using MAGMA examining the correlations between tissue-specific expression profiles for 53 specific tissues types obtained from GTEx v6 and the associations between genes and cognitive function.
Table 3.
Significant (FDR < 0.05) gene sets identified in the MSigDB over-representation analysis using the REACTOME and KEGG databases as reference.
| Gene set | # Genes in gene set (K) | # Genes in overlap (k) | k/K | P | FDR q-value |
|---|---|---|---|---|---|
| REACTOME_SIGNALING_BY_GPCR | 920 | 42 | 0.0457 | 8.24E-9 | 4.22E-6 |
| REACTOME_GPCR_LIGAND_BINDING | 408 | 26 | 0.0637 | 9.81E-9 | 4.22E-6 |
| REACTOME_CLASS_A1_RHODOPSIN_LIKE_RECEPTORS | 305 | 21 | 0.0689 | 6.98E-8 | 2.00E-5 |
| REACTOME_GPCR_DOWNSTREAM_SIGNALING | 805 | 33 | 0.0410 | 3.38E-6 | 7.26E-4 |
| REACTOME_PEPTIDE_LIGAND_BINDING_RECEPTORS | 188 | 14 | 0.0745 | 4.22E-6 | 7.26E-4 |
| REACTOME_INTERACTION_BETWEEN_L1_AND_ANKYRINS | 23 | 5 | 0.2174 | 3.48E-5 | 4.30E-3 |
| REACTOME_G_ALPHA1213_SIGNALLING_EVENTS | 74 | 8 | 0.1081 | 3.50E-5 | 4.30E-3 |
| KEGG_MAPK_SIGNALING_PATHWAY | 267 | 15 | 0.0562 | 5.51E-5 | 5.66E-3 |
| KEGG_RNA_DEGRADATION | 59 | 7 | 0.1186 | 5.92E-5 | 5.66E-3 |
| REACTOME_CELL_CYCLE | 421 | 19 | 0.0451 | 1.16E-4 | 9.99E-3 |
Using the gene mapping strategies implemented in FUMA, the suggestively significant SNPs were found to map to 60 unique genes; 6 were identified through positional mapping, 4 were identified through eQTL mapping, and 54 were identified through chromatin interaction mapping (see Supplementary Table 3). Two genes, CELF2 and DNAH5, were identified by two mapping strategies, and one gene, ZWINT, was identified by all three strategies.
Independent SNPs and candidate SNPs identified based on the independent SNPs were sought verified by in silico look-up in three recent meta-GWASs of general cognitive function and intelligence. Overall, 9.7% (P = 7 ×10⁻⁴) of the independent and candidate SNPs were verified (same direction of effect and P < 0.05). The verified SNPs were candidate SNPs identified based on four of the independent SNPs (rs187473706, rs2016129, rs1556397, and rs56139919 on chromosomes 6 and 10; see Table 2).
Replication of genome-wide significant SNP- and gene-based findings previously published in GWASs of general cognitive function and intelligence, revealed that of the genome-wide significant SNPs identified in the studies by Davies et al. 2018, Savage et al. 2018, and Hill et al. 2019, 55.0%, 72.4%, and 72.8%, respectively, were available in the present study, and 5.1%, 4.9%, and 4.4% of these replicated (P < 0.05). When restricting to SNPs showing the same direction of effect, 2.6% and 2.4% of the genome-wide significant SNPs from the studies by Savage et al. 2018 and Hill et al. 2019 replicated in our study. Unfortunately, the publicly available data from the Davies et al. 2018 study did not allow a straightforward evaluation of direction of effect. Between 5.1% and 6.5% of the genome-wide significant results of gene-based analyses were found to replicate in the present study.
4. Discussion
To further our understanding of the underlying biology of the genetic component of cognitive function among nonagenarians and centenarians, we carried out a genome-wide association study of cognitive function in 490 long-lived Danes.
While the SNP-based association analysis in the present study did not reveal any genome-wide significant findings, a number of SNPs with a suggestively significant association to cognitive function among the very old were identified. Based on the independent SNPs identified from these suggestively significant SNPs and the derived candidate SNPs, 60 genes were found to be implicated in cognitive function using three gene mapping strategies; positional mapping, eQTL mapping, and chromatin interaction mapping (see Supplementary Table 3). The ZWINT gene was identified by all three mapping strategies, while CELF2 and DNAH5 were identified by positional mapping and chromatin interaction mapping. The ZWINT gene encodes the ZW10 interacting kinetochore protein, which regulates centromere division and was recently suggested as a potential target for lung cancer therapy (Peng et al., 2019). The role of ZWINT in cognitive function is thus less clear, although the protein encoded by ZWINT is reported by the Biological General Repository for Interaction Datasets (BioGRID; https://thebiogrid.org) (Oughtred et al., 2019) to interact with the products of the APP and CLU genes that are well-known in relation to Alzheimer’s disease and cognitive function (Kunkle et al., 2019). Similarly, the CELF2 gene product, the CUGBP Elav-like family member 2 protein, has been found to interact with the APP gene product (BioGRID; https://thebiogrid.org) (Oughtred et al., 2019). In addition, CELF2 is highly expressed in the brain (Li et al., 2001) and genetic variants in CELF2 have been found to be involved in late-onset Alzheimer’s disease in APOE ε4 homozygotes (Wijsman et al., 2011), as well as significantly associated with educational attainment, cognitive function, and mathematical ability (Kichaev et al., 2019; Lee et al., 2018). The DNAH5 gene encodes an axonemal dynein heavy chain protein, which is part of a microtubule-associated motor protein complex in motile cilia (Zariwala et al., 2007), and plays a role in primary ciliary dyskinesia that is characterized by abnormal ciliary motility and affects the lungs, reproductive organs, and organ laterality (Olbrich et al., 2002; Zariwala et al., 2007). Of more relevance, DNAH5 has also been suggested to play a role in mathematical ability (Docherty et al., 2010).
In addition, the mapped genes include CCSER1, TFB1M, KIAA1217, PDE4B, NOX3, ARID1B, ZCCHC2, ECHDC3, and LYZL1 that have all been implicated in Alzheimer’s disease, educational attainment, cognitive function, mathematical ability, and/or intelligence (Davies et al., 2018; Hill et al., 2019; Jun et al., 2017; Kichaev et al., 2019; Lee et al., 2018; Savage et al., 2018; Witoelar et al., 2018); the DUSP22 gene, which has been found to be down-regulated in the hippocampus of Alzheimer’s disease patients and is suggested to be important for Tau phosphorylation and CREB signaling (Sanchez-Mut et al., 2014); the BCL2 gene, which encodes an anti-apoptotic protein suggested to link autophagy and Alzheimer’s disease (Uddin et al., 2018); GRID2 that encodes the glutamate ionotropic receptor delta type subunit 2 protein, which is expressed selectively in cerebellar Purkinje cells (Araki et al., 1993), and GRM7 that encodes the glutamate metabotropic receptor 7 protein, which is expressed in many brain tissues, in particular in the hippocampus, cerebral cortex, and cerebellum (Makoff et al., 1996). Both ionotropic and metabotropic glutamate receptors are activated by glutamate. Glutamate is the major excitatory neurotransmitter in the central nervous system, and glutamatergic neurotransmission is involved in most aspects of normal brain function. Ionotropic glutamate receptors are ligand-gated ion channels that produce excitatory currents upon activation by glutamate, while metabotropic glutamate receptors are G protein-coupled receptors (GPCRs) that control cellular processes through G protein signaling cascades (Reiner and Levitz, 2018). A number of GWASs have found GRID2 to be involved in educational attainment, intelligence and cognitive function (Hill et al., 2019; Kichaev et al., 2019; Lee et al., 2018; Savage et al., 2018), whereas GRM7 was recently suggested as a novel gene significantly associated with Alzheimer’s disease (Squillario et al., 2020).
The role of GPCRs in cognitive function in nonagenarians and centenarians was further supported by the gene set over-representation analysis. Using the list of genes found to associate with cognitive function among nonagenarians and centenarians at a nominal significance level from the MAGMA gene-based analysis, the analysis identified several significantly over-represented gene sets related to GPCR signaling. The GPCRs comprise the largest family of transmembrane proteins in humans and share a common structure of seven transmembrane helical regions. Roughly 50% of GPCRs have sensory functions, and around 90% of the non-sensory GPCRs are expressed in the brain, where they play important roles in numerous neuronal functions, including regulation of neuronal communication at the synapse (Huang and Thathiah, 2015) as well as structural and synaptic plasticity, which have been associated with learning and memory and thereby cognitive function (Leung and Wong, 2017). Furthermore, GPCRs have been implicated in a number of neurodegenerative diseases like Alzheimer’s disease, vascular dementia, frontotemporal dementia, Parkinson’s disease, and Huntington’s disease (Huang et al., 2017). Interestingly, the Reactome gene set ‘Interaction between L1 and Ankyrins’ was also among the gene sets in which genes associated with cognitive function at a nominal significance level were significantly over-represented. L1-type proteins are transmembrane cell adhesion molecules (CAMs) that play important roles in several neural processes, including axonal formation, growth and branching, synapse development, and regulation of synaptic plasticity (Skaper, 2012). Several of these processes might be regulated by interaction between L1-type CAMs and ankyrins (Hortsch et al., 2009).
The ‘G alpha (12/13) signaling events’ pathway replicated at a nominal significance level (P < 0.05) in the study by Davies et al. (Davies et al., 2018), and the more generic pathways ‘MAPK signaling pathway’ and ‘Cell cycle’ both replicated in at least two of the studies by Davies et al., Hill et al., or Savage et al. (Davies et al., 2018; Hill et al., 2019; Savage et al., 2018).
Using a Bonferroni-corrected significance level threshold, which is the default in the MAGMA gene-set analysis performed as part of FUMA, no gene sets were found to be significant. However, in connection with another gene-set analysis algorithm it has been argued that using a Bonferroni-corrected significance level is too stringent as the gene sets are not independent. Instead, a significance level of P < 1×10⁻⁵ has been suggested to be sufficient to ensure no inflation of the type 1 error rate (Mishra and Macgregor, 2015). Using this significance level, one gene set, the ‘hirsch cellular transformation signature dn’ gene set (Hirsch et al., 2010) was found to be significantly associated with cognitive function (see Supplementary Table 2). This gene set was previously found to be associated with general cognitive function and intelligence with the same direction of effect as seen in this study at a nominal significance level in the studies by Davies et al. and Hill et al. (Davies et al., 2018; Hill et al., 2019).
In addition to uncovering several suggestive findings of the genetic basis of cognitive function among long-lived individuals, the present study also added support for several previously reported associations. While this suggests that there is overlap between the genetic contribution to cognitive function in younger and long-lived individuals, the proportion of replicated findings (around 5%) is somewhat smaller than in other studies (typically more than 10%), which is likely to be explained by differences, primarily in the age of the study populations, but potentially also in degree of genetic homogeneity, phenotypes and analysis methods.
This study has some methodological limitations that should be taken into account when considering the significance and generalizability of the results. First, the sample size is limited, which means that the power, especially in the SNP-based association analysis, is challenged and thus chance findings cannot be excluded. However, a quite sizeable percentage (nearly 10%) of the independent and candidate SNPs were in silico verified in large and well-powered studies and also, the gene-property analysis results showed a clear tendency as the 10 tissue-specific expression profiles most correlated with the results of the gene-based analysis were from various parts of the brain (see Figure 2). These results support the biological importance of our findings, despite the general lack of statistical significance. Second, the individuals included in this study are selected in the sense that individuals with severe cognitive impairment are likely to have been represented among those without a cognitive assessment. This is supported by the proportion of study participants with MMSE scores between 0 and 17 (15.9%, see Table 1) being lower than among all participants in the 1905 birth cohort study (22% and 39.2% with severe cognitive impairment at age 92–93 and 100, respectively (Christensen et al., 2013; Engberg et al., 2008) and the 1915 birth cohort study (17% with severe cognitive impairment at age 95 (Christensen et al., 2013)). In addition, individuals donating a blood sample, and who can hence be included in genetic studies, have a higher functional level than those not donating a blood sample (Mengel-From et al., 2011). However, if anything, these limitations and biases are likely to attenuate the association between genetic variants and cognitive function, and thus make it harder to find significant associations, which increase the confidence in our significant findings.
In conclusion, this study presents suggestive evidence that several genes and gene sets implicated in neurological and brain-related processes, especially G protein-coupled receptor signaling, contribute to variation in cognitive function among long-lived individuals. We acknowledge the limited size of the study, and consequently conclude that larger studies of nonagenarians and centenarians are needed to validate the findings of this study, with the overall goal of clarifying if the genetic landscape of cognitive function in long-lived individuals diverges from that found in predominantly younger individuals, and providing new insight into the genetic background of cognitive aging.
Supplementary Material
Highlights.
A significant role in cognition of gene sets related to GPCR signaling is found
Other significant gene sets are found, e.g. interaction between L1 and ankyrins
Suggestively significant SNPs are mapped to several interesting genes
These include ZWINT, CELF2, DNAH5, and the glutamate receptor genes GRID2 and GRM7
Acknowledgements
This study was financially supported by The National Program for Research Infrastructure 2007 (grant no. 09-063256), the Danish Agency for Science Technology and Innovation, the Velux Foundation, the US National Institute of Health (P01 AG08761), the Danish Agency for Science, Technology and Innovation/The Danish Council for Independent Research (grant no. 11-107308), The Danish Interdisciplinary Research Council, the European Union’s Seventh Framework Programme (FP7/2007-2011) under grant agreement n° 259679, and the INTERREG 4 A programme Syddanmark-Schleswig-K.E.R.N. (by EU funds from the European Regional Development Fund).
Footnotes
Publisher's Disclaimer: This is a PDF file of an unedited manuscript that has been accepted for publication. As a service to our customers we are providing this early version of the manuscript. The manuscript will undergo copyediting, typesetting, and review of the resulting proof before it is published in its final form. Please note that during the production process errors may be discovered which could affect the content, and all legal disclaimers that apply to the journal pertain.
Conflicts of Interest
The authors declare no conflicts of interest.
References
- Araki K, Meguro H, Kushiya E, Takayama C, Inoue Y, Mishina M, 1993. Selective expression of the glutamate receptor channel delta 2 subunit in cerebellar Purkinje cells. Biochem Biophys Res Commun 197(3), 1267–1276. [DOI] [PubMed] [Google Scholar]
- Chang CC, Chow CC, Tellier LC, Vattikuti S, Purcell SM, Lee JJ, 2015. Second-generation PLINK: rising to the challenge of larger and richer datasets. Gigascience 4, 7. [DOI] [PMC free article] [PubMed] [Google Scholar]
- Christensen K, McGue M, Petersen I, Jeune B, Vaupel JW, 2008. Exceptional longevity does not result in excessive levels of disability. Proc Natl Acad Sci U S A 105(36), 13274–13279. [DOI] [PMC free article] [PubMed] [Google Scholar]
- Christensen K, Thinggaard M, Oksuzyan A, Steenstrup T, Andersen-Ranberg K, Jeune B, McGue M, Vaupel JW, 2013. Physical and cognitive functioning of people older than 90 years: a comparison of two Danish cohorts born 10 years apart. Lancet 382(9903), 1507–1513. [DOI] [PMC free article] [PubMed] [Google Scholar]
- Consortium G, 2015. The Genotype-Tissue Expression (GTEx) pilot analysis: multitissue gene regulation in humans. Science 348(6235), 648–660. [DOI] [PMC free article] [PubMed] [Google Scholar]
- Davies G, Armstrong N, Bis JC, Bressler J, Chouraki V, Giddaluru S, Hofer E, Ibrahim-Verbaas CA, Kirin M, Lahti J, van der Lee SJ, Le Hellard S, Liu T, Marioni RE, Oldmeadow C, Postmus I, Smith AV, Smith JA, Thalamuthu A, Thomson R, Vitart V, Wang J, Yu L, Zgaga L, Zhao W, Boxall R, Harris SE, Hill WD, Liewald DC, Luciano M, Adams H, Ames D, Amin N, Amouyel P, Assareh AA, Au R, Becker JT, Beiser A, Berr C, Bertram L, Boerwinkle E, Buckley BM, Campbell H, Corley J, De Jager PL, Dufouil C, Eriksson JG, Espeseth T, Faul JD, Ford I, Generation S, Gottesman RF, Griswold ME, Gudnason V, Harris TB, Heiss G, Hofman A, Holliday EG, Huffman J, Kardia SL, Kochan N, Knopman DS, Kwok JB, Lambert JC, Lee T, Li G, Li SC, Loitfelder M, Lopez OL, Lundervold AJ, Lundqvist A, Mather KA, Mirza SS, Nyberg L, Oostra BA, Palotie A, Papenberg G, Pattie A, Petrovic K, Polasek O, Psaty BM, Redmond P, Reppermund S, Rotter JI, Schmidt H, Schuur M, Schofield PW, Scott RJ, Steen VM, Stott DJ, van Swieten JC, Taylor KD, Trollor J, Trompet S, Uitterlinden AG, Weinstein G, Widen E, Windham BG, Jukema JW, Wright AF, Wright MJ, Yang Q, Amieva H, Attia JR, Bennett DA, Brodaty H, de Craen AJ, Hayward C, Ikram MA, Lindenberger U, Nilsson LG, Porteous DJ, Raikkonen K, Reinvang I, Rudan I, Sachdev PS, Schmidt R, Schofield PR, Srikanth V, Starr JM, Turner ST, Weir DR, Wilson JF, van Duijn C, Launer L, Fitzpatrick AL, Seshadri S, Mosley TH Jr., Deary IJ, 2015. Genetic contributions to variation in general cognitive function: a meta-analysis of genome-wide association studies in the CHARGE consortium (N=53949). Molecular psychiatry 20(2), 183–192. [DOI] [PMC free article] [PubMed] [Google Scholar]
- Davies G, Lam M, Harris SE, Trampush JW, Luciano M, Hill WD, Hagenaars SP, Ritchie SJ, Marioni RE, Fawns-Ritchie C, Liewald DCM, Okely JA, Ahola-Olli AV, Barnes CLK, Bertram L, Bis JC, Burdick KE, Christoforou A, DeRosse P, Djurovic S, Espeseth T, Giakoumaki S, Giddaluru S, Gustavson DE, Hayward C, Hofer E, Ikram MA, Karlsson R, Knowles E, Lahti J, Leber M, Li S, Mather KA, Melle I, Morris D, Oldmeadow C, Palviainen T, Payton A, Pazoki R, Petrovic K, Reynolds CA, Sargurupremraj M, Scholz M, Smith JA, Smith AV, Terzikhan N, Thalamuthu A, Trompet S, van der Lee SJ, Ware EB, Windham BG, Wright MJ, Yang J, Yu J, Ames D, Amin N, Amouyel P, Andreassen OA, Armstrong NJ, Assareh AA, Attia JR, Attix D, Avramopoulos D, Bennett DA, Bohmer AC, Boyle PA, Brodaty H, Campbell H, Cannon TD, Cirulli ET, Congdon E, Conley ED, Corley J, Cox SR, Dale AM, Dehghan A, Dick D, Dickinson D, Eriksson JG, Evangelou E, Faul JD, Ford I, Freimer NA, Gao H, Giegling I, Gillespie NA, Gordon SD, Gottesman RF, Griswold ME, Gudnason V, Harris TB, Hartmann AM, Hatzimanolis A, Heiss G, Holliday EG, Joshi PK, Kahonen M, Kardia SLR, Karlsson I, Kleineidam L, Knopman DS, Kochan NA, Konte B, Kwok JB, Le Hellard S, Lee T, Lehtimaki T, Li SC, Liu T, Koini M, London E, Longstreth WT Jr., Lopez OL, Loukola A, Luck T, Lundervold AJ, Lundquist A, Lyytikainen LP, Martin NG, Montgomery GW, Murray AD, Need AC, Noordam R, Nyberg L, Ollier W, Papenberg G, Pattie A, Polasek O, Poldrack RA, Psaty BM, Reppermund S, Riedel-Heller SG, Rose RJ, Rotter JI, Roussos P, Rovio SP, Saba Y, Sabb FW, Sachdev PS, Satizabal CL, Schmid M, Scott RJ, Scult MA, Simino J, Slagboom PE, Smyrnis N, Soumare A, Stefanis NC, Stott DJ, Straub RE, Sundet K, Taylor AM, Taylor KD, Tzoulaki I, Tzourio C, Uitterlinden A, Vitart V, Voineskos AN, Kaprio J, Wagner M, Wagner H, Weinhold L, Wen KH, Widen E, Yang Q, Zhao W, Adams HHH, Arking DE, Bilder RM, Bitsios P, Boerwinkle E, Chiba-Falek O, Corvin A, De Jager PL, Debette S, Donohoe G, Elliott P, Fitzpatrick AL, Gill M, Glahn DC, Hagg S, Hansell NK, Hariri AR, Ikram MK, Jukema JW, Vuoksimaa E, Keller MC, Kremen WS, Launer L, Lindenberger U, Palotie A, Pedersen NL, Pendleton N, Porteous DJ, Raikkonen K, Raitakari OT, Ramirez A, Reinvang I, Rudan I, Dan R, Schmidt R, Schmidt H, Schofield PW, Schofield PR, Starr JM, Steen VM, Trollor JN, Turner ST, Van Duijn CM, Villringer A, Weinberger DR, Weir DR, Wilson JF, Malhotra A, McIntosh AM, Gale CR, Seshadri S, Mosley TH Jr., Bressler J, Lencz T, Deary IJ, 2018. Study of 300,486 individuals identifies 148 independent genetic loci influencing general cognitive function. Nat Commun 9(1), 2098. [DOI] [PMC free article] [PubMed] [Google Scholar]
- Davies G, Marioni RE, Liewald DC, Hill WD, Hagenaars SP, Harris SE, Ritchie SJ, Luciano M, Fawns-Ritchie C, Lyall D, Cullen B, Cox SR, Hayward C, Porteous DJ, Evans J, McIntosh AM, Gallacher J, Craddock N, Pell JP, Smith DJ, Gale CR, Deary IJ, 2016. Genome-wide association study of cognitive functions and educational attainment in UK Biobank (N=112 151). Molecular psychiatry 21(6), 758–767. [DOI] [PMC free article] [PubMed] [Google Scholar]
- Davies G, Tenesa A, Payton A, Yang J, Harris SE, Liewald D, Ke X, Le Hellard S, Christoforou A, Luciano M, McGhee K, Lopez L, Gow AJ, Corley J, Redmond P, Fox HC, Haggarty P, Whalley LJ, McNeill G, Goddard ME, Espeseth T, Lundervold AJ, Reinvang I, Pickles A, Steen VM, Ollier W, Porteous DJ, Horan M, Starr JM, Pendleton N, Visscher PM, Deary IJ, 2011. Genome-wide association studies establish that human intelligence is highly heritable and polygenic. Molecular psychiatry 16(10), 996–1005 [DOI] [PMC free article] [PubMed] [Google Scholar]
- de Leeuw CA, Mooij JM, Heskes T, Posthuma D, 2015. MAGMA: generalized gene-set analysis of GWAS data. PLoS computational biology 11(4), e1004219. [DOI] [PMC free article] [PubMed] [Google Scholar]
- Deary IJ, 2012. Intelligence. Annu Rev Psychol 63, 453–482. [DOI] [PubMed] [Google Scholar]
- Docherty SJ, Davis OS, Kovas Y, Meaburn EL, Dale PS, Petrill SA, Schalkwyk LC, Plomin R, 2010. A genome-wide association study identifies multiple loci associated with mathematics ability and disability. Genes Brain Behav 9(2), 234–247 [DOI] [PMC free article] [PubMed] [Google Scholar]
- Dokkedal U, Wod M, Thinggaard M, Hansen TG, Rasmussen LS, Christensen K, Mengel-From J, 2020. Apolipoprotein E epsilon4 and cognitive function after surgery in middle-aged and elderly Danish twins. Eur J Anaesthesiol. [DOI] [PMC free article] [PubMed] [Google Scholar]
- Engberg H, Christensen K, Andersen-Ranberg K, Jeune B, 2008. Cohort changes in cognitive function among Danish centenarians. A comparative study of 2 birth cohorts born in 1895 and 1905. Dement Geriatr Cogn Disord 26(2), 153–160. [DOI] [PMC free article] [PubMed] [Google Scholar]
- Finkel D, Reynolds CA, 2009. Behavioral Genetic Investigations of Cognitive Aging, in: Kim YK (Ed.) Handbook of Behavior Genetics. Springer, New York, NY, pp. 101–112. [Google Scholar]
- Genomes Project C, Auton A, Brooks LD, Durbin RM, Garrison EP, Kang HM, Korbel JO, Marchini JL, McCarthy S, McVean GA, Abecasis GR, 2015. A global reference for human genetic variation. Nature 526(7571), 68–74. [DOI] [PMC free article] [PubMed] [Google Scholar]
- Harris SE, Deary IJ, 2011. The genetics of cognitive ability and cognitive ageing in healthy older people. Trends Cogn Sci 15(9), 388–394. [DOI] [PubMed] [Google Scholar]
- Hill WD, Marioni RE, Maghzian O, Ritchie SJ, Hagenaars SP, McIntosh AM, Gale CR, Davies G, Deary IJ, 2019. A combined analysis of genetically correlated traits identifies 187 loci and a role for neurogenesis and myelination in intelligence. Molecular psychiatry 24(2), 169–181. [DOI] [PMC free article] [PubMed] [Google Scholar]
- Hirsch HA, Iliopoulos D, Joshi A, Zhang Y, Jaeger SA, Bulyk M, Tsichlis PN, Shirley Liu X, Struhl K, 2010. A transcriptional signature and common gene networks link cancer with lipid metabolism and diverse human diseases. Cancer Cell 17(4), 348–361. [DOI] [PMC free article] [PubMed] [Google Scholar]
- Hortsch M, Nagaraj K, Godenschwege TA, 2009. The interaction between L1-type proteins and ankyrins--a master switch for L1-type CAM function. Cell Mol Biol Lett 14(1), 57–69. [DOI] [PMC free article] [PubMed] [Google Scholar]
- Howie BN, Donnelly P, Marchini J, 2009. A flexible and accurate genotype imputation method for the next generation of genome-wide association studies. PLoS Genet 5(6), e1000529. [DOI] [PMC free article] [PubMed] [Google Scholar]
- Huang Y, Thathiah A, 2015. Regulation of neuronal communication by G protein-coupled receptors. FEBS Lett 589(14), 1607–1619. [DOI] [PubMed] [Google Scholar]
- Huang Y, Todd N, Thathiah A, 2017. The role of GPCRs in neurodegenerative diseases: avenues for therapeutic intervention. Curr Opin Pharmacol 32, 96–110. [DOI] [PubMed] [Google Scholar]
- Jun GR, Chung J, Mez J, Barber R, Beecham GW, Bennett DA, Buxbaum JD, Byrd GS, Carrasquillo MM, Crane PK, Cruchaga C, De Jager P, Ertekin-Taner N, Evans D, Fallin MD, Foroud TM, Friedland RP, Goate AM, Graff-Radford NR, Hendrie H, Hall KS, Hamilton-Nelson KL, Inzelberg R, Kamboh MI, Kauwe JSK, Kukull WA, Kunkle BW, Kuwano R, Larson EB, Logue MW, Manly JJ, Martin ER, Montine TJ, Mukherjee S, Naj A, Reiman EM, Reitz C, Sherva R, St George-Hyslop PH, Thornton T, Younkin SG, Vardarajan BN, Wang LS, Wendlund JR, Winslow AR, Alzheimer’s Disease Genetics C, Haines J, Mayeux R, Pericak-Vance MA, Schellenberg G, Lunetta KL, Farrer LA, 2017. Transethnic genome-wide scan identifies novel Alzheimer’s disease loci. Alzheimers Dement 13(7), 727–738. [DOI] [PMC free article] [PubMed] [Google Scholar]
- Kichaev G, Bhatia G, Loh PR, Gazal S, Burch K, Freund MK, Schoech A, Pasaniuc B, Price AL, 2019. Leveraging Polygenic Functional Enrichment to Improve GWAS Power. American journal of human genetics 104(1), 65–75. [DOI] [PMC free article] [PubMed] [Google Scholar]
- Kunkle BW, Grenier-Boley B, Sims R, Bis JC, Damotte V, Naj AC, Boland A, Vronskaya M, van der Lee SJ, Amlie-Wolf A, Bellenguez C, Frizatti A, Chouraki V, Martin ER, Sleegers K, Badarinarayan N, Jakobsdottir J, Hamilton-Nelson KL, Moreno-Grau S, Olaso R, Raybould R, Chen Y, Kuzma AB, Hiltunen M, Morgan T, Ahmad S, Vardarajan BN, Epelbaum J, Hoffmann P, Boada M, Beecham GW, Garnier JG, Harold D, Fitzpatrick AL, Valladares O, Moutet ML, Gerrish A, Smith AV, Qu L, Bacq D, Denning N, Jian X, Zhao Y, Del Zompo M, Fox NC, Choi SH, Mateo I, Hughes JT, Adams HH, Malamon J, Sanchez-Garcia F, Patel Y, Brody JA, Dombroski BA, Naranjo MCD, Daniilidou M, Eiriksdottir G, Mukherjee S, Wallon D, Uphill J, Aspelund T, Cantwell LB, Garzia F, Galimberti D, Hofer E, Butkiewicz M, Fin B, Scarpini E, Sarnowski C, Bush WS, Meslage S, Kornhuber J, White CC, Song Y, Barber RC, Engelborghs S, Sordon S, Voijnovic D, Adams PM, Vandenberghe R, Mayhaus M, Cupples LA, Albert MS, De Deyn PP, Gu W, Himali JJ, Beekly D, Squassina A, Hartmann AM, Orellana A, Blacker D, Rodriguez-Rodriguez E, Lovestone S, Garcia ME, Doody RS, Munoz-Fernadez C, Sussams R, Lin H, Fairchild TJ, Benito YA, Holmes C, Karamujic-Comic H, Frosch MP, Thonberg H, Maier W, Roschupkin G, Ghetti B, Giedraitis V, Kawalia A, Li S, Huebinger RM, Kilander L, Moebus S, Hernandez I, Kamboh MI, Brundin R, Turton J, Yang Q, Katz MJ, Concari L, Lord J, Beiser AS, Keene CD, Helisalmi S, Kloszewska I, Kukull WA, Koivisto AM, Lynch A, Tarraga L, Larson EB, Haapasalo A, Lawlor B, Mosley TH, Lipton RB, Solfrizzi V, Gill M, Longstreth WT Jr., Montine TJ, Frisardi V, Diez-Fairen M, Rivadeneira F, Petersen RC, Deramecourt V, Alvarez I, Salani F, Ciaramella A, Boerwinkle E, Reiman EM, Fievet N, Rotter JI, Reisch JS, Hanon O, Cupidi C, Andre Uitterlinden AG, Royall DR, Dufouil C, Maletta RG, de Rojas I, Sano M, Brice A, Cecchetti R, George-Hyslop PS, Ritchie K, Tsolaki M, Tsuang DW, Dubois B, Craig D, Wu CK, Soininen H, Avramidou D, Albin RL, Fratiglioni L, Germanou A, Apostolova LG, Keller L, Koutroumani M, Arnold SE, Panza F, Gkatzima O, Asthana S, Hannequin D, Whitehead P, Atwood CS, Caffarra P, Hampel H, Quintela I, Carracedo A, Lannfelt L, Rubinsztein DC, Barnes LL, Pasquier F, Frolich L, Barral S, McGuinness B, Beach TG, Johnston JA, Becker JT, Passmore P, Bigio EH, Schott JM, Bird TD, Warren JD, Boeve BF, Lupton MK, Bowen JD, Proitsi P, Boxer A, Powell JF, Burke JR, Kauwe JSK, Burns JM, Mancuso M, Buxbaum JD, Bonuccelli U, Cairns NJ, McQuillin A, Cao C, Livingston G, Carlson CS, Bass NJ, Carlsson CM, Hardy J, Carney RM, Bras J, Carrasquillo MM, Guerreiro R, Allen M, Chui HC, Fisher E, Masullo C, Crocco EA, DeCarli C, Bisceglio G, Dick M, Ma L, Duara R, Graff-Radford NR, Evans DA, Hodges A, Faber KM, Scherer M, Fallon KB, Riemenschneider M, Fardo DW, Heun R, Farlow MR, Kolsch H, Ferris S, Leber M, Foroud TM, Heuser I, Galasko DR, Giegling I, Gearing M, Hull M, Geschwind DH, Gilbert JR, Morris J, Green RC, Mayo K, Growdon JH, Feulner T, Hamilton RL, Harrell LE, Drichel D, Honig LS, Cushion TD, Huentelman MJ, Hollingworth P, Hulette CM, Hyman BT, Marshall R, Jarvik GP, Meggy A, Abner E, Menzies GE, Jin LW, Leonenko G, Real LM, Jun GR, Baldwin CT, Grozeva D, Karydas A, Russo G, Kaye JA, Kim R, Jessen F, Kowall NW, Vellas B, Kramer JH, Vardy E, LaFerla FM, Jockel KH, Lah JJ, Dichgans M, Leverenz JB, Mann D, Levey AI, Pickering-Brown S, Lieberman AP, Klopp N, Lunetta KL, Wichmann HE, Lyketsos CG, Morgan K, Marson DC, Brown K, Martiniuk F, Medway C, Mash DC, Nothen MM, Masliah E, Hooper NM, McCormick WC, Daniele A, McCurry SM, Bayer A, McDavid AN, Gallacher J, McKee AC, van den Bussche H, Mesulam M, Brayne C, Miller BL, Riedel-Heller S, Miller CA, Miller JW, Al-Chalabi A, Morris JC, Shaw CE, Myers AJ, Wiltfang J, O’Bryant S, Olichney JM, Alvarez V, Parisi JE, Singleton AB, Paulson HL, Collinge J, Perry WR, Mead S, Peskind E, Cribbs DH, Rossor M, Pierce A, Ryan NS, Poon WW, Nacmias B, Potter H, Sorbi S, Quinn JF, Sacchinelli E, Raj A, Spalletta G, Raskind M, Caltagirone C, Bossu P, Orfei MD, Reisberg B, Clarke R, Reitz C, Smith AD, Ringman JM, Warden D, Roberson ED, Wilcock G, Rogaeva E, Bruni AC, Rosen HJ, Gallo M, Rosenberg RN, Ben-Shlomo Y, Sager MA, Mecocci P, Saykin AJ, Pastor P, Cuccaro ML, Vance JM, Schneider JA, Schneider LS, Slifer S, Seeley WW, Smith AG, Sonnen JA, Spina S, Stern RA, Swerdlow RH, Tang M, Tanzi RE, Trojanowski JQ, Troncoso JC, Van Deerlin VM, Van Eldik LJ, Vinters HV, Vonsattel JP, Weintraub S, Welsh-Bohmer KA, Wilhelmsen KC, Williamson J, Wingo TS, Woltjer RL, Wright CB, Yu CE, Yu L, Saba Y, Alzheimer Disease Genetics C, European Alzheimer’s Disease I, Cohorts for H, Aging Research in Genomic Epidemiology, C., Genetic, Environmental Risk in Ad/Defining Genetic P, Environmental Risk for Alzheimer’s Disease, C., Pilotto A, Bullido MJ, Peters O, Crane PK, Bennett D, Bosco P, Coto E, Boccardi V, De Jager PL, Lleo A, Warner N, Lopez OL, Ingelsson M, Deloukas P, Cruchaga C, Graff C, Gwilliam R, Fornage M, Goate AM, Sanchez-Juan P, Kehoe PG, Amin N, Ertekin-Taner N, Berr C, Debette S, Love S, Launer LJ, Younkin SG, Dartigues JF, Corcoran C, Ikram MA, Dickson DW, Nicolas G, Campion D, Tschanz J, Schmidt H, Hakonarson H, Clarimon J, Munger R, Schmidt R, Farrer LA, Van Broeckhoven C, M, C.O.D., DeStefano AL, Jones L, Haines JL, Deleuze JF, Owen MJ, Gudnason V, Mayeux R, Escott-Price V, Psaty BM, Ramirez A, Wang LS, Ruiz A, van Duijn CM, Holmans PA, Seshadri S, Williams J, Amouyel P, Schellenberg GD, Lambert JC, Pericak-Vance MA, 2019. Genetic meta-analysis of diagnosed Alzheimer’s disease identifies new risk loci and implicates Abeta, tau, immunity and lipid processing. Nature genetics 51(3), 414–430. [DOI] [PMC free article] [PubMed] [Google Scholar]
- Lam M, Trampush JW, Yu J, Knowles E, Davies G, Liewald DC, Starr JM, Djurovic S, Melle I, Sundet K, Christoforou A, Reinvang I, DeRosse P, Lundervold AJ, Steen VM, Espeseth T, Raikkonen K, Widen E, Palotie A, Eriksson JG, Giegling I, Konte B, Roussos P, Giakoumaki S, Burdick KE, Payton A, Ollier W, Chiba-Falek O, Attix DK, Need AC, Cirulli ET, Voineskos AN, Stefanis NC, Avramopoulos D, Hatzimanolis A, Arking DE, Smyrnis N, Bilder RM, Freimer NA, Cannon TD, London E, Poldrack RA, Sabb FW, Congdon E, Conley ED, Scult MA, Dickinson D, Straub RE, Donohoe G, Morris D, Corvin A, Gill M, Hariri AR, Weinberger DR, Pendleton N, Bitsios P, Rujescu D, Lahti J, Le Hellard S, Keller MC, Andreassen OA, Deary IJ, Glahn DC, Malhotra AK, Lencz T, 2017. Large-Scale Cognitive GWAS Meta-Analysis Reveals Tissue-Specific Neural Expression and Potential Nootropic Drug Targets. Cell Rep 21(9), 2597–2613. [DOI] [PMC free article] [PubMed] [Google Scholar]
- Lee JJ, Wedow R, Okbay A, Kong E, Maghzian O, Zacher M, Nguyen-Viet TA, Bowers P, Sidorenko J, Karlsson Linner R, Fontana MA, Kundu T, Lee C, Li H, Li R, Royer R, Timshel PN, Walters RK, Willoughby EA, Yengo L, andMe Research T, Cogent, Social Science Genetic Association, C., Alver M, Bao Y, Clark DW, Day FR, Furlotte NA, Joshi PK, Kemper KE, Kleinman A, Langenberg C, Magi R, Trampush JW, Verma SS, Wu Y, Lam M, Zhao JH, Zheng Z, Boardman JD, Campbell H, Freese J, Harris KM, Hayward C, Herd P, Kumari M, Lencz T, Luan J, Malhotra AK, Metspalu A, Milani L, Ong KK, Perry JRB, Porteous DJ, Ritchie MD, Smart MC, Smith BH, Tung JY, Wareham NJ, Wilson JF, Beauchamp JP, Conley DC, Esko T, Lehrer SF, Magnusson PKE, Oskarsson S, Pers TH, Robinson MR, Thom K, Watson C, Chabris CF, Meyer MN, Laibson DI, Yang J, Johannesson M, Koellinger PD, Turley P, Visscher PM, Benjamin DJ, Cesarini D,2018. Gene discovery and polygenic prediction from a genome-wide association study of educational attainment in 1.1 million individuals. Nature genetics 50(8), 1112–1121. [DOI] [PMC free article] [PubMed] [Google Scholar]
- Lee T, Henry JD, Trollor JN, Sachdev PS, 2010. Genetic influences on cognitive functions in the elderly: a selective review of twin studies. Brain Res Rev 64(1), 1–13. [DOI] [PubMed] [Google Scholar]
- Leung CCY, Wong YH, 2017. Role of G Protein-Coupled Receptors in the Regulation of Structural Plasticity and Cognitive Function. Molecules 22(7). [DOI] [PMC free article] [PubMed] [Google Scholar]
- Li D, Bachinski LL, Roberts R, 2001. Genomic organization and isoform-specific tissue expression of human NAPOR (CUGBP2) as a candidate gene for familial arrhythmogenic right ventricular dysplasia. Genomics 74(3), 396–401. [DOI] [PubMed] [Google Scholar]
- Liberzon A, Subramanian A, Pinchback R, Thorvaldsdottir H, Tamayo P, Mesirov JP, 2011. Molecular signatures database (MSigDB) 3.0. Bioinformatics 27(12), 1739–1740. [DOI] [PMC free article] [PubMed] [Google Scholar]
- Makoff A, Pilling C, Harrington K, Emson P, 1996. Human metabotropic glutamate receptor type 7: molecular cloning and mRNA distribution in the CNS. Brain Res Mol Brain Res 40(1), 165–170. [DOI] [PubMed] [Google Scholar]
- McGue M, Christensen K, 2001. The heritability of cognitive functioning in very old adults: evidence from Danish twins aged 75 years and older. Psychol Aging 16(2), 272–280. [DOI] [PubMed] [Google Scholar]
- McGue M, Christensen K, 2002. The heritability of level and rate-of-change in cognitive functioning in Danish twins aged 70 years and older. Experimental aging research 28(4), 435–451. [DOI] [PubMed] [Google Scholar]
- McGue M, Christensen K, 2013. Growing old but not growing apart: twin similarity in the latter half of the lifespan. Behav Genet 43(1), 1–12. [DOI] [PMC free article] [PubMed] [Google Scholar]
- Mengel-From J, Christensen K, McGue M, Christiansen L, 2011. Genetic variations in the CLU and PICALM genes are associated with cognitive function in the oldest old. Neurobiology of aging 32(3), 554 e557–511. [DOI] [PMC free article] [PubMed] [Google Scholar]
- Mengel-From J, Soerensen M, Nygaard M, McGue M, Christensen K, Christiansen L, 2016. Genetic Variants in KLOTHO Associate With Cognitive Function in the Oldest Old Group. The journals of gerontology. Series A, Biological sciences and medical sciences 71(9), 1151–1159. [DOI] [PMC free article] [PubMed] [Google Scholar]
- Miller SA, Dykes DD, Polesky HF, 1988. A simple salting out procedure for extracting DNA from human nucleated cells. Nucleic acids research 16(3), 1215. [DOI] [PMC free article] [PubMed] [Google Scholar]
- Mishra A, Macgregor S, 2015. VEGAS2: Software for More Flexible Gene-Based Testing. Twin research and human genetics : the official journal of the International Society for Twin Studies 18(1), 86–91. [DOI] [PubMed] [Google Scholar]
- Okbay A, Beauchamp JP, Fontana MA, Lee JJ, Pers TH, Rietveld CA, Turley P, Chen GB, Emilsson V, Meddens SF, Oskarsson S, Pickrell JK, Thom K, Timshel P, de Vlaming R, Abdellaoui A, Ahluwalia TS, Bacelis J, Baumbach C, Bjornsdottir G, Brandsma JH, Pina Concas M, Derringer J, Furlotte NA, Galesloot TE, Girotto G, Gupta R, Hall LM, Harris SE, Hofer E, Horikoshi M, Huffman JE, Kaasik K, Kalafati IP, Karlsson R, Kong A, Lahti J, van der Lee SJ, deLeeuw C, Lind PA, Lindgren KO, Liu T, Mangino M, Marten J, Mihailov E, Miller MB, van der Most PJ, Oldmeadow C, Payton A, Pervjakova N, Peyrot WJ, Qian Y, Raitakari O, Rueedi R, Salvi E, Schmidt B, Schraut KE, Shi J, Smith AV, Poot RA, St Pourcain B, Teumer A, Thorleifsson G, Verweij N, Vuckovic D, Wellmann J, Westra HJ, Yang J, Zhao W, Zhu Z, Alizadeh BZ, Amin N, Bakshi A, Baumeister SE, Biino G, Bonnelykke K, Boyle PA, Campbell H, Cappuccio FP, Davies G, De Neve JE, Deloukas P, Demuth I, Ding J, Eibich P, Eisele L, Eklund N, Evans DM, Faul JD, Feitosa MF, Forstner AJ, Gandin I, Gunnarsson B, Halldorsson BV, Harris TB, Heath AC, Hocking LJ, Holliday EG, Homuth G, Horan MA, Hottenga JJ, de Jager PL, Joshi PK, Jugessur A, Kaakinen MA, Kahonen M, Kanoni S, Keltigangas-Jarvinen L, Kiemeney LA, Kolcic I, Koskinen S, Kraja AT, Kroh M, Kutalik Z, Latvala A, Launer LJ, Lebreton MP, Levinson DF, Lichtenstein P, Lichtner P, Liewald DC, LifeLines Cohort S, Loukola A, Madden PA, Magi R, Maki-Opas T, Marioni RE, Marques-Vidal P, Meddens GA, McMahon G, Meisinger C, Meitinger T, Milaneschi Y, Milani L, Montgomery GW, Myhre R, Nelson CP, Nyholt DR, Ollier WE, Palotie A, Paternoster L, Pedersen NL, Petrovic KE, Porteous DJ, Raikkonen K, Ring SM, Robino A, Rostapshova O, Rudan I, Rustichini A, Salomaa V, Sanders AR, Sarin AP, Schmidt H, Scott RJ, Smith BH, Smith JA, Staessen JA, Steinhagen-Thiessen E, Strauch K, Terracciano A, Tobin MD, Ulivi S, Vaccargiu S, Quaye L, van Rooij FJ, Venturini C, Vinkhuyzen AA, Volker U, Volzke H, Vonk JM, Vozzi D, Waage J, Ware EB, Willemsen G, Attia JR, Bennett DA, Berger K, Bertram L, Bisgaard H, Boomsma DI, Borecki IB, Bultmann U, Chabris CF, Cucca F, Cusi D, Deary IJ, Dedoussis GV, van Duijn CM, Eriksson JG, Franke B, Franke L, Gasparini P, Gejman PV, Gieger C, Grabe HJ, Gratten J, Groenen PJ, Gudnason V, van der Harst P, Hayward C, Hinds DA, Hoffmann W, Hypponen E, Iacono WG, Jacobsson B, Jarvelin MR, Jockel KH, Kaprio J, Kardia SL, Lehtimaki T, Lehrer SF, Magnusson PK, Martin NG, McGue M, Metspalu A, Pendleton N, Penninx BW, Perola M, Pirastu N, Pirastu M, Polasek O, Posthuma D, Power C, Province MA, Samani NJ, Schlessinger D, Schmidt R, Sorensen TI, Spector TD, Stefansson K, Thorsteinsdottir U, Thurik AR, Timpson NJ, Tiemeier H, Tung JY, Uitterlinden AG, Vitart V, Vollenweider P, Weir DR, Wilson JF, Wright AF, Conley DC, Krueger RF, Davey Smith G, Hofman A, Laibson DI, Medland SE, Meyer MN, Yang J, Johannesson M, Visscher PM, Esko T, Koellinger PD, Cesarini D, Benjamin DJ, 2016. Genome-wide association study identifies 74 loci associated with educational attainment. Nature 533(7604), 539–542. [DOI] [PMC free article] [PubMed] [Google Scholar]
- Olbrich H, Haffner K, Kispert A, Volkel A, Volz A, Sasmaz G, Reinhardt R, Hennig S, Lehrach H, Konietzko N, Zariwala M, Noone PG, Knowles M, Mitchison HM, Meeks M, Chung EM, Hildebrandt F, Sudbrak R, Omran H, 2002. Mutations in DNAH5 cause primary ciliary dyskinesia and randomization of left-right asymmetry. Nature genetics 30(2), 143–144. [DOI] [PubMed] [Google Scholar]
- Oughtred R, Stark C, Breitkreutz BJ, Rust J, Boucher L, Chang C, Kolas N, O’Donnell L, Leung G, McAdam R, Zhang F, Dolma S, Willems A, Coulombe-Huntington J, Chatr-Aryamontri A, Dolinski K, Tyers M, 2019. The BioGRID interaction database: 2019 update. Nucleic acids research 47(D1), D529–D541. [DOI] [PMC free article] [PubMed] [Google Scholar]
- Pedersen DA, Larsen LA, Nygaard M, Mengel-From J, McGue M, Dalgard C, Hvidberg L, Hjelmborg J, Skytthe A, Holm NV, Kyvik KO, Christensen K, 2019. The Danish Twin Registry: An Updated Overview. Twin research and human genetics : the official journal of the International Society for Twin Studies 22(6), 499–507. [DOI] [PMC free article] [PubMed] [Google Scholar]
- Peng F, Li Q, Niu SQ, Shen GP, Luo Y, Chen M, Bao Y, 2019. ZWINT is the next potential target for lung cancer therapy. J Cancer Res Clin Oncol 145(3), 661–673. [DOI] [PMC free article] [PubMed] [Google Scholar]
- Polderman TJ, Benyamin B, de Leeuw CA, Sullivan PF, van Bochoven A, Visscher PM, Posthuma D, 2015. Meta-analysis of the heritability of human traits based on fifty years of twin studies. Nature genetics 47(7), 702–709. [DOI] [PubMed] [Google Scholar]
- Purcell S, Neale B, Todd-Brown K, Thomas L, Ferreira MA, Bender D, Maller J, Sklar P, de Bakker PI, Daly MJ, Sham PC, 2007. PLINK: a tool set for whole-genome association and population-based linkage analyses. American journal of human genetics 81(3), 559–575. [DOI] [PMC free article] [PubMed] [Google Scholar]
- Rasmussen SH, Andersen-Ranberg K, Thinggaard M, Jeune B, Skytthe A, Christiansen L, Vaupel JW, McGue M, Christensen K, 2017. Cohort Profile: The 1895, 1905, 1910 and 1915 Danish Birth Cohort Studies - secular trends in the health and functioning of the very old. International journal of epidemiology 46(6), 1746–1746j. [DOI] [PMC free article] [PubMed] [Google Scholar]
- Reiner A, Levitz J, 2018. Glutamatergic Signaling in the Central Nervous System: Ionotropic and Metabotropic Receptors in Concert. Neuron 98(6), 1080–1098. [DOI] [PMC free article] [PubMed] [Google Scholar]
- Sanchez-Mut JV, Aso E, Heyn H, Matsuda T, Bock C, Ferrer I, Esteller M, 2014. Promoter hypermethylation of the phosphatase DUSP22 mediates PKA-dependent TAU phosphorylation and CREB activation in Alzheimer’s disease. Hippocampus 24(4), 363–368. [DOI] [PMC free article] [PubMed] [Google Scholar]
- Savage JE, Jansen PR, Stringer S, Watanabe K, Bryois J, de Leeuw CA, Nagel M, Awasthi S, Barr PB, Coleman JRI, Grasby KL, Hammerschlag AR, Kaminski JA, Karlsson R, Krapohl E, Lam M, Nygaard M, Reynolds CA, Trampush JW, Young H, Zabaneh D, Hagg S, Hansell NK, Karlsson IK, Linnarsson S, Montgomery GW, Munoz-Manchado AB, Quinlan EB, Schumann G, Skene NG, Webb BT, White T, Arking DE, Avramopoulos D, Bilder RM, Bitsios P, Burdick KE, Cannon TD, Chiba-Falek O, Christoforou A, Cirulli ET, Congdon E, Corvin A, Davies G, Deary IJ, DeRosse P, Dickinson D, Djurovic S, Donohoe G, Conley ED, Eriksson JG, Espeseth T, Freimer NA, Giakoumaki S, Giegling I, Gill M, Glahn DC, Hariri AR, Hatzimanolis A, Keller MC, Knowles E, Koltai D, Konte B, Lahti J, Le Hellard S, Lencz T, Liewald DC, London E, Lundervold AJ, Malhotra AK, Melle I, Morris D, Need AC, Ollier W, Palotie A, Payton A, Pendleton N, Poldrack RA, Raikkonen K, Reinvang I, Roussos P, Rujescu D, Sabb FW, Scult MA, Smeland OB, Smyrnis N, Starr JM, Steen VM, Stefanis NC, Straub RE, Sundet K, Tiemeier H, Voineskos AN, Weinberger DR, Widen E, Yu J, Abecasis G, Andreassen OA, Breen G, Christiansen L, Debrabant B, Dick DM, Heinz A, Hjerling-Leffler J, Ikram MA, Kendler KS, Martin NG, Medland SE, Pedersen NL, Plomin R, Polderman TJC, Ripke S, van der Sluis S, Sullivan PF, Vrieze SI, Wright MJ, Posthuma D, 2018. Genome-wide association meta-analysis in 269,867 individuals identifies new genetic and functional links to intelligence. Nature genetics 50(7), 912–919. [DOI] [PMC free article] [PubMed] [Google Scholar]
- Skaper SD, 2012. Neuronal growth-promoting and inhibitory cues in neuroprotection and neuroregeneration. Methods in molecular biology 846, 13–22. [DOI] [PubMed] [Google Scholar]
- Sniekers S, Stringer S, Watanabe K, Jansen PR, Coleman JRI, Krapohl E, Taskesen E, Hammerschlag AR, Okbay A, Zabaneh D, Amin N, Breen G, Cesarini D, Chabris CF, Iacono WG, Ikram MA, Johannesson M, Koellinger P, Lee JJ, Magnusson PKE, McGue M, Miller MB, Ollier WER, Payton A, Pendleton N, Plomin R, Rietveld CA, Tiemeier H, van Duijn CM, Posthuma D, 2017. Genome-wide association meta-analysis of 78,308 individuals identifies new loci and genes influencing human intelligence. Nature genetics 49(7), 1107–1112. [DOI] [PMC free article] [PubMed] [Google Scholar]
- Squillario M, Abate G, Tomasi F, Tozzo V, Barla A, Uberti D, Alzheimer’s Disease Neuroimaging I, 2020. A telescope GWAS analysis strategy, based on SNPs-genes-pathways ensamble and on multivariate algorithms, to characterize late onset Alzheimer’s disease. Sci Rep 10(1), 12063. [DOI] [PMC free article] [PubMed] [Google Scholar]
- Trampush JW, Yang MLZ, Yu J, Knowles E, Davies G, Liewald DC, Starr JM, Djurovic S, Melle I, Sundet K, Christoforou A, Reinvang I, DeRosse P, Lundervold AJ, Steen VM, Espeseth T, Raikkonen K, Widen E, Palotie A, Eriksson JG, Giegling I, Konte B, Roussos P, Giakoumaki S, Burdick KE, Payton A, Ollier W, Horan M, Chiba-Falek O, Attix DK, Need AC, Cirulli ET, Voineskos AN, Stefanis NC, Avramopoulos D, Hatzimanolis A, Arking DE, Smyrnis N, Bilder RM, Freimer NA, Cannon TD, London E, Poldrack RA, Sabb FW, Congdon E, Conley ED, Scult MA, Dickinson D, Straub RE, Donohoe G, Morris D, Corvin A, Gill M, Hariri AR, Weinberger DR, Pendleton N, Bitsios P, Rujescu D, Lahti J, Le Hellard S, Keller MC, Andreassen OA, Deary IJ, Glahn DC, Malhotra AK, Lencz T, 2017. GWAS meta-analysis reveals novel loci and genetic correlates for general cognitive function: a report from the COGENT consortium. Molecular psychiatry 22(11), 1651–1652. [DOI] [PMC free article] [PubMed] [Google Scholar]
- Tucker-Drob EM, 2011. Neurocognitive functions and everyday functions change together in old age. Neuropsychology 25(3), 368–377. [DOI] [PMC free article] [PubMed] [Google Scholar]
- Uddin MS, Stachowiak A, Mamun AA, Tzvetkov NT, Takeda S, Atanasov AG, Bergantin LB, Abdel-Daim MM, Stankiewicz AM, 2018. Autophagy and Alzheimer’s Disease: From Molecular Mechanisms to Therapeutic Implications. Front Aging Neurosci 10, 04. [DOI] [PMC free article] [PubMed] [Google Scholar]
- Vaupel JW, 2010. Biodemography of human ageing. Nature 464(7288), 536–542. [DOI] [PMC free article] [PubMed] [Google Scholar]
- Watanabe K, Taskesen E, van Bochoven A, Posthuma D, 2017. Functional mapping and annotation of genetic associations with FUMA. Nat Commun 8(1), 1826. [DOI] [PMC free article] [PubMed] [Google Scholar]
- Wijsman EM, Pankratz ND, Choi Y, Rothstein JH, Faber KM, Cheng R, Lee JH, Bird TD, Bennett DA, Diaz-Arrastia R, Goate AM, Farlow M, Ghetti B, Sweet RA, Foroud TM, Mayeux R, Group N-LNFS, 2011. Genome-wide association of familial late-onset Alzheimer’s disease replicates BIN1 and CLU and nominates CUGBP2 in interaction with APOE. PLoS Genet 7(2), e1001308. [DOI] [PMC free article] [PubMed] [Google Scholar]
- Witoelar A, Rongve A, Almdahl IS, Ulstein ID, Engvig A, White LR, Selbaek G, Stordal E, Andersen F, Braekhus A, Saltvedt I, Engedal K, Hughes T, Bergh S, Brathen G, Bogdanovic N, Bettella F, Wang Y, Athanasiu L, Bahrami S, Le Hellard S, Giddaluru S, Dale AM, Sando SB, Steinberg S, Stefansson H, Snaedal J, Desikan RS, Stefansson K, Aarsland D, Djurovic S, Fladby T, Andreassen OA, 2018. Meta-analysis of Alzheimer’s disease on 9,751 samples from Norway and IGAP study identifies four risk loci. Sci Rep 8(1), 18088. [DOI] [PMC free article] [PubMed] [Google Scholar]
- Xu C, Zhang D, Wu Y, Tian X, Pang Z, Li S, Tan Q, 2017. A genome-wide association study of cognitive function in Chinese adult twins. Biogerontology 18(5), 811–819. [DOI] [PubMed] [Google Scholar]
- Zariwala MA, Knowles MR, Omran H, 2007. Genetic defects in ciliary structure and function. Annu Rev Physiol 69, 423–450. [DOI] [PubMed] [Google Scholar]
Associated Data
This section collects any data citations, data availability statements, or supplementary materials included in this article.