Abstract
Caloric restriction (CR) can prolong aged skeletal muscle function, yet the molecular mechanisms are not completely understood. We performed phosphoproteomic analysis on muscle from young and old mice fed an ad libitum diet, and old mice fed a CR diet. CR promoted a youthful phosphoproteomic signature, suppressing several known “pro-aging” pathways including Protein kinase A (PKA). This study validates global signaling changes in skeletal muscle during CR.
Keywords: aging, caloric restriction, phosphoproteome, PKA, mice
CR without malnutrition has been shown to extend lifespan and inhibit the development of various diseases across different model organisms and in humans [1]. Chronic CR in mice has been shown to have a remarkable effect on life expectancy and to correct various metabolic abnormalities associated with aging [1, 2]. CR has also been shown to improve skeletal muscle health and regenerative potential in aged mice [3]. Much progress has been made in deciphering the mechanisms that underpin longevity-enhancing effects of CR in model organisms such as yeast and Caenorhabditis elegans, however similar research in mammalian models has lagged behind. Our goal was therefore to determine the effects of lifelong CR on global cell signaling events in mammalian skeletal muscle. Skeletal muscle, due to its proportional mass and physical and metabolic functions, is an excellent model to study tissue aging, especially in the context of CR [4]. To achieve this goal we, for the first time, performed quantitative phosphoproteomic analysis on skeletal muscle tissue from mice subjected to chronic CR, age-matched ad lib-fed mice, and young control mice. The utility of unbiased protein phosphorylation measurements allows us to characterize global cell signaling events and identify pathways regulated by CR, furthering our understanding of how CR exerts its beneficial effects, and potentially identifying druggable targets that can be modulated to recapitulate the therapeutic effects of CR.
Results and discussion
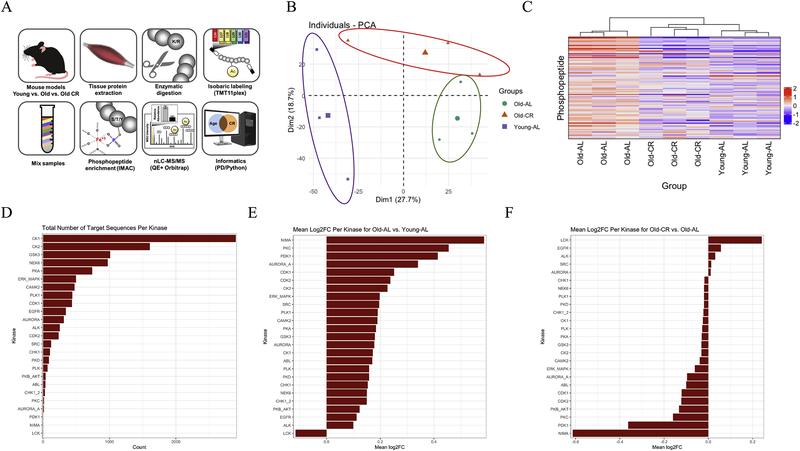
This study was conducted using male C57Bl/6 mice that belonged to one of three groups — 3 month-old mice fed on an ad libitum diet (Young-AL); 27 month-old mice fed on an ad libitum diet (Old-AL); and 27 month-old mice that had been on a calorically-restricted diet since 14 weeks of age (Old-CR). To verify the effect of each respective diet, body weights were measured at the end of the study. Body weight increased in the Old-AL group, while body weight in Old-CR and Young-AL groups were similar (p < 0.05; Supplemental Figure 1). As depicted in our experimental design (Figure 1A), phosphoproteomic analysis was performed utilizing peptide labeling with TMT10plex, phosphopeptide enrichment, and nLC-MS/MS [5]. The raw data were searched with Proteome Discoverer (PD) 2.3, identifying 4,674 phosphopeptides (Supplementary Table 1), the quantitative values for which were normalized to summed TMT intensities from assessment of unmodified peptides in the “input fraction” as described previously [6]. These data were subjected to principal component analysis (PCA), which revealed a separation into three groups based on diet and age (Fig. 1B). The widest separation was between the Young-AL and Old-AL groups along the first principal component (PC1), with the Old-CR group forming a distinct third cluster. PC1 and PC2 accounted for ∼50% of the total variation. Unsupervised hierarchical clustering of the top 100 phosphopeptides in terms of fold-change revealed similar clustering of animals into three separate groups, revealing a distinct aging signature in the AL group, while similar patterns were observed between Young_AL and Old-CR groups (Fig. 1C). In aggregate, the phosphoproteomics data demonstrate the CR group having a “youthful” shift back to the Young controls.
Fig. 1.
The effects of long term CR and aging on the skeletal muscle phosphoproteome. (A) Overview of proteomics experimental workflow. (B) Principal component analysis of the skeletal muscle phosphoproteomes of all mice. (C) Unsupervised hierarchical clustering of the top 100 phosphopeptides. (D) Total number of phosphopeptides that contain target motif sequences for each kinase. Mean Log2 fold-change values for all phosphopeptides that contain target sequences for each kinase for (E) Old-AL vs. Young-AL, and (F) Old-CR vs. Old-AL. Data are shown as mean ± standard error of the mean.
We then attempted to obtain an understanding of which kinases might be contributing the most towards reprogramming the skeletal muscle phosphoproteome with CR. To achieve this, we first counted the number of phosphopeptides that contain putative target phosphorylation sites for each of the kinases in the Phosida post-translational modification database [7]. CK1, CK2, GSK3, NEK6, and PKA were the kinases with the most number of predicted targets, based on motif analysis (Fig. 1C). We then calculated the mean log2 fold-change values for predicted target phosphopeptides for each of the kinases in Fig. 1C. Figure 1E shows analysis for both Young-AL vs. Old-AL (Fig. 1D) and for Old-AL vs. Old-CR (Fig. 1E). With age brought a general increase in predicted kinase substrate phosphorylation, which was diminished with CR. While this analysis provides a useful initial overview of kinase activity by strictly assessing sites that a kinase could potentially phosphorylate, based on predicted phosphosites, we note that the majority of these putative target sequences have not been validated. We therefore proceeded to only consider functionally validated kinase targets.
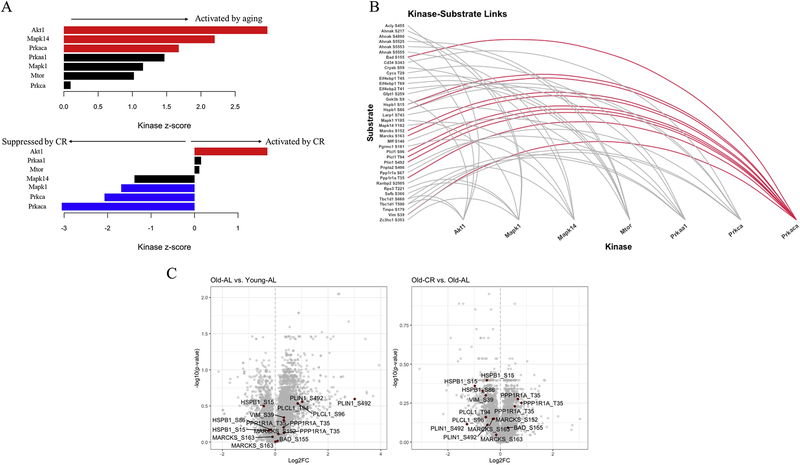
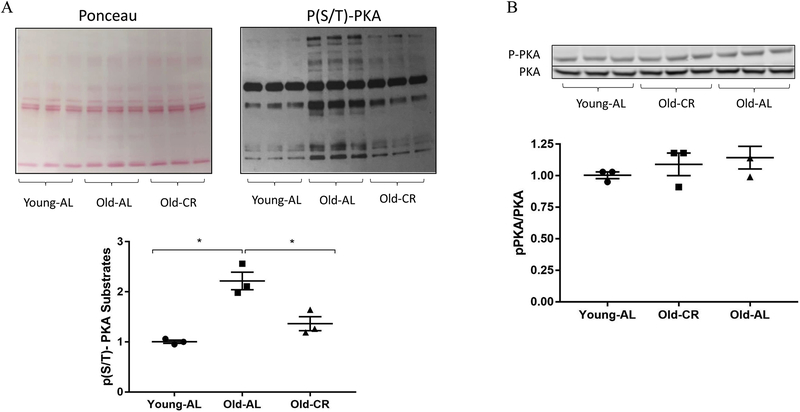
To identify kinase activity through phosphorylation of known downstream targets, we made use of kinase-substrate enrichment analysis (KSEA) [8]. KSEA estimates a given kinase’s activity by evaluating the collective changes in phosphorylation of all its known substrates measured in the dataset. Using this approach, we identified substrates of Akt, MAPK and the catalytic subunit of Protein kinase A (Prkaca or PKA) as being significantly increased with age (Figure 2A). Interestingly, Akt signaling was increased with age and CR, giving support to the paradoxical nature of Akt and its situational downstream targets with aging. Another pathway that was significantly increased with aging while being the top pathway to decrease with CR was PKA (Fig. 2A). Details for these plots (such as z-scores and p-values) are shown in Table 1. A plot depicting previously annotated connections between kinases and substrates identified by KSEA shows that Prkaca had the highest number of substrates measured (Fig. 2B). Volcano plots illustrate the majority of the measured PKA-targeted phosphopeptides were upregulated by aging (Young-AL vs. Old-AL) and suppressed by CR diet (Old-AL vs. Old-CR) (Fig. 2C). To validate these findings, we used the same samples used for phosphoproteomics to perform an immunoblot with an antibody against phosphorylated PKA substrates. Although we acknowledge the possible promiscuity of the antibody, sharing substrate specificity with other kinases such as Akt and PKC, this approach recapitulated the age-related increase in substrate phosphorylation and its suppression by CR, thereby validating our KSEA results (Fig. 3A). To determine if this altered global PKA substrate phosphorylation was the result of PKA regulation by its own phosphorylation, we measured phospho-PKA levels at Thr197 by immunoblot and found no differences in phospho-PKA levels across the same samples (Fig 3B). This suggests that the dynamic changes in PKA-substrate phosphorylation were not associated with concurrent phosphorylation-regulated PKA activity at the given time point. Further investigation is needed to understand upstream activation of PKA with aging and CR.
Fig. 2.
Pathway analysis reveals that PKA pathway is activated by aging and suppressed by CR. (A) Output of kinase-substrate enrichment analysis (KSEA). Red and blue bars indicate significant differences (p < 0.05). (B) Depiction of kinase-substrate links produced by analysis in (A). (C) Volcano plots for Old-AL vs. Young-AL, and Old-CR vs. Old-AL comparisons. Data points in maroon indicate known PKA targets identified by KSEA.
Table 1.
Statistical output for the analysis depicted in Figure 2A. mS refers to the mean log2FC for all the kinase’s substrates; Enrichment is the background-adjusted value of the kinase’s mS; m is the total number of detected substrates for each kinase in the given dataset; z.score is the normalized weighted score for each kinase; and p.value is the statistical assessment of the z.score.
| Old-AL vs. Young-AL | ||||||
| Kinase | log2FC | mS | Enrichment | m | z.score | p.value |
| Akt1 | 0.772913 | 0.772913 | 4.864807356 | 5 | 2.969199 | 0.001493 |
| Mapk14 | 0.613815 | 0.613815 | 3.86342894 | 5 | 2.199874 | 0.013908 |
| Prkaca | 0.404018 | 0.404018 | 2.542937765 | 10 | 1.676389 | 0.046831 |
| Prkaa1 | 0.436001 | 0.436001 | 2.744246924 | 6 | 1.467946 | 0.071059 |
| Mapk1 | 0.376791 | 0.376791 | 2.371567959 | 6 | 1.154302 | 0.124188 |
| Mtor | 0.351794 | 0.351794 | 2.214232646 | 6 | 1.02189 | 0.153417 |
| Prkca | 0.177378 | 0.177378 | 1.116439194 | 6 | 0.097994 | 0.460968 |
| Old-CR vs. Old-AL | ||||||
| Kinase | log2FC | mS | Enrichment | m | z.score | p.value |
| Akt1 | 0.248203 | 0.248203 | 19.64769106 | 5 | 1.675636 | 0.046905 |
| Prkaa1 | 0.008721 | 0.008721 | 0.690349965 | 6 | 0.150271 | 0.440275 |
| Mtor | 0.002931 | 0.002931 | 0.232047638 | 6 | 0.109528 | 0.456392 |
| Mapk14 | −0.22758 | −0.22758 | −18.0148868 | 5 | −1.38082 | 0.083667 |
| Mapk1 | −0.25221 | −0.25221 | −19.9647463 | 6 | −1.68595 | 0.045902 |
| Prkca | −0.30694 | −0.30694 | −24.2971956 | 6 | −2.07111 | 0.019174 |
| Prkaca | −0.34876 | −0.34876 | −27.6075815 | 10 | −3.05372 | 0.00113 |
Fig. 3.
(A) Ponceau S staining and immunoblot to detect phospho-PKA substrates (*p < 0.05; two-tailed t-test). (B) Immunoblot for phospho- and total-PKA. Data are shown as mean ± standard error of the mean. N=3/group.
Genetic disruption of PKA signaling has been shown to significantly increase the lifespan of yeast cells [9]. These findings have been extended to the mouse. PKA is comprised of two regulatory subunits, RI and RII, that are activated by cAMP to release two catalytic subunits, Cα and Cβ. Mice null for the β isoform of the RII regulatory subunit live significantly longer, are more insulin sensitive, and demonstrate improved echocardiographic parameters [10, 11]. Combined CR and perturbation of PKA signaling has also been shown to have an additive effect on lifespan increase in yeast [9]. Significantly, prolonged fasting (48 hours) has been shown to have beneficial effects on hematopoiesis in mice via the suppression of PKA [12]. These results suggest that CR could have an inhibitory effect on PKA signaling in organs beyond skeletal muscle.
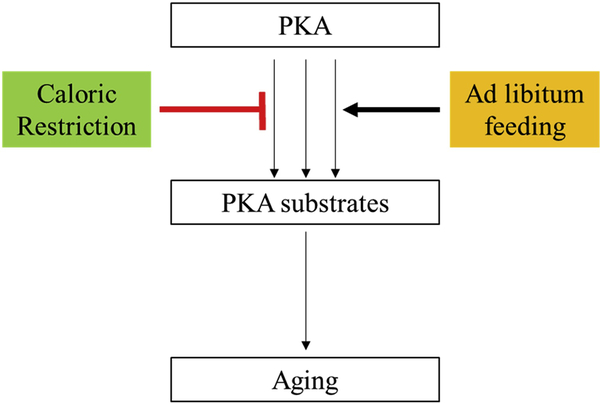
To our knowledge, this is the seminal study to demonstrate that CR suppresses PKA signaling in skeletal muscle, a known anti-aging signaling axis. Our data validate CR-related signaling events in mammalian skeletal muscle, being consistent with reports from other model organisms. Our proposed model of how CR might partially exert its anti-aging effects is depicted in Fig. 4. Taken together, our data indicate that long-term CR and aging are defined by unique skeletal muscle phosphoproteomic signatures, and that CR inhibits age-related increases in PKA-mediated phosphorylation events.
Fig. 4.
Working model.
Methods
Animals, diets and harvest.
Male C57BL/6J mice were used in this study. The mice belonged to one of three groups — 3 month-old mice fed on an ad libitum diet (Young-AL); 27 month-old mice fed on an ad libitum diet (AL); and 27 month-old mice that had been on a calorically-restricted diet (30% reduction) from the age of 14 weeks (CR). CR mice were fed daily at the same time in the morning (9 AM). AL and CR mice were obtained from the National Institute on Aging. 12 hours prior to tissue harvest, all mice were transferred to new cages that contained no food. All animals were euthanized the following morning between 7–8am, using CO2 gas. All animal care followed the guidelines and was approved by the Institutional Animal Care and Use Committees at Duke Medical Center.
Phosphoproteomics.
Phophoproteomics sample preparation
Quadriceps tissue was harvested, flash-frozen in liquid nitrogen, and stored at −80°C until further processing. Phosphoproteomics sample preparation was performed based on a previously described workflow [6, 13].
Nano-LC-MS/MS
All samples were subjected to nanoLC-MS/MS analysis using an EASY-nLC ultra-performance liquid chromatography system (Thermo Fisher Scientific) coupled to a Q Exactive Plus Hybrid Quadrupole-Orbitrap mass spectrometer (Thermo Fisher Scientific) via an EASY-Spray nanoelectrospray ionization source (Thermo Fisher Scientific). Prior to injection, the two sample fractions were resuspended in 22.5 μL (phosphopeptides) or 250 μL (input) of 0.1% FA. Both sample fractions were analyzed with technical triplicate runs, injecting 6.5 μL (phosphopeptide) or 1 μL (approximately 1 μg of the input) for each. For each injection, the sample was first trapped on an Acclaim PepMap 100 C18 trapping column (3 μg particle size, 75 μm × 20 mm) with 15 μL (phosphopeptide) or 4 μL (input) of solvent A (0.1% FA) at a variable flow rate dictated by a maximum pressure of 500 bar, after which the analytical separation was performed over a 105 min (phosphopeptide) or 210 min (input) gradient (flow rate of 300 nl/min) of 5% to 40% solvent B (90% ACN, 0.1% FA) using an Acclaim Pep-Map RSLC C18 analytical column (2-ugparticle size, 75μ g ×500 mm column (Thermo Fisher Scientific) with a column temperature of 55 °C. MS1 (precursor ions) was performed at 70,000 resolution with an AGC target of 3 × 10⁶ ions and a maximum injection time of 60 ms. MS2 spectra (product ions) were collected by data-dependent acquisition of the top 10 most abundant precursor ions with a charge greater than 1 per MS1 scan, with dynamic exclusion enabled for a window of 30 s. Precursor ions were filtered with a 0.7 m/z isolation window and fragmented with a normalized collision energy of 30. MS2 scans were performed at 35,000 resolution, with an AGC target of 1 × 10⁵ ions and a maximum injection time of 60 ms.
Proteomics data analysis
Data were searched against the UniProt mouse complete proteome database of reviewed (Swiss-Prot) and unreviewed (TrEMBL) proteins, which consisted of 54,185 sequences on the date of download (3/6/2019). Data analysis was performed using Proteome Discoverer 2.3, searching with both Sequest HT and MS Amanda 2.0 with the following default parameters: oxidation (15.995 Da on M) as a variable modification and carbamidomethyl (57.021 Da on C) and TMT10plex (229.163 Da on peptide N-term and K) as fixed modifications, and 2 missed cleavages (full trypsin specificity). TMT labeling efficiency was assessed as a quality control measure by searching the input fraction for N-terminal TMT as a variable modification—confirming labeling efficiency was 93.6%. All phosphopeptide runs included phosphorylation (79.966 Da on S, T, or Y) as a variable modification. PSMs from each search algorithm were filtered to a 1% FDR using Percolator [14] and PTM site localization probabilities were determined using ptmRS [15]. PSMs were grouped to unique peptides while maintaining a 1% FDR for peptides and a 90% localization threshold for PTMs—with quantitation for different phosphopeptide positional isoforms separated via the Peptide Isoform Grouper node. Peptides from phosphopeptide and input fractions were grouped to proteins using the rules of strict parsimony and proteins were filtered to 1% FDR using the Protein FDR Validator node. Reporter ion intensities for all PSMs with co-isolation interference below 0.5 (50% of the ion current in the isolation window) and an average S/N >5 for reporter ions were summed together at the peptide and protein level, but quantification for each data type (phospho, input) were kept separate. Peptides shared between protein groups were excluded from protein quantitation calculations. Protein and Peptide Isoforms tabs from the PD2.3 results were exported as tab delimited .txt files and analyzed with an in-house Python module based on a workflow previously described [6]. Briefly, peptide group reporter intensities for each peptide group in the input material were summed together for each TMT channel, each channel’s sum was divided by the average of all channels’ sums, resulting in channel-specific loading control normalization factors to correct for any deviation from equal protein/peptide input into the nine-sample comparison. Reporter intensities for peptide isoforms from the phosphopeptide runs and proteins from the input fraction runs were divided by the loading control normalization factors for each TMT channel, respectively. All loading control-normalized quantitation values were converted to Log2 space. Fold-changes, p-values (two-tailed t-test), and adjusted P-values (following Benjamini-Hochberg correction) were calculated using the Log2 phosphopeptide data.
Immunoblotting.
Immunoblotting analysis was performed as previously described [16, 17]. In brief, protein was extracted from frozen tissue in Cell Lysis Buffer 10× (Cell Signaling Technology) supplemented with phosphatase (Roche) and protease (Sigma) inhibitors. Tissue disruption was performed in a Tissuelyser II (Qiagen). Proteins were resolved on an SDS-PAGE gel (Life Technologies) and transferred to a nitrocellulose membrane (Bio-Rad). Equal loading was confirmed by Ponceau S staining (Sigma). The following antibodies were used: Phospho-(Ser/Thr) PKA Substrate (#9621), Phospho-PKA C Thr197 (#4781), and PKA C-α (#4782) (all from Cell Signaling Technology). All antibodies were applied at a 1:1000 concentration. Proteins were visualized on a LI-COR gel imager (LI-COR Biosciences). Band intensities were determined using Image Studio (Version 3.1) software.
Statistical analysis.
Data were analysed by unpaired Student’s t-test. All data are presented as mean +/− standard error of the mean. A value of p < 0.05 was considered to be statistically significant. Statistical analysis was performed on GraphPad Prism 7.0. PCA and KSEA were performed in R (version 3.6.2) and RStudio (version 1.2.1335).
Supplementary Material
Highlights.
Aging causes alterations in the skeletal muscle phosphoproteome
Chronic CR maintains a “youthful” phosphoproteome in skeletal muscle.
CR suppresses PKA signaling in skeletal muscle, a known pro-aging signaling axis.
Acknowledgements
The authors would like to thank Dr. Sarah A. Hannou for her critical input and Georgios Karamanis for inspiration for the plot depicted in Fig. 2B.
Funding
J.P.W. was supported by funds from the Duke Aging Center/Pepper Center (grant no. P30-AG028716) and NIH/NIA grant no. K01AG056664. D.E.L is supported by the NIH training grant (no. T32HL007057). P.A.G. is supported by the American Heart Association (grant no. 18CDA34110216).
Footnotes
Publisher's Disclaimer: This is a PDF file of an unedited manuscript that has been accepted for publication. As a service to our customers we are providing this early version of the manuscript. The manuscript will undergo copyediting, typesetting, and review of the resulting proof before it is published in its final form. Please note that during the production process errors may be discovered which could affect the content, and all legal disclaimers that apply to the journal pertain.
Conflict of interest
The authors report no conflict of interest, financial or otherwise.
Data sharing statement
All raw data for proteomics experiments are provided in supplementary table 1. It is also available online using accession number “PXD018455” for Proteome Xchange [18] and accession number “JPST000789” for jPOST Repository [19]. Any additional data that support the findings of this study are available from the corresponding author on reasonable request.
References
- 1.Bareja A, Lee DE, and White JP, Maximizing Longevity and Healthspan: Multiple Approaches All Converging on Autophagy. Front Cell Dev Biol, 2019. 7: p. 183. [DOI] [PMC free article] [PubMed] [Google Scholar]
- 2.Rusli F, et al. , Plasticity of lifelong calorie-restricted C57BL/6J mice in adapting to a medium-fat diet intervention at old age. Aging Cell, 2018. 17(2). [DOI] [PMC free article] [PubMed] [Google Scholar]
- 3.Cerletti M, et al. , Short-term calorie restriction enhances skeletal muscle stem cell function. Cell Stem Cell, 2012. 10(5): p. 515–9. [DOI] [PMC free article] [PubMed] [Google Scholar]
- 4.Etienne J, et al. , Skeletal muscle as an experimental model of choice to study tissue aging and rejuvenation. Skelet Muscle, 2020. 10(1): p. 4. [DOI] [PMC free article] [PubMed] [Google Scholar]
- 5.White PJ, et al. , The BCKDH Kinase and Phosphatase Integrate BCAA and Lipid Metabolism via Regulation of ATP-Citrate Lyase. Cell Metab, 2018. 27(6): p. 1281–1293 e7. [DOI] [PMC free article] [PubMed] [Google Scholar]
- 6.Fisher-Wellman KH, et al. , Respiratory Phenomics across Multiple Models of Protein Hyperacylation in Cardiac Mitochondria Reveals a Marginal Impact on Bioenergetics. Cell Rep, 2019. 26(6): p. 1557–1572 e8. [DOI] [PMC free article] [PubMed] [Google Scholar]
- 7.Gnad F, Gunawardena J, and Mann M, PHOSIDA 2011: the posttranslational modification database. Nucleic Acids Res, 2011. 39(Database issue): p. D253–60. [DOI] [PMC free article] [PubMed] [Google Scholar]
- 8.Wiredja DD, Koyuturk M, and Chance MR, The KSEA App: a web-based tool for kinase activity inference from quantitative phosphoproteomics. Bioinformatics, 2017. 33(21): p. 3489–3491. [DOI] [PMC free article] [PubMed] [Google Scholar]
- 9.Wei M, et al. , Life span extension by calorie restriction depends on Rim15 and transcription factors downstream of Ras/PKA, Tor, and Sch9. PLoS Genet, 2008. 4(1): p. e13. [DOI] [PMC free article] [PubMed] [Google Scholar]
- 10.Enns LC, Pettan-Brewer C, and Ladiges W, Protein kinase A is a target for aging and the aging heart. Aging (Albany NY: ), 2010. 2(4): p. 238–43. [DOI] [PMC free article] [PubMed] [Google Scholar]
- 11.Enns LC, et al. , Disruption of protein kinase A in mice enhances healthy aging. PLoS One, 2009. 4(6): p. e5963. [DOI] [PMC free article] [PubMed] [Google Scholar]
- 12.Cheng CW, et al. , Prolonged fasting reduces IGF-1/PKA to promote hematopoietic-stem-cell-based regeneration and reverse immunosuppression. Cell Stem Cell, 2014. 14(6): p. 810–23. [DOI] [PMC free article] [PubMed] [Google Scholar]
- 13.Grimsrud PA, et al. , A quantitative map of the liver mitochondrial phosphoproteome reveals posttranslational control of ketogenesis. Cell Metab, 2012. 16(5): p. 672–83. [DOI] [PMC free article] [PubMed] [Google Scholar]
- 14.Kall L, et al. , Semi-supervised learning for peptide identification from shotgun proteomics datasets. Nat Methods, 2007. 4(11): p. 923–5. [DOI] [PubMed] [Google Scholar]
- 15.Taus T, et al. , Universal and confident phosphorylation site localization using phosphoRS. J Proteome Res, 2011. 10(12): p. 5354–62. [DOI] [PubMed] [Google Scholar]
- 16.White JP, et al. , The AMPK/p27(Kip1) Axis Regulates Autophagy/Apoptosis Decisions in Aged Skeletal Muscle Stem Cells. Stem Cell Reports, 2018. 11(2): p. 425–439. [DOI] [PMC free article] [PubMed] [Google Scholar]
- 17.Baht GS, et al. , Meteorin-like facilitates skeletal muscle repair through a Stat3/IGF-1 mechanism. Nature Metabolism, 2020. 2(3): p. 278–289. [DOI] [PMC free article] [PubMed] [Google Scholar]
- 18.Deutsch EW, et al. , The ProteomeXchange consortium in 2017: supporting the cultural change in proteomics public data deposition. Nucleic Acids Res, 2017. 45(D1): p. D1100–D1106. [DOI] [PMC free article] [PubMed] [Google Scholar]
- 19.Okuda S, et al. , jPOSTrepo: an international standard data repository for proteomes. Nucleic Acids Res, 2017. 45(D1): p. D1107–D1111. [DOI] [PMC free article] [PubMed] [Google Scholar]
Associated Data
This section collects any data citations, data availability statements, or supplementary materials included in this article.


