Abstract
During clathrin-mediated endocytosis, dozens of proteins assemble into an interconnected network at the plasma membrane. As initiators of endocytosis, Eps15 and Fcho1/2 concentrate downstream components, while permitting dynamic rearrangement within the budding vesicle. How do initiator proteins meet these competing demands? Here we show that Eps15 and Fcho1/2 rely on weak, liquid-like interactions to catalyze endocytosis. In vitro, these weak interactions promote the assembly of protein droplets with liquid-like properties. To probe the physiological role of these liquid-like networks, we tuned the strength of initiator protein assembly in real time using light-inducible oligomerization of Eps15. Low light levels drove liquid-like assemblies, restoring normal rates of endocytosis in mammalian Eps15 knockout cells. In contrast, initiator proteins formed solid-like assemblies upon exposure to higher light levels, which stalled vesicle budding, likely owing to insufficient molecular rearrangement. These findings suggest that liquid-like assembly of initiator proteins provides an optimal catalytic platform for endocytosis.
Clathrin-mediated endocytosis (CME) is driven by the assembly of a highly interconnected network of adaptor proteins that participate in cargo selection, clathrin recruitment, and membrane bending. A small subset of adaptor proteins is the first to arrive at endocytic sites1,2. These initiators include Fcho1/2, Eps15/Eps15R, and intersectin, which assemble to promote recruitment of downstream adaptors3. Specifically, Fcho and Eps15 work together to recruit AP-2, which promotes maturation of the nascent endocytic structure4–6, alongside other adaptors 7,8. Fcho binds Eps15 through interactions between its C-terminal μHD and motifs in Eps15’s intrinsically disordered C-terminus6,9. Fcho dimerizes through its F-BAR domain10. Eps15 dimerizes via its coiled-coil (CC) domain and takes on an antiparallel tetrameric conformation via interactions between its N-terminal EH domains and C-terminal disordered region9,11. Therefore, each Fcho dimer can interact with multiple Eps15 oligomers, suggesting an interconnected initiator protein network. Loss of both Fcho1 and Eps15 results in less productive CME3,6.
Interestingly, Fcho and Eps15 are thought to be pushed to the edges of the growing pit, where they are ultimately excluded from the budding vesicle12,13. This finding illustrates the importance of dynamic rearrangements during the initiation of CME and also suggests that Fcho and Eps15 can be thought of as “catalysts” of endocytosis, because they accelerate the assembly of vesicles but are left behind as the vesicle “product” departs from the membrane.
Here we set out to determine the physical properties that make the initiator proteins effective catalysts. Using purified proteins in vitro, we find that Fcho1 and Eps15 utilize multivalent interactions to assemble into liquid-like protein droplets. Knockout of Eps15 in mammalian epithelial cells results in a substantial increase in the fraction of short-lived, abortive endocytic events, consistent with previous findings14,15. We replaced Eps15 in these cells with a chimeric form that provided light-activated control over the strength of initiator protein interactions. Application of low light restored wild-type levels of productive endocytosis. In contrast, exposure to stronger light drove solid-like assembly, leading to stalled, unproductive endocytic structures. Together these results suggest that liquid-like assembly of intiator proteins permits dynamic protein rearrangement in nascent vesicles, thereby providing an optimum catalyst for endocytosis.
Results
Initiator proteins co-assemble on membrane surfaces
We first examined assembly of 6xHis-Eps15 and Fcho1/2 on the surfaces of giant unilamellar vesicles (GUVs). Fluorescently labeled full-length proteins at a concentration of 500 nM were introduced to GUVs containing PtdIns(4,5)P2. Individually, both Eps15 and Fcho1/2 decorated these GUVs homogeneously (Fig. 1a, Extended Data Fig. 1a). On PtdIns(4,5)P2-containing GUVs, Fcho1/2 was required to recruit Eps15 to the membrane (Fig. 1b). At these concentrations, Eps15 saturated the available Fcho1/2 binding sites. In more than 70% of vesicles, the proteins co-partitioned into protein-rich and protein-poor domains on the membrane surface (Fig. 1c–e,g, Extended Data Fig. 1b, Extended Data Fig. 2). The protein-rich domains typically consisted of a single bright region (Fig. 1c) or several bright, rounded regions (Fig. 1d). Eps15 assembly on PtdIns(4,5)P2 membranes was unaffected by a 6xHis tag (Fig. 1e). By comparison, a membrane dye, TR-DHPE, maintained a relatively homogenous distribution (Fig. 1f).
Figure 1. Eps15 and Fcho1 assemble into protein-rich domains on membrane surfaces.
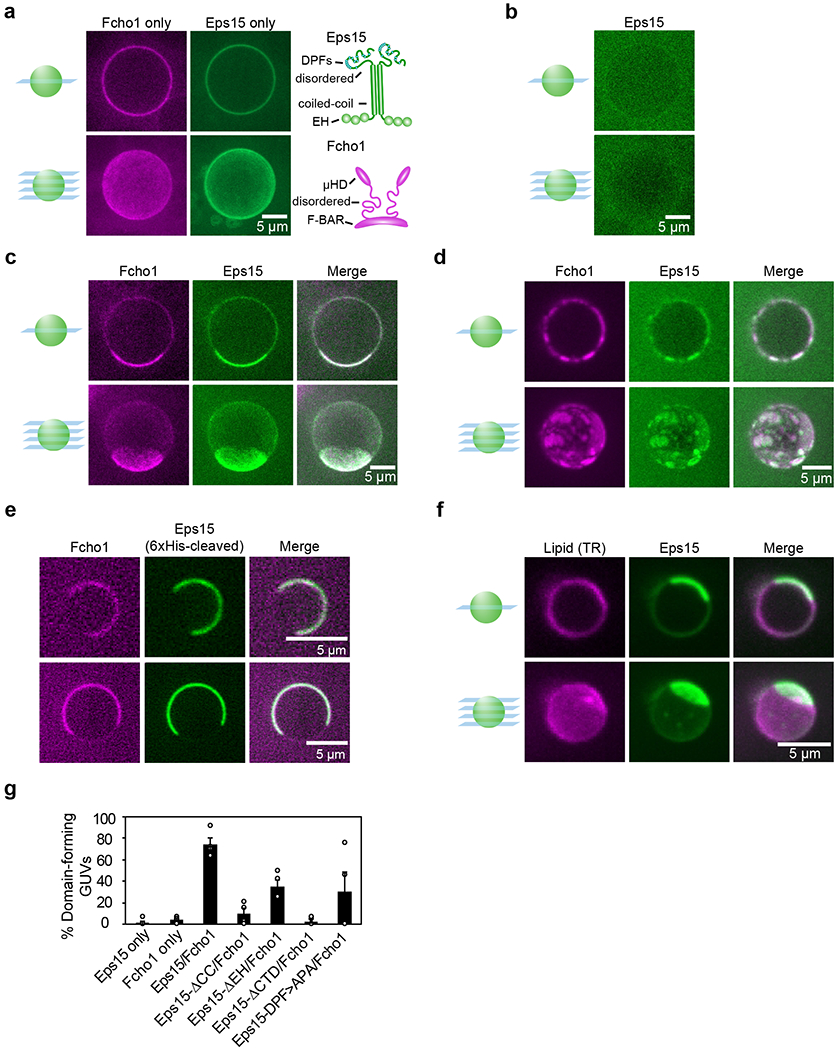
(a-d) Center slices (top) and corresponding z-projections (bottom) of representative GUVs incubated with 500 nM of the indicated protein(s): Atto-594-labeled Fcho1 and CF488a-labeled Eps15 variants. Eps15 variants contain an N-terminal 6xHis tag. GUVs contain 79% DOPC, 15% DOPS, 5% PtdIns(4,5)P2, and 1% DPEG10-biotin unless otherwise indicated. (a) Full-length Fcho1 alone on GUVs, (left) and full-length Eps15 alone on GUVs containing 97% DOPC, 2% DOGS-NTA-Ni, 1% DPEG10-biotin (center). Cartoons (right) depict domain organization of Fcho1 and Eps15 dimeric forms. (c) GUVs incubated with both Fcho1 and Eps15 display a single protein-rich domain or (d) several protein-rich domains. (e) Two representative center slices of GUVs bound with Eps15 lacking the 6x histidine tag and Fcho1, which co-assemble into protein-rich domains on the membrane (left). Domains were observed on 83 ±2% (SEM) of GUVs (49 GUVs, n=4 biologically independent experiments). (f) GUVs labeled with 0.1% Texas Red-DHPE lipid were incubated with 500 nM each of CF488a-labeled Eps15 and unlabeled Fcho1. (g) Frequency of GUVs displaying protein-rich domains for each set of proteins. GUVs were counted as displaying protein-rich domains if they contained distinct regions in which protein signal intensity differed by at least 2-fold and the bright region covered at least 10% of the GUV surface in any z-slice. For each bar, n=4 biologically independent experiments with at least 40 total GUVs for each condition. All GUV experiments were conducted at room temperature, 22°C. Scale bars are 5 μm. Data are presented as mean ± SEM. See Source Data Figure 1.
How does the assembly of protein-rich and protein-poor domains depend upon interactions between Eps15 and Fcho1/2? Eps15 contains three N-terminal EH domains, followed by a dimerizing CC domain and a ~358 amino acid C-terminal intrinsically disordered region3,9,12 (Fig. 1a). Interspersed throughout the disordered region are 15 tripeptide Asp-Pro-Phe (DPF) motifs, which bind the μHD of Fcho1/2 as well as the EH domains of Eps1516,17. We found that removal of the EH, CC, or C-terminal domains or mutation of the DPF motifs in Eps15’s CTD all inhibited domain formation to varying degrees, with the CC domain having the strongest effect (Fig. 1g, Fig., 2a–d). Each Eps15 mutant alone decorated Ni-NTA-containing GUVs homogeneously (Fig. 2e). These results indicate that several multivalent interactions are required for synergistic assembly of Eps15 and Fcho1 into an extended network.
Figure 2. Eps15 and Fcho1 require multivalent interactions to assemble on membrane surfaces.
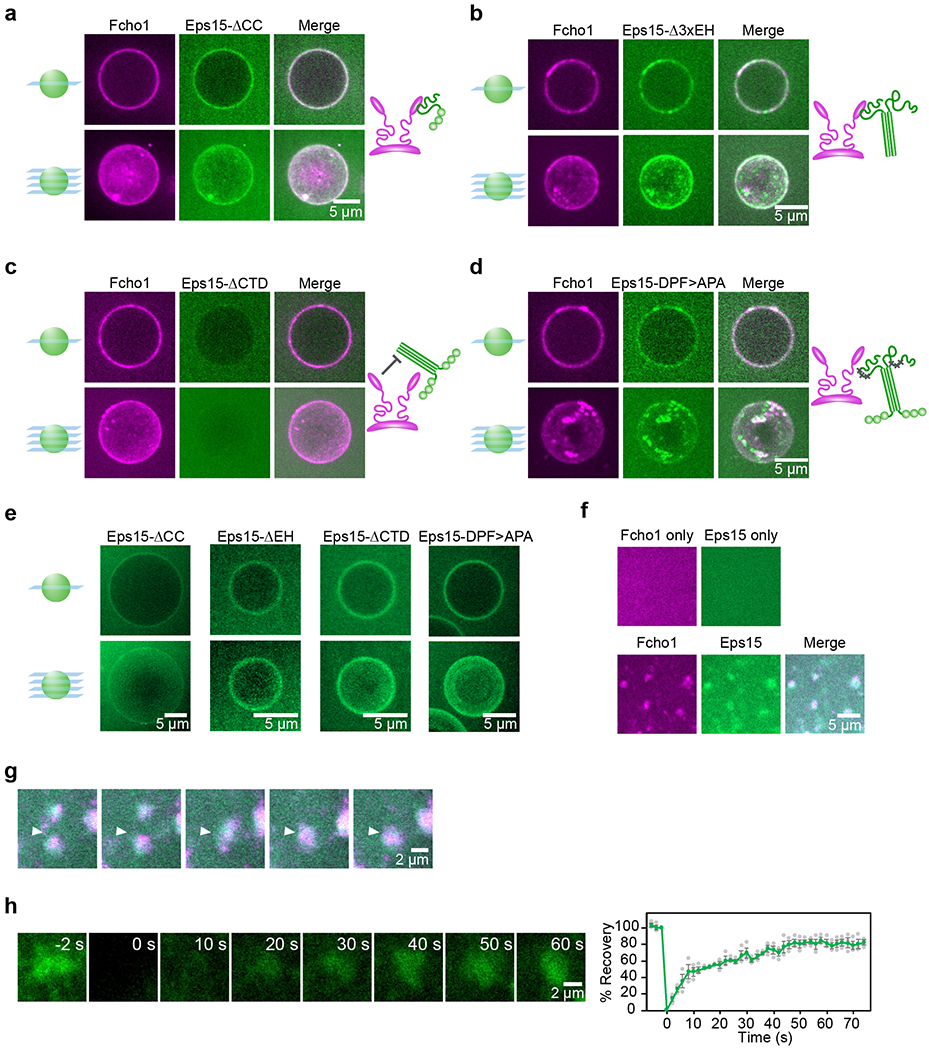
(a-e) 500 nM of the indicated proteins were incubated with GUVs containing 79% DOPC, 15% DOPS, 5% PtdIns(4,5)P2, and 1% DPEG10-biotin. Upper panels display single center z-slices, lower panels display maximum-projected z-stacks. Fcho1 is labeled with Atto594. 6xHis-Eps15 variants are labeled with CF488a. Cartoons depict binding interaction between Fcho1 and Eps15 mutants. (a) GUVs incubated with Fcho1 and Eps15 lacking the coiled-coil domain (Eps15-ΔCC). (b) Fcho1 and Eps15 lacking the EH domains (Eps15-Δ3xEH) occasionally co-assemble into small protein-rich domains. (c) Eps15 lacking the C-terminal disordered domain (Eps15-ΔCTD) is not recruited to GUV surfaces by Fcho1. (d) Eps15 containing mutated Fcho1-binding DPF motifs (amino acids 623-636; Eps15-DPF>APA) co-assembles with Fcho1 into small protein-rich domains. (e) Without Fcho1, Eps15 mutants decorate GUVs homogeneously. GUVs contain 97% DOPC, 2% DOGS-NTA-Ni, 1% DPEG10-biotin. (f-h) Multibilayers containing 73% DOPC, 25% DOPS, and 2% DOGS-NTA-Ni were incubated with 100 nM Atto594-labeled Fcho1, or 100 nM CF488a-labeled Eps15, or both. (f) Fcho1 and Eps15 individually decorate multibilayers homogeneously. When combined, Fcho1 and Eps15 form micron-scale protein-rich regions. (g) Time course of protein-rich Eps15/Fcho1 domains merging on a multibilayer, 6 s intervals. (h) Representative images and plot of fluorescence recovery after bleaching Eps15 (green)/Fcho1 (unlabeled) protein domains on multibilayers. n=3 biologically independent samples. All experiments were conducted at room temperature, 22°C. Scale bars are 5 μm (a-f), or 2 μm (g-h). Data are presented as mean ± SEM. See Source Data Figure 2.
We next observed the dynamics of Eps15/Fcho1 assemblies on the surfaces of flat, lipid multibilayer stacks adhered to coverslips18. As on GUVs, Eps15 and Fcho1 bound uniformly to multibilayers when applied individually (Fig. 2f). However, when applied together at a concentration of 100 nM each, the two proteins rapidly condensed into bright micron-scale domains (Fig. 2f, Extended Data Fig. 2). When domains came into contact with each other, they readily merged together (Fig. 2g, Supplementary Video 1), suggesting fluid-like assemblies. Additionally, the domains recovered rapidly after photobleaching (Fig. 2h, t1/2 = 19 s, 74 ± 6% mobile fraction), indicating rapid molecular exchange. Together these data suggest that assemblies of Eps15 and Fcho1 bear some of the hallmarks of liquid-liquid phase separation, including (i) substantial regions of intrinsic disorder19,20, (ii) the ability to form an extended network based on weak multivalent interactions21,22, (iii) fluidity, and (iv) rapid molecular exchange with molecules in solution23.
Initiator proteins form liquid-like droplets in solution
We next examined the thermodynamic properties of Eps15/Fcho1 assemblies. These experiments required changes in temperature which destabilized membrane substrates. Therefore we examined protein assembly in solution, without membranes. We first examined full-length 6xHis-Eps15 in solution, adding 3% polyethylene glycol (PEG) to mimic the crowded cellular environment24. At protein concentrations of 4 μM or higher, Eps15 alone readily assembled into large droplets (Fig. 3a) that fused together upon contact and re-rounded within 1-2 seconds (Fig. 3b, Supplementary Video 2). Furthermore, fluorescence recovery after photobleaching (FRAP) of Eps15 droplets revealed rapid exchange of proteins between droplets and the surrounding solution, with t1/2 = 25 s and a mobile protein fraction of 80 ± 5% (SEM, Fig. 3c). The 6xHis tag had no obvious affect on Eps15 assembly (Fig. 4a).
Figure 3: Eps15 and Fcho1 co-assemble into liquid-like protein droplets.
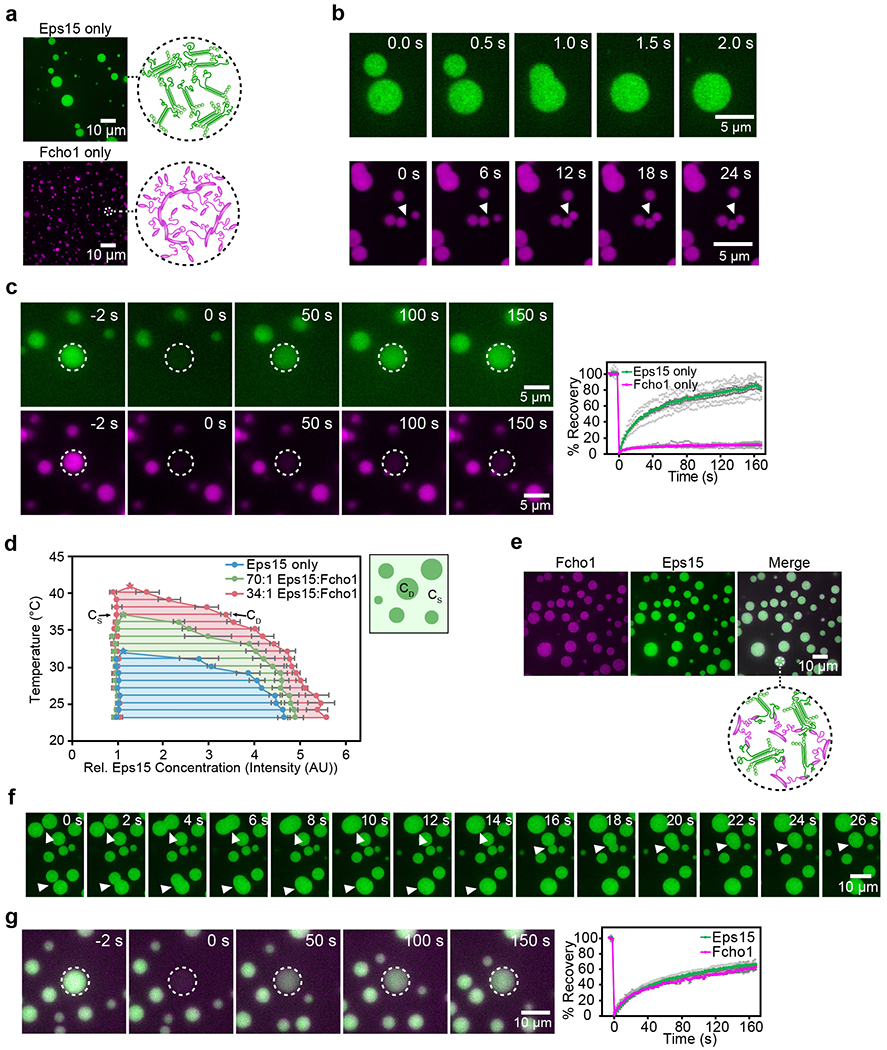
Fcho1 is labeled with Atto-594, Eps15 or Eps15-ΔCC is labeled with CF488a. All droplet experiments are at pH 7.5, 150 mM NaCl with 3% PEG. (a) 7 μM Eps15 forms large, rounded droplets, 7 μM Fcho1 clusters into small, irregular aggregates. Insets show cartoon of inferred protein network assembly within droplets. (b) Time course of Eps15-only droplets (upper panels) undergoing fusion (arrowheads) and Fcho1-only aggregates (lower panels) approaching each other but failing to fuse. (c) Representative images of fluorescence recovery after bleaching an Eps15-only droplet (upper panels) and an Fcho1-only droplet (lower panels). Plot displays fluorescence recovery curves for each. n=6 biologically independent samples. (d) Phase diagram of Eps15/Fcho1 droplets mapped by CF488a-labeled Eps15 fluorescence intensity. Stars denote critical points for each set of Eps15:Fcho1 ratios. CS and CD indicate the concentration of Eps15 in solution and in droplets, respectively. Horizontal tie lines connect CS and CD for a given temperature. Total protein was held constant at 7 μM. n=3 biologically independent experiments. (e) When combined at a 1:34 ratio, Fcho1 and Eps15 co-localize in protein droplets. Inset shows cartoon of inferred protein network assembly within droplets, Fcho1 in magenta and Eps15 in green. (f) Time course of three fusion events (arrowheads) between droplets containing unlabeled Fcho1 and labeled Eps15. (g) Representative images and plot of fluorescence recovery after bleaching a Fcho1 and Eps15 droplet. n=4 biologically independent samples. All experiments were conducted at room temperature, 22°C, except as noted in d. All data are presented as mean ± SEM. See Source Data Figure 3.
Figure 4: Eps15 can be engineered to assemble into liquid-like protein droplets.
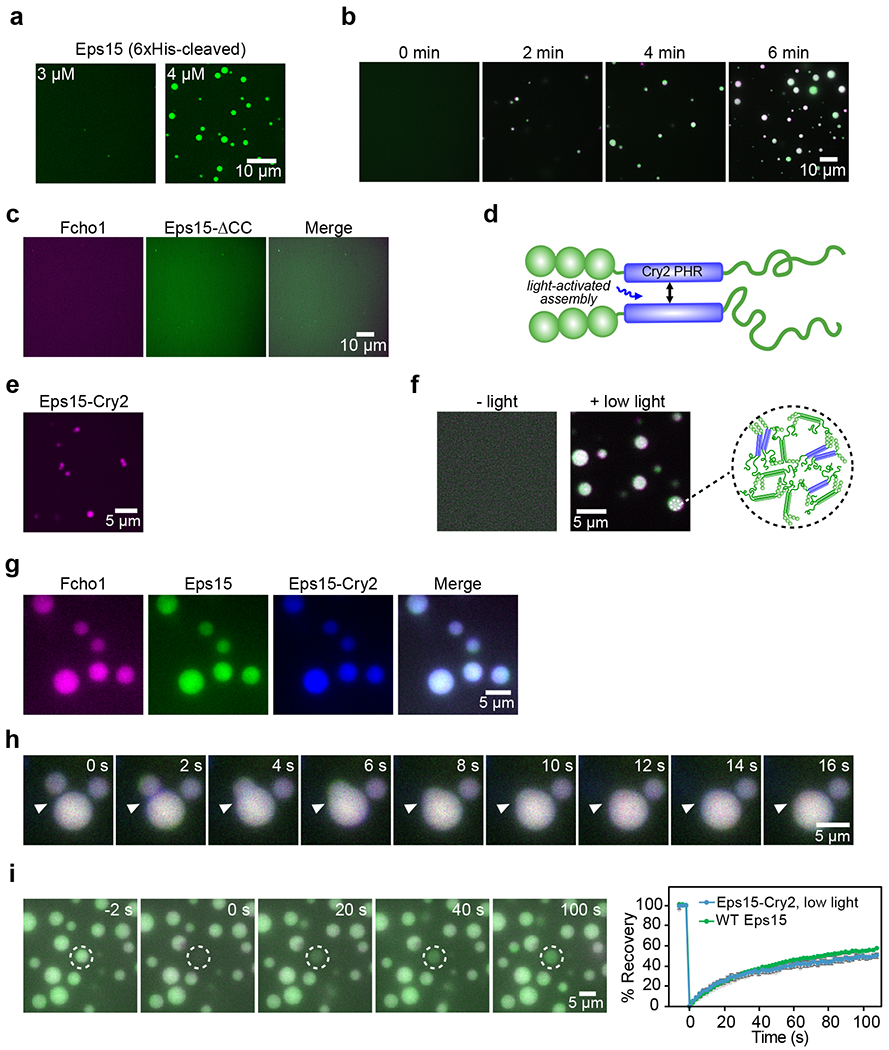
(a) Like 6xHis-Eps15, Eps15 lacking the 6x histidine tag forms droplets at a concentration of 4 μM, but does not form droplets at 3 μM. (b) Time course of protein phase separation induced by the addition of Fcho1 to Eps15. (c) At a 1 to 34 ratio, Fcho1 and Eps15-ΔCC do not co-assemble into droplets. (d) Diagram of Eps15-Cry2 chimera in which the Eps15 coiled-coil domain is replaced with the Cry2 PHR domain. Blue light exposure drives oligomeric association of Cry2 PHR domains. (e) 5 μM Atto594-labeled Eps15-Cry2 forms small, irregular aggregates in the absence of blue light. (f) In the absence of blue light, 1 μM Eps15 labeled with CF488a (green) and 3 μM Eps15-Cry2 labeled with Atto594 (magenta) are in a single dilute phase (left). Addition of blue light triggers droplet formation (right). Inset shows cartoon of inferred protein network assembly within blue-light induced droplets containing Eps15 and Eps15-Cry2. (g-h) 0.12 μM Atto594-labeled Fcho1 (magenta), 3 μM CF488a-labeled Eps15 (green), and 1 μM Atto647N-labeled Eps15-Cry2 (blue) were combined in solution and exposed to low blue light for 500 ms every 2 s for 1 minute. (g) Fcho1, Eps15, and Eps15-Cry2 colocalize in droplets after exposure to blue light. (h) Time course of fusion between Fcho1, Eps15, and Eps15-Cry2 droplets exposed to low blue light. (i) Recovery of Eps15 fluorescence after bleaching whole Eps15-Cry2/Eps15 droplets, labeled as in (f), is similar to the recovery of Eps15 in WT Eps15/Fcho1 droplets (from Fig. 2d). n=3 biologically independent samples. All experiments were conducted at room temperature, 22°C. Data are presented as mean ± SEM. See Source Data Figure 4.
The relative fluorescence intensity of the droplets compared to the surrounding solution provides an estimate of the relative protein concentration in the two phases, enabling us to map a temperature-concentration phase diagram. At each temperature, the relative concentrations of Eps15 in solution (CS) and in the droplets (CD) constitute a horizontal tie line, along which CS and CD remain constant with constant temperature 23,25 (Fig. 3d, blue). With increasing temperature, CS and CD meet at the critical temperature, beyond which the system becomes homogenous (Extended Data Fig. 3). Eps15 droplets dissolved at a critical temperature of approximately 32°C and reformed when the system was cooled (Supplementary Video 3). We next examined the impact of Fcho1 on the critical temperature, keeping the total protein concentration constant. In human cells Eps15 is one to two orders of magnitude more abundant than Fcho1 (76 nM vs. 3 nM in HeLa cells)26. At a ratio of Fcho1 to Eps15 of 1:70, the critical temperature shifted upward from 32°C to 37°C (Fig. 3d, green). A 1:34 ratio further shifted the critical temperature to 41°C (Fig. 3d, pink).
Unlike Eps15, Fcho1/2 on its own assembled into solid-like polymorphous aggregates (Fig. 3a, Extended Data Fig. 1c, Supplementary Video 2), which did not merge and re-round on contact (Fig. 3b) and displayed a mobile fraction of only 10 ± 1% (Fig. 3c, t1/2 = 17 s). In contrast, droplets containing both Fcho1/2 and Eps15 (1:34) re-rounded within several seconds (Fig. 3e–f, Extended Data Fig. 1d–e, Supplementary Video 2) and recovered rapidly after photobleaching, with a mobile molecular fraction of 71 ± 2% for Eps15 and 69 ± 7% for Fcho1 (Fig. 3g, t1/2 = 43 s and 53 s, respectively). Notably, protein intensity recovered in droplets to levels similar to those on multibilayers (74 ± 6%, Fig. 2h), though more slowly, likely as a result of the difference in dimensionality.
Further, addition of Fcho1 at a ratio of 1:25 to a homogenous, 3 μM solution of Eps15 triggered spontaneous co-assembly of both proteins into droplets within minutes (Fig. 4b, Supplementary Video 4). Additionally, we found that Eps15/Fcho1 droplets relied on multivalent interactions similar to those that were required for assembly of protein domains on membrane surfaces, (Fig. 4c, Extended Data Fig. 4). Altogether, these results suggest that a multivalent network between Eps15 and Fcho1/2 promotes assembly of liquid-like condensates. Importantly, two-dimensional, membrane-bound condensates were observed near physiological protein concentrations26, suggesting that they are more likely to form in cells compared to three-dimensional droplets.
Liquid-like assemblies of initiator proteins drive robust endocytosis
To probe the impact of a liquid-like initiator complex on the dynamics of endocytic events, we constructed a chimeric version of Eps15 that was capable of photo-activated assembly. Specifically, we replaced Eps15’s coiled-coil domain, a critical determinant of phase separation (Fig. 2a, Fig. 4c) with the PHR domain of Cry2 (Fig. 4d), which assembles into dimers and oligomers of increasing stability upon exposure to increasing levels of blue light27. Similar chimeras with intrinsically disordered domains have been shown to drive tunable protein droplet formation in the cytoplasm28.
We first tested the Eps15-Cry2 chimera in vitro. We found that a solution of only Eps15-Cry2 resulted in aggregation, owing to Cry2’s highly sensitive blue light response (Fig. 4e). Therefore, we also incorporated wild-type Eps15 to (i) prevent Cry2 oligomerization from being the dominant interaction driving assembly and (ii) mimic the cellular environment in which multiple different interactions exist. At a 1:3 ratio of Eps15-Cry2 to wild-type Eps15, droplets did not form in the absence of blue light. Under these conditions, Eps15-Cry2 appeared to behave similarly to Eps15-ΔCC (Fig. 4c, f). However, exposure to a low level (10 μW) of blue light induced the formation of droplets, which also incorporated wild-type Eps15 and Fcho1 (Fig. 4f, g). These droplets were liquid-like, merging readily with one another (Fig. 4h, Supplementary Video 5), and recovering rapidly after FRAP with a mobile fraction of 49 ± 1% and t1/2=26 s (Fig. 4i), similar to Eps15 recovery in droplets composed of wild-type Eps15 and Fcho1.
We next expressed Eps15-Cry2 in SUM159 human breast cancer-derived epithelial cells. These cells were gene-edited to incorporate a HaloTag on both alleles of the AP-2 σ2 subunit29. We used the far-red HaloTag ligand JF64630 to mark clathrin-coated structures. We further modified the cells using CRISPR to disrupt expression of both alleles of endogenous Eps15 (Extended Data Fig. 5a). We then transiently expressed either wild-type Eps15-mCherry or Eps15-Cry2-mCherry in the resulting Eps15 knockout cells.
Both Eps15-mCherry and Eps15-Cry2-mCherry colocalized with labeled AP-2 σ2 in punctate structures under TIRF imaging (Fig. 5a, Extended Data Fig. 5b). Eps15 signal appeared before AP-2 signal in a majority of structures, with a median difference of 3 s (Fig. 5b). Other components of the initiator protein complex, Fcho1 and Itsn1, colocalized to the same structures (Extended Data Fig. 5b). The lifetime of an endocytic structure on the plasma membrane, measured by the time between the arrival and departure of a labeled protein marker, can vary from tens of seconds to minutes31. In general, structures that appear for less than 20 s are considered to be “short-lived” and possibly abortive, based on previous work demonstrating that they rarely generate productive vesicles32. In contrast, “productive” structures, which produce vesicles, typically reside at the plasma membrane from 20 s to a few minutes31. Finally, clathrin-coated structures that fail to depart from the plasma membrane within 180 s are considered “long-lived”. These structures are thought to have stalled during endocytosis and either undergo delayed internalization or fail to form vesicles33. Each of these three populations appeared in our cells (Fig. 5a, Supplementary Video 6).
Figure 5: Lifetimes of endocytic pits correspond to abortive, productive, or stalled events.
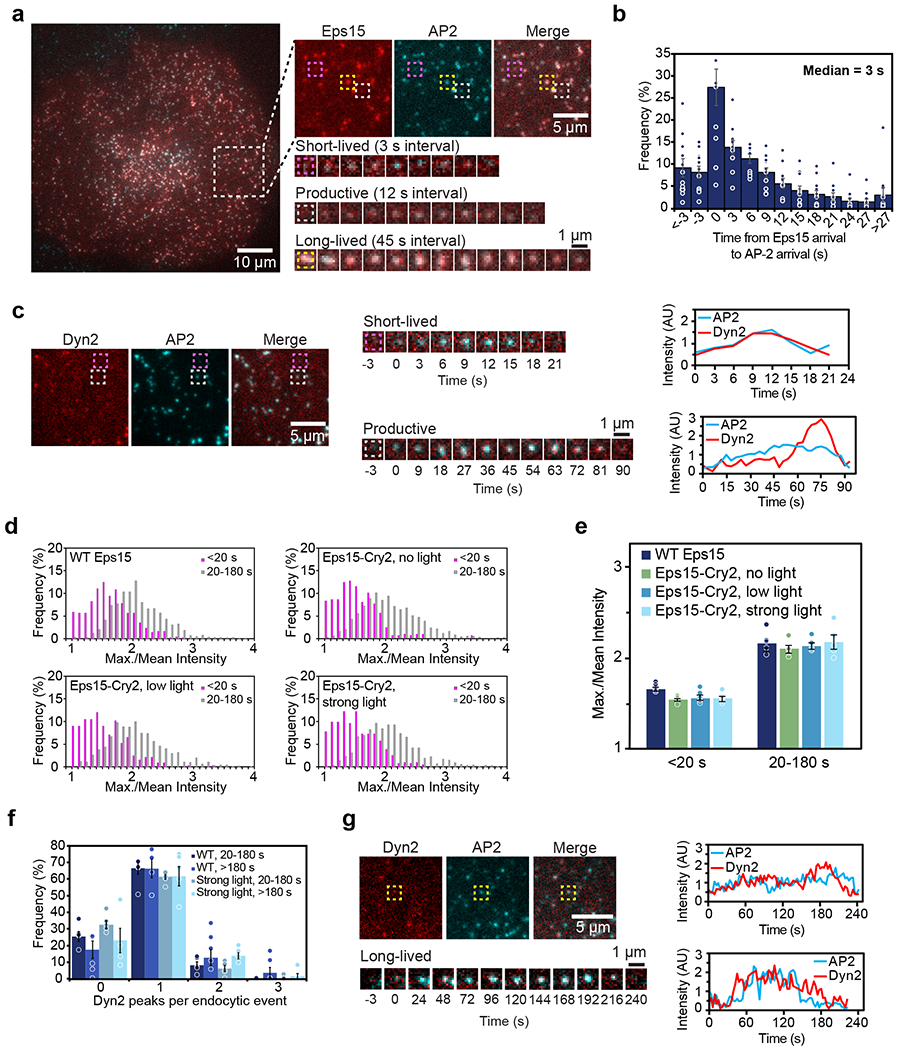
(a) Representative image of a cell expressing gene-edited AP-2 σ2-HaloTag:JF646 (cyan) and Eps15-mCherry (red). Large inset highlights three representative clathrin-coated structures shown in smaller insets: abortive (magenta), productive (gray), and stalled (yellow) structures lasting 18 s, 96 s, and > 10 min, respectively. (b) Histogram of the distribution of the difference in arrival times between Eps15-mCherry and AP-2 σ2-HaloTag:JF646 in endocytic structures in Eps15 knockout cells. Positive times indicate that Eps15 signal appeared before AP-2 signal. n=11 biologically independent cell samples. (c) Representative image of a cell expressing gene-edited AP-2 σ2-HaloTag:JF646 (cyan) and Dyn2-mCherry (red). Representative abortive (magenta) and productive (gray) clathrin-coated structures are indicated by the boxes and shown in smaller insets. Line plots show intensity measurements for the abortive (top) and productive (bottom) pit. (d) Histograms of the distribution of Dyn2 max./mean intensity. (WT Eps15: 1,394 pits; Eps15-Cry2, no light: 1,350 pits; Eps15-Cry2, low light: 1,310 pits; Eps15-Cry2, strong light: 1,507 pits.) (e) Median distribution of Dyn2 max./mean intensity for each lifetime cohort for each light condition. n= 5 biologically independent cell samples. (f) Histogram of the distribution of Dyn2 peaks per endocytic event among productive (20-180 s) events in cells expressing WT Eps15 compared to long-lived (>180 s) events in cells expressing Eps15-Cry2 and exposed to strong light. n= 5 biologically independent cell samples. (g) A typical long-lived clathrin-coated structure is indicated by the yellow box and shown in lower panels over time. Line plots show intensity measurements of AP-2 and Dyn2 for two representative clathrin-coated structures. Dyn2 signal was variable in long-lived structures and often displayed either a single peak at the end of an event (top plot) or no distinct peak (bottom plot). All data are presented as mean ± SEM. See Source Data Figure 5.
To further validate the distinction between short-lived (<20 s), productive (20-180 s), and long-lived (>180 s) structures, we examined dynamin signal intensity. Consistent with work by others32, we observed that structures lasting 20-180 s often had a characteristic Dyn2-mCherry peak toward the end of their lifetimes, while structures lasting <20 s rarely displayed this peak (Fig. 5c). Accordingly, the ratio between the maximum and mean Dyn2 intensity (max./mean) during the pit lifetime was higher in structures that exhibited this peak (Fig. 5d, e). This elevated ratio suggests that that this set of pits generally represents productive endocytic events. Additionally, we analyzed the number of Dyn2 peaks that appeared over the lifetime of long-lived structures to determine whether they represented endocytic hotspots undergoing repeated vesicle formation34. Endocytic events displaying more than one Dyn2 peak were rare, suggesting that most of the long-lived clathrin-coated structures were stalled endocytic sites (Fig. 5f, g).
We first compared cells with endogenous expression of Eps15 to Eps15 knockout cells (Eps15Δ) that were transfected to express Eps15-mCherry. The lifetime distribution of AP-2 σ2-labeled endocytic structures in these two cell populations was nearly identical (Extended Data Fig. 5c). Therefore, Eps15Δ cells expressing wild-type Eps15-mCherry were used in subsequent comparisons and will be referred to as WT Eps15 hereafter (Fig. 6a, dark blue bars). For all conditions, cells with similar intensity in the mCherry channel were analyzed to maintain comparable expression levels (Extended Data Fig. 5d). We then assessed the dynamics of clathrin-coated structures in Eps15Δ cells. Here we observed a significantly higher frequency of short-lived structures, 41 ± 3% versus 22 ± 3% (t-test, p=0.004, n=10, 10; Fig. 6a, b). Strikingly, cells expressing Eps15-Cry2 but exposed to no blue light showed a similar increase in short-lived structures, to 37 ± 4% (t-test, p=0.04, n=10, 11; Fig. 6a, b), in agreement with previous reports on the requirement for multiple domains of Eps15 for efficient CME14,16.
Figure 6: Liquid-like assemblies of initiator proteins optimize the productivity of CME.
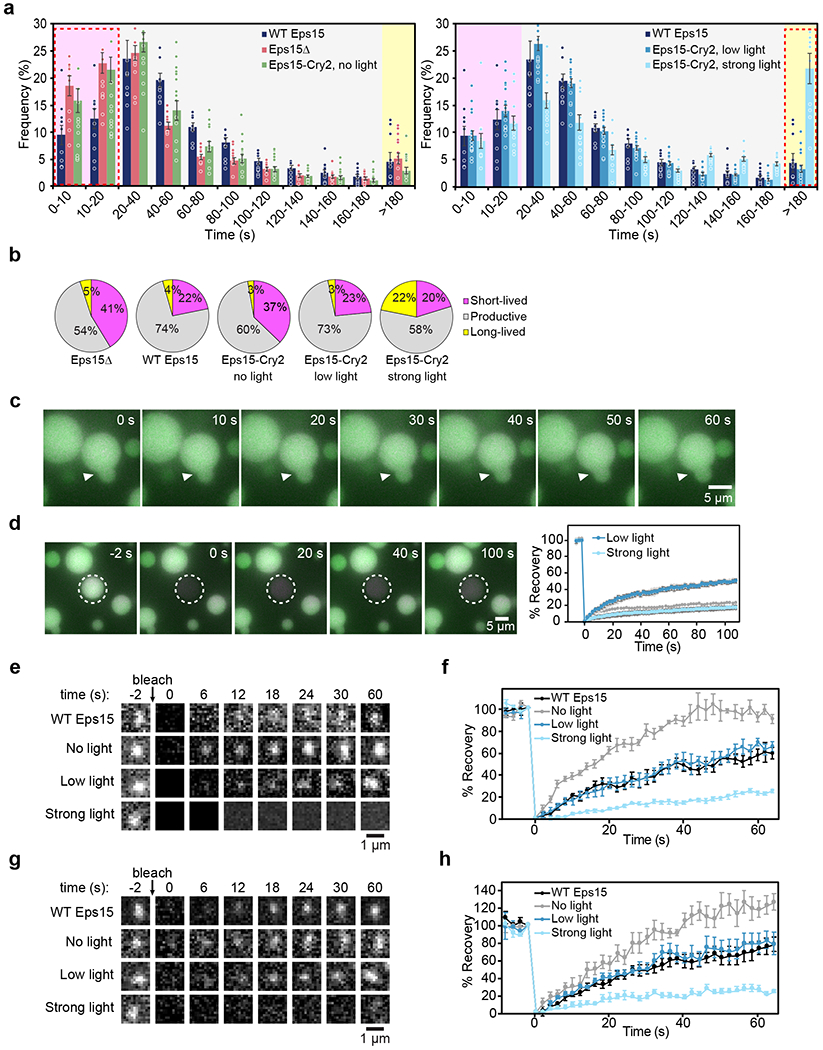
(a) Histogram of lifetime distributions of clathrin-coated structures, shaded to indicate lifetimes corresponding to abortive, productive, and stalled structures. For each condition, cells lack endogenous Eps15 and express either WT Eps15, no Eps15 (Eps15Δ), or Eps15-Cry2 at no, low, or strong blue light exposure. Eps15Δ n=10 biologically independent cell samples, 25,269 pits. WT Eps15 n=10 biologically independent cell samples, 8,969 pits. No light n=11 biologically independent cell samples, 21,996 pits. Low light n=17 biologically independent cell samples, 14,222 pits. Strong light n=12 biologically independent cell samples, 13,978 pits. (b) Lifetime distributions shown in (a) by type of structure. (c) Time course of droplets containing 0.12 μM Atto594-labeled Fcho1 (magenta), 3 μM CF488a-labeled Eps15 (green), and 1 μM Atto647N-labeled Eps15-Cry2 (blue) after 1 minute strong blue light exposure. (d) Recovery of CF488a-labeled Eps15 fluorescence after bleaching an Eps15-Cry2/Eps15 droplet after 1 minute strong blue light exposure. n= 3 biologically independent samples. Plot compares recovery to that of the droplet in Fig. 4i (Low light). All droplet experiments were conducted at room temperature, 22°C. (e) Representative images of fluorescence recovery of Eps15-mCherry (top row) or Eps15-Cry2-mCherry in clathrin-coated structures in cells under no, low, or strong blue light exposure. (f) Average fluorescence recovery of Eps15 or Eps15-Cry2 for each condition shown in e. n=6 biologically independent samples. Mobile fractions: 57 ± 5%, 95 ± 4%, 65 ± 4%, 24 ± 2%, respectively. Plot with data points is in Extended Data Fig. 5g. (g) Representative images of fluorescence recovery of AP-2-HaloTag:JF646 in clathrin-coated structures in cells expressing Eps15-mCherry (top row) or Eps15-Cry2-mCherry under no, low, or strong blue light exposure. (h) Average fluorescence recovery of AP-2-HaloTag:JF646 for each condition shown in g. n=6 biologically independent samples. Mobile fractions: 71 ± 10%, 121 ± 9%, 78 ± 8%, 24 ± 3%, respectively. Plot with data points is in Extended Data Fig. 5h. All data are presented as mean ± SEM. See Source Data Figure 6.
Next, we analyzed the same Eps15Δ cells expressing Eps15-Cry2, but now with exposure to low (10 μW) levels of blue light. Under these conditions, the frequency of short-lived structures was reduced to 23 ± 2%, similar to WT Eps15 cells, and the frequency of productive structures was nearly indistinguishable from wild-type levels (t-test, p > 0.5, n=10, 17; Fig. 6a, b). We also examined the effects of Eps15-Cry2 assembly in Eps15Δ cells in which the related Eps15R protein was knocked down (Extended Data Fig. 5a). In these cells, low blue light similarly reduced the frequency of short-lived structures relative to the no blue light condition (Extended Data Fig. 5e). These findings demonstrate that light-activated assembly of Eps15 restores the normal kinetics of CME under similar light exposure conditions to those that drove liquid-like assembly of the purified protein in vitro (Fig. 4f–i).
Solid assemblies of initiator proteins stall endocytosis
If a moderate level of blue light can reduce the frequency of short-lived structures to wild-type levels, we might expect that exposure to stronger blue light would further reduce the number of short-lived structures, making endocytosis more efficient. However, in cells expressing Eps15-Cry2 exposed to strong (50 μW) blue light, the frequency of short-lived structures decreased insignificantly to 20 ± 2%, as compared to 23 ± 2% (t-test, p=0.13, n=17, 12) for cells exposed to low light (Fig. 6b). Instead, the major change in these experiments was a substantial increase in the frequency of long-lived structures to 22 ± 3%, from 4 ± 2% in WT Eps15 cells (t-test, p<10−4, n=12, 10), and consequently a reduced frequency of productive structures (Fig. 6a, b). We confirmed that this level of blue light did not significantly alter CME dynamics in cells that did not express Cry2 (Extended Data Fig. 5f). Similar results were found in Eps15Δ/Eps15R knockdown cells (Extended Data Fig. 5e). However, the change was less pronounced, possibly because assembly of a dense, solid-like network was inhibited in the absence of Eps15R. Taken together, these results indicate that stronger assembly of the initiator protein network impairs productive maturation of endocytic structures.
To understand the mechanism behind the ability of strong light exposure to stall CME kinetics, we exposed Eps15-Cry2 droplets to strong blue light levels (50 μW) in vitro. Interestingly, strong blue light exposure resulted in gel-like droplets that rarely fused and failed to re-round over the course of several minutes following contact (Fig. 6c, Supplementary Video 5). Further, assembly under strong blue light reduced the dynamic exchange of proteins between the droplets and the surrounding solution, resulting in weaker recovery after photobleaching in comparison to droplets formed under low levels of blue light (10 μW ), with a mobile fraction of 23 ± 2% vs. 49 ± 1% (Fig. 6d, t1/2 = 49 s).
To determine how the strength of the initiator network impacts molecular exchange in live cells, we next analyzed clathrin-coated structures by FRAP (Fig. 6e, f). Recovery of wild-type Eps15-mCherry fluorescence occurred with a t1/2 of 39 s. In the absence of blue light, Eps15-Cry2 fluorescence recovered substantially more rapidly, with a t1/2 of 16 s, suggesting a reduced degree of assembly in comparison to the wild-type protein. Exposure to low levels of blue light (10 μW) returned Eps15-Cry2 fluorescence recovery to wild-type levels, consistent with an increase in assembly of the initiator protein network (t1/2=36 s). In contrast, exposure of Eps15-Cry2 to high levels of blue light (50 μW) largely blocked fluorescence recovery, with a t1/2 of 30 s, suggesting that endocytic proteins were no longer free to exchange within these structures.
Notably, fluorescence recovery of AP-2, a key cargo adaptor downstream of Eps15 and Fcho1,6, showed a similar dependence on blue light exposure in cells expressing Eps15-Cry2 (Fig. 6g, h). Specifically, AP-2 recovered to near wild-type levels (t1/2=28 s vs. 26 s) in cells exposed to low levels of blue light (10 μW). In contrast, the rate of recovery increased in the absence of blue light (t1/2=18 s) and substantially decreased upon exposure to stronger blue light (50 μW) with a t1/2 of 20 s. Therefore, the strength of the initiator network appears to control the freedom of AP-2 to exchange within growing endocytic structures. Too little assembly of the initiator proteins produces a structure whose components turn over too rapidly to drive productive endocytic events. In contrast, if the initiator network is too strong, downstream adaptors are unable to rearrange, stalling the growth of endocytic structures. Liquid-like interactions among initiator proteins appear to represent an optimum within this balance (Extended Data Fig. 6).
Discussion
Despite a detailed biochemical picture of the clathrin adaptor network, the physical mechanisms that drive productive endocytosis have long remained elusive35,36. The adaptor network is built from a highly interconnected web of molecular interactions, yet it must undergo extensive remodeling as the endocytic structure matures37,38. Here we demonstrate that liquid-like assembly of CME initiator proteins balances these competing constraints, optimizing the productivity of vesicle assembly. Specifically, we have shown that the clathrin adaptor proteins Eps15 and Fcho1/2 come together in multivalent, liquid-like assemblies. These results agree with the apparent requirement for both Fcho1/2 and Eps15 to drive efficient endocytosis3,6. Notably, concurrent work by Kozak and Kaksonen39 showed that the Saccharomyces cerevisiae homolog of Eps15, Ede1, can also form phase separated condensates in yeast cells.
Importantly, binding between Eps15 and Fcho1/2 is mediated by weak interactions involving short peptide motifs6 and intrinsically disordered regions. Similar weak, multivalent interactions are prevalent among CME adaptors40. It has been proposed that such interactions facilitate enhanced recruitment of downstream adaptors and promote stability of the adaptor network through avidity38,41,42. Here we have used light-activated control of initiator assembly in live cells to illustrate a delicate balance in which a liquid-like network drives efficient endocytosis, while a stronger, solid-like network stalls the process.
Liquid-like assembly of initiator proteins could result in multiple mechanisms of endocytic regulation. First, initiator assembly may promote “kinetic proofreading”, as described by Huang et al.41, ultimately pushing the site from infrequent, stochastic binding events toward productive endocytic assembly. Second, the initiator protein condensate may be able to regulate its own size, as downstream proteins outcompete the recruitment of additional initiator proteins, promoting maturation of the clathrin-coated structure, rather than unhindered growth of the condensate.
The initiator protein network has been considered a catalyst of endocytosis because it brings together the key components of the vesicle but is ultimately left behind on the plasma membrane as the endocytic vesicle departs12,13. Building on this analogy, all catalysts have two essential functions: (i) to bring together reactants and (ii) to release products. In the context of endocytosis, the coated vesicle, a large supramolecular complex, can be thought of as the product of an assembly reaction, which is catalyzed by the initiator proteins. Interestingly, when the product of a reaction is large, diffusion-limited release from the catalyst often becomes the rate-limiting step43. Notably, we observed that productive release of the mature vesicle requires that the initiators are in a liquid-like phase. These results suggest that an essential purpose of the liquid-like assembly of Eps15 and Fcho1/2 may be to permit diffusion, resulting in efficient release of the mature coated vesicle. Many pathways of trafficking vesicle biogenesis, including the assembly of COPII vesicles at ER exit sites and clathrin-independent endocytosis, depend upon interwoven protein networks44–46. Therefore, liquid-like catalytic complexes, which are capable of balancing the competing demands of multivalent assembly and flexible remodeling, could help to explain the efficient initiation and release of vesicles in trafficking routes throughout the cell.
Methods
Reagents
Tris-HCl, IPTG, NaCl, β-mercaptoethanol, and Triton X-100 were purchased from Thermo Fisher Scientific. EDTA, EGTA, TCEP, PMSF, protease inhibitor tablets, poly-l-lysine (PLL), Atto 594 NHS-ester and CF488a NHS-ester were purchased from Sigma-Aldrich. Human rhinovirus-3C (HRV-3C) protease, neutravidin, and Texas Red–DHPE were purchased from Thermo Fisher Scientific. Amine reactive PEG (mPEG-Succinimidyl Valerate MW 5000) and PEG-biotin (Biotin-PEG SVA, MW 5000) were purchased from Laysan Bio, Inc. Dipalmitoyl-decaethylene glycol-biotin (DP-EG10-biotin) was provided by Darryl Sasaki. All other lipids were purchased from Avanti Polar Lipids.
Plasmids
The sequence encoding M. musculus Fcho1 was subcloned from Addgene plasmid #27690, a gift from Christien Merrifield2, into the pGEX-6P-1 expression vector (GE Healthcare) at EcoRI and NotI restriction sites. pET28a-6xHis-Eps15 (FL), encoding H. sapiens Eps15, was a gift from Tom Kirchhausen9. Eps15 variant plasmids were derived from pET28a-6xHis-Eps15 (FL). pET28a-6xHis-Eps15-ΔCC was generated by introducing SalI restriction sites to excise residues 315–480 of Eps15. pET28a-6xHis-Eps15-Δ3xEH was generated by PCR amplification to excise residues 15-314 using oligos 5’ PAGTTTACAAAAGAACATCATAGGATCAAGTCC 3’ and 5’ ACTTGATAACTGTGTCAGAGAGAGCTG 3’, followed by ligation. pET28a-6xHis-Eps15-ΔCTD was generated by introducing a NotI restriction site to excise residues 538-896 of Eps15. pET28a-6xHis-Eps15-DPF>APA was generated by site-directed mutagenesis using oligo 5’ GGATTTTTTCCAGTCTGCGCCTGCGGTTGGCAGTGCTCCTGCCAAGGATGCGCCTGCGGGAAAAATCGATCCA 3’ and its reverse complement. To generate both pET28a-6xHis-Eps15-ΔCC::Cry2.PHR and Eps15-ΔCC::Cry2.PHR-pmCherry, the Cry2 PHR domain was PCR amplified from pCRY2PHR-mCherryN1 (Addgene plasmid # 26866, a gift from Chandra Tucker47) using oligos 5’ TAGGATCAAGTCCTGTTGCAGCCACCATGAAGATGGACAAAAAGAC 3’ and 5’ ATCAGTTTCATTTGCATTGAGGCTGCTGCTCCGATCAT 3’. This fragment was inserted by Gibson assembly (New England Biolabs) into pET28a-6xHis-Eps15 or Eps15-pmCherryN1 (Addgene plasmid #27696, a gift from Christien Merrifield2), which were PCR amplified to exclude Eps15 residues 328-490 using oligos 5’ TCATGATCGGAGCAGCAGCCTCAATGCAAATGAAACTGATGGAAATGAAAGATTTGGAAAATCATAATAG 3’ and 5’ TTGTCCATCTTCATGGTGGCTGCAACAGGACTTGATCCTATGAT 3’.
Protein Purification
Full-length Eps15, Eps15-ΔCC::Cry2, Eps15-Δ3xEH, Eps15-ΔCC, Eps15ΔCTD, and Eps15-DPF>APA were expressed as N-terminal 6xHistidine-tagged constructs in BL21 (DE3) E. coli cells; Fcho1 and Fcho2 were expressed as N-terminal GST-fusion constructs in BL21 Star (DE3) pLysS E. coli cells. Cells were grown in 2xYT medium for 3-4 hr at 30°C to 0.6-0.9 OD600, then cooled for 1 hr before protein expression was induced with 1 mM IPTG at either 12°C for 20-30 hr (Eps15 variants and Fcho1) or 30°C for 6 hr (Fcho2). Cells were harvested, and bacteria were lysed in lysis buffer using homogenization and probe sonication. Eps15-ΔCC::Cry2 was expressed in the dark, protected from direct light, and handled under darkroom red lights during all purification steps.
For Eps15 variants, lysis buffer was 50 mM Tris-HCl, pH 8.0, 300 mM NaCl, 5 mM imidazole, 10 mM β-mercaptoethanol or 5 mM TCEP, 1 mM PMSF, 0.2% Triton X-100, and 1x Roche or Pierce complete EDTA-free protease inhibitor cocktail tablet per 50 ml buffer. Proteins were incubated with Ni-NTA Agarose (Qiagen #30230) resin, followed by extensive washing with 10x column volumes, then eluted from the resin in 50 mM Tris-HCl, pH 8.0, 300 mM NaCl, 200 mM imidazole, 10 mM β-mercaptoethanol or 5 mM TCEP, 1 mM PMSF, and 1x Roche or Pierce complete EDTA-free protease inhibitor cocktail tablet. Full-length Eps15, Eps15-ΔCC::Cry2, Eps15-Δ3xEH, and Eps15-DPF>APA were further purified by gel filtration chromatography using a Superose 6 column equilibrated with 20 mM Tris-HCl, pH 8.0, 150 mM NaCl, 1 mM EDTA, and 5 mM DTT. Purified proteins were concentrated using Amicon Ultra-15 Ultracell-30K centrifugal filter units (MilliporeSigma), then centrifuged at 100k RPM at 4°C for 10 min using a Beckman TLA-120.2 rotor to remove aggregates, and stored either in small aliquots or as liquid nitrogen pellets at −80°C. The 6xHis tag on Eps15 was retained, except where noted. Then the 6xHis tag was cleaved with thrombin (Sigma-Aldrich) overnight at 4°C with rocking prior to gel filtration.
For Fcho1, lysis buffer was 100 mM sodium phosphate, pH 8.0, 5 mM EDTA, 5 mM TCEP, 10% glycerol, 1 mM PMSF, 1% Triton X-100, and 1x Roche or Pierce complete EDTA-free protease inhibitor cocktail tablet per 50 ml buffer. Fcho1 was incubated with glutathione sepharose 4B (GE Healthcare), followed by extensive washing with 10x column volumes, then 5x column volumes without Triton-X-100, then eluted with 15 mM reduced glutathione (Sigma-Aldrich, #G4251) in 100 mM sodium phosphate, pH 8.0, 5 mM EDTA, 5 mM TCEP, 10% glycerol, 1 mM PMSF, and 1x Roche complete EDTA free cocktail tablet per 50ml buffer. Eluted protein was desalted using Zeba Spin Desalting Columns (Thermo Fisher Scientific) into 20 mM Tris-HCl, pH 8.0, 450 mM NaCl, 50 mM KCl, 5 mM EDTA, 5 mM TCEP, and 10% glycerol. The GST tag was cleaved with GST-tagged HRV-3C protease (Thermo Fisher Scientific) overnight at 4°C with rocking. HRV-3C and GST tag were removed by passage through a second GST resin column. Fcho1 was concentrated and centrifuged to remove aggregates as described above and stored as liquid nitrogen pellets at −80°C.
For Fcho2, lysis buffer was 20 mM HEPES, pH 7.5, 200 mM NaCl, 10 mM KCl, 5 mM EDTA, 5 mM TCEP, 5% glycerol, 1 mM PMSF, 1% Triton X-100, and 1x Roche or Pierce complete EDTA-free protease inhibitor cocktail tablet per 50 ml buffer. Fcho2 was incubated with glutathione sepharose 4B (GE Healthcare), followed by extensive washing with 10x column volumes, then 5x column volumes without Triton-X-100, then eluted with 15 mM reduced glutathione (Sigma-Aldrich, #G4251) in 20 mM Tris, pH 8.0, 200 mM NaCl, 10 mM KCl, 5 mM EDTA, 5 mM TCEP, 5% glycerol, 1 mM PMSF, and 1x Roche complete EDTA free cocktail tablet per 50ml buffer. Eluted protein was desalted using Zeba Spin Desalting Columns (Thermo Fisher Scientific) into 20 mM Tris, pH 8.0, 200 mM NaCl, 10 mM KCl, 5 mM EDTA, 5 mM TCEP, and 5% glycerol. The GST tag was cleaved with GST-tagged HRV-3C protease (Thermo Fisher Scientific) overnight at 4°C with rocking. HRV-3C and GST tag were removed by passage through a second GST resin column. Fcho2 was further purified by gel filtration chromatography using a Superose 6 column equilibrated with 20 mM Tris-HCl, pH 8.0, 200 mM NaCl, 10 mM KCl, 1 mM EDTA, and 5 mM DTT, and 5% glycerol. Fcho2 was concentrated and centrifuged to remove aggregates as described above and stored as liquid nitrogen pellets at −80°C.
All proteins were buffer exchanged into 20 mM Tris-HCl, 150 mM NaCl, 5 mM TCEP 1 mM EDTA, 1 mM EGTA, pH 7.5 before use, except when used on membranes containing DOGS-NTA-Ni, in which case EDTA and EGTA were omitted.
Protein Labeling
Proteins were labeled using amine-reactive, NHS ester dyes (Atto-Tec) in phosphate-buffered saline containing 10 mM sodium bicarbonate, pH 8.3. The concentration of dye was adjusted experimentally to obtain a labeling ratio of 0.5–1 dye molecules per protein, typically using 2-fold molar excess of dye. Reactions were performed for 15 min on ice, then labeled protein was buffer-exchanged into 20 mM Tris-HCl, 150 mM NaCl, 5 mM TCEP, pH 7.5 and separated from unconjugated dye using Princeton CentriSpin-20 size exclusion spin columns (Princeton Separations). Labeled Fcho1 and Fcho2 were centrifuged at 100k RPM using a Thermo Scientific S120-AT3 rotor at 4°C for 10 min to remove aggregates before each use. For all experiments involving labeled protein, a mix of 90% unlabeled/10% labeled protein was used.
Protein Droplets
All droplets were formed in a buffer of 20 mM Tris-HCl, 150 mM NaCl, 5 mM TCEP 1 mM EDTA, 1 mM EGTA, 3% w/v PEG8000, pH 7.5. For droplet experiments with Fcho1, Fcho2, Eps15, Eps15-ΔCC, Eps15-Δ3xEH, Eps15-ΔCTD, and Eps15-DPF>APA, a total of 7 μM protein was used. Fcho1/2 and Eps15 variants were combined at 0.1 μM and 6.9 μM, respectively, to achieve an Fcho1/2 ratio of 1 in 70, or 0.2 μM and 6.8 μM, respectively, to achieve an Fcho1/2 ratio of 1 in 34. To induce droplet formation in an Eps15 solution by addition of Fcho1, 0.12 μM Fcho1 was added to 3 μM Eps15, yielding a ratio of 1 in 26. Droplets containing Eps15-Cry2 were formed by combining 1 μM Eps15-Cry2 and 3 μM Eps15, with or without 0.12 μM Fcho1, then applying 0.5 s of low (10 μW) blue light pulses for 1-3 minutes. For imaging droplets, supported lipid bilayers (SLBs) were used to passivate coverslips before adding droplets solution: small unilamellar vesicles (SUVs) were prepared by drying 100% POPC lipid films in clean glass tubes under vacuum for 2–3 hr. The lipid film was hydrated in 20 mM Tris-HCl, 150 mM NaCl buffer to make a 2 mM liposome solution, which was sonicated with a horn sonicator for 3x 4 min with 2 min cooling intervals while on ice. Wells were prepared by placing 0.8 mm thick silicone gaskets (Grace Bio-Labs) onto ultra-clean coverslips. A 2mM solution of SUVs was added to the coverslip and incubated at room temperature for 15 min to form the SLB. The SLB was washed 6-8x with 20 mM Tris-HCl, 150 mM NaCl, 5 mM TCEP buffer before adding the protein droplet solution.
GUV Preparation
For Eps15-only experiments, the GUV lipid mixture was 98 mol% DOPC, 2 mol% DOGS- NTA-Ni, and 1 mol% DP-EG10 biotin (for tethering to coverslips). For all other GUVs, the lipid mixture was or 79 mol% DOPC, 15 mol% DOPS, 1 mol% DP-EG10 biotin, and 5mol% PtdIns(4,5)P2. Labeled GUVs also incorporated 0.1 mol% Texas Red DHPE. Lipid mixtures were spread in a film on an indium tin oxide-coated glass slide and dried under vacuum overnight. Electroformation was performed at 55°C in 350 milliosmolar glucose solution. The osmolality of the GUV solution and experimental buffer was measured using a vapor pressure osmometer (Wescor). GUVs were tethered to glass coverslips by the following process: wells were made by placing 0.8 mm thick silicone gaskets (Grace Bio-Labs) onto ultra-clean coverslips. PEG (5 kDa) was conjugated to PLL via a reaction of an amine-reactive succinimidyl valeric acid (SVA) group on PEG and primary amines in PLL. 2% of the 5 kDa PEG had a covalently attached biotin group. Wells were incubated in a 2% biotinylated PLL-PEG solution for 20 min, then washed 8x. Wells were then incubated in a 0.2 mg/ml neutravidin solution for 10 min and washed 8x. GUVs were added to wells at an 8x dilution for 10 min, then washed gently 8x.
Multibilayers
Lipid multibilayers were prepared according to previously described methods48. A lipid mixture of 98 mol% DOPC, 15 mol% DOPS, and 2 mol% DOGS-NTA-Ni was dried to a lipid film under nitrogen gas stream, then dissolved in a 97% hexanes, 3% methanol solution to a concentration of 3.7 mg/ml. 40 μl of this lipid solution was then spin-coated onto a clean glass coverslip at 3000 RPM for 40 s. Spin-coated lipid films were dried under vacuum for 2 hr, then hydrated in silicone gasket wells in the experimental buffer of 20 mM Tris-HCl, 150 mM NaCl, 5 mM TCEP, pH 7.5 at 55°C for 15 minutes, then gradually cooled to room temperature. Wells were washed 6x with buffer before protein was added. 5x less protein was added to multibilayers, compared to GUVs. This difference compensates for the difference in total membrane surface area between the GUV and multibilayer samples, resulting in similar bound protein levels for both substrates.
Cell Culture
Human-derived SUM159 cells gene-edited to add HaloTag (Promega) to both alleles of AP-2 σ2 were a generous gift from Tom Kirchhausen29. Cells were grown in 1:1 DMEM high glucose:Ham’s F-12 (Hyclone, GE Healthcare) supplemented with 5% fetal bovine serum (Hyclone), Pen/Strep/L-glutamine (Hyclone), 1 μg/ml hydrocortisone (H4001; Sigma-Aldrich), 5 μg/ml insulin (I6634; Sigma-Aldrich), and 10 mM HEPES (Fisher), pH 7.4 and incubated at 37°C with 5% CO2. Cells were seeded onto acid-washed coverslips at a density of 3x10⁴ cells per coverslip for 24 h before transfection with 1-3 μg of plasmid DNA using 3 μL Fugene HD transfection reagent (Promega).
HaloTagged AP-2 σ2 was visualized by adding Janelia Fluor 646-HaloTag ligand, a gift from Luke Lavis30. 100 nM ligand was added to cells and incubated at 37°C for 15 minutes. Cells were washed with fresh media and imaged immediately.
Gene Editing
SUM159 AP-2 σ2-HaloTag cells were further gene-edited to knock out both alleles of endogenous Eps15 using clustered regularly interspaced short palindromic repeats (CRISPR)/Cas9. Guide RNA sequences were generated by annealing forward oligo 5’ PCACCGTTGATACAGGCAATACTGGA 3’ and reverse oligo 5’ PAAACTCCAGTATTGCCTGTATCAAC 3’. The underlined guide sequence targeted bp 77-96 in Eps15. The oligo pair was ligated into pSpCas9(BB)-2A-GFP (Addgene plasmid #48138), a gift from Feng Zhang49, at the BbsI site and the resulting plasmid was confirmed by DNA sequencing. SUM159 AP-2 σ2-HaloTag cells were transfected with 2.5 μg of this plasmid containing the guide RNA, Cas9, and an EGFP reporter using Fugene HD transfection reagent. After 24 hr, cells were trypsinized and washed into phosphate-buffered saline (PBS) supplemented with 5% FBS. Cells expressing GFP were sorted using fluorescence-activated cell sorting (FACS) into a 96-well plate at a density of 1 cell per well using a Sony MA900 Multi-Application Cell Sorter. Following clonal expansion, genomic DNA was isolated, then a region surrounding the target sequence was amplified by PCR using oligos 5’ GAAGAGGCACATAACATGTGCAACTATTCCC 3’ and 5’ GGGAATCTTGCCACACACTCAAAGACTTG and sequenced to identify insertions or deletions.
siRNA Transfection
Eps15R knockdown was performed using MISSION esiRNA against human Eps15L1 (EHU036601, Sigma-Aldrich). SUM159 AP-2 σ2-HaloTag/Eps15Δ cells were transfected in 6-well plates with 138 pmol esiRNA using Fugene HD transfection reagent. After 24 hr, cells were analyzed by microscopy or by Western blot as described below.
SDS-PAGE and Immunoblotting
Eps15 knock-out and Eps15R knockdown were confirmed by Western blots: SUM159 AP-2 σ2-HaloTag control cells, Eps15 knock-out cells, and Eps15Δ/Eps15R KD cells were trypsinized, washed in PBS, and resuspended in ice-cold lysis buffer (20 mM Tris, 150 mM NaCl, 1 mM EDTA, 1 mM EGTA, 1% Triton X-100, 1x Pierce protease inhibitor cocktail tablet, pH 7.5). Total protein concentration was quantified by Bradford assay and equal amounts were loaded on a 4-20% SDS-PAGE gel, then transferred to nitrocellulose membrane at 100 V for 75 min. Membranes were blocked in Tris-buffered saline with 0.1% Tween 20 and 5% nonfat dried milk for 1 hr. Primary antibodies used were Anti-Eps15 (D3K8R) Rabbit mAb (12460, Cell Signaling Technology), Anti-EPS15R Rabbit mAb (ab53006, Abcam), and Anti-GAPDH mouse mAb (AM4300, Invitrogen). Primary antibodies were applied at 1:1,500 in TBS-Tween/5% milk at 4°C overnight. Membranes were washed 5x in TBS-Tween, then incubated with secondary antibodies, Anti-rabbit IgG HRP-linked Antibody (7074, Cell Signaling Technology) and Anti-mouse IgG, HRP-linked Antibody (7076, Cell Signaling Technology), at 1:5,000 each in TBS-Tween/1% milk at room temperature for 1 hr. Membranes were washed 5x in TBS-Tween, then imaged using a SuperSignal West Pico kit (Thermo) on a Syngene G:Box Chemi XX6. Band intensity was quantified using the gel analyzer function of ImageJ and intensity values were normalized to GAPDH values for each lane.
Fluorescence Microscopy
Images of GUVs, multibilayers, and protein droplets were collected on an Axio Observer Z1 (Zeiss) with Yokagawa CSU-X1M spinning disc confocal microscope equipped with a 1.4 NA/100x Plan-Apo oil objective and a cooled EMCCD iXon3 897 camera (Andor Technology), and with Zeiss Zen 2012 Blue Edition software, version 1.1.2.0. For phase diagram experiments, temperature was monitored by a thermistor placed in the protein solution in a sealed chamber to prevent evaporation. Samples were heated from room temperature at a rate of ~1°C/minute through an aluminum plate affixed to the top of the chamber. After reaching the critical temperature, heating was turned off and samples were allowed to cool to room temperature.
Live cell images, blue light assays, and droplet FRAP time sequences were collected on a TIRF microscope consisting of an Olympus IX73 microscope body, a Photometrics Evolve Delta EMCCD camera, and Olympus 1.4 NA/100x Plan-Apo oil objective, using MicroManager version 1.4.23. For cell imaging, the objective was heated to produce a sample temperature of 37°C using an objective heater wrap. The TIRF microscope was equipped with 473 nm, 532 nm, and 640 nm lasers with a 635 nm laser for autofocusing. A 532nm laser was used for FRAP assays. For droplet imaging the objective was used in widefield mode. All live cell imaging was conducted in TIRF mode at the plasma membrane 16 hr after transfection.
For blue light assays, samples were exposed to 0, 10, or 50 μW 473 nm light as measured out of the objective when in widefield mode. Blue light was applied for 500 ms every 2 s for droplet samples and every 3 s for cell samples. Analysis of movies began after one minute of imaging to allow for blue light to take effect. In particular, cell movies were collected over 11 minutes at 3 s intervals, and the last 10 minutes were analyzed.
Image Analysis
Fluorescence images of in vitro membranes and droplets were range-adjusted to the minimum and maximum pixel values in each channel in ImageJ (http://rsbweb.nih.gov/ij/). Cell images were range-adjusted to have 0-0.4% saturated pixels to allow visualization of the plasma membrane background. For time course image sets, contrast was kept the same for all images. Maximum intensity projections were used for all z-projections. Intensity values along line scans were measured in unprocessed images using ImageJ. For GUV measurements, intensity was measured along the GUV membrane using the polar transformer plugin. Background intensity values were subtracted for each channel, then intensity values were normalized to the maximum intensity measurement in each channel.
For FRAP experiments, images were analyzed using the FRAP profiler plugin (http://worms.zoology.wisc.edu/research/4d/4d.html#frap) for ImageJ. The intensity range was normalized to maximum and minimum intensity values, corresponding to pre- and post-bleaching frames. The bleached area encompassed the entire condensate or clathrin-coated structure. Droplets of similar size were selected for FRAP analysis, and intensity was measured in an ROI centered within the droplet with approximately 50% the area of the droplet. Only clathrin-coated structures that fell within a 2.5 μm radius of the center of the 5 μm bleach window were chosen for analysis. Intensity was measured in a 5x5 pixel ROI centered on the clathrin-coated structure in each frame.
For phase diagrams, fluorescence intensity was measured in the center square of a 3x3 grid for each image where illumination was even. Complementary masks were generated for droplets and solution using the auto threshold function in ImageJ. Two images were analyzed at each temperature for each condition. Background intensity values were subtracted and intensity was normalized to the mean intensity value of the solution.
Clathrin-coated structures were detected and tracked using cmeAnalysis in MATLAB50. The point spread function of the data was used to determine the standard deviation of the Gaussian function. AP-2 σ2 signal was used as the master channel to track clathrin-coated structures. Detected structures were analyzed if they persisted in at least 3 consecutives frames.
The difference between Eps15 and AP-2 arrival times in clathrin-coated structures was measured in SUM159 AP-2 σ2-HaloTag/Eps15Δ cells expressing WT Eps15-mCherry. Arrival was defined as the frame in which each marker’s signal intensity first reached 50% of of the mean signal intensity of that marker in each structure.
Dyn2 signal was measured in structures that were detected and tracked using cmeAnalysis50. For each structure, we identified the maximum and mean signal intensities over the lifetime of the structure and calculated the max./mean ratio. Structures were then binned by lifetime, and intensities were averaged for each lifetime bin in each cell. To count Dyn2 peaks per endocytic site, local maxima in the Dyn2 signal intensity for individual tracked clathrin-coated structures were identified using MATLAB. The criteria for determining true Dyn2 peaks were: (i) a threshold Dyn2 intensity value that was at least 1.75x greater than the mean Dyn2 intensity, (ii) peaks lasted more than 3 frames (9 s), and (iii) peaks were spaced least 5 frames (15 s) apart.
Statistics and Reproducibility
For all experiments yielding micrographs, each experiment was repeated independently on different days at least 3 times, with similar results. Phase diagram experiments were repeated independently twice with similar results. Collection of cell image data for CME analysis was performed independently on at least two different days for each cell type or experiemental condition. Statistical analysis was carried out using Welch’s t-tests (unpaired, unequal variance) to probe for statistical significance (p < 0.05).
Extended Data
Extended Data Figure 1: Fcho2 assembles into protein-rich domains with Eps15 on membranes and in solution.
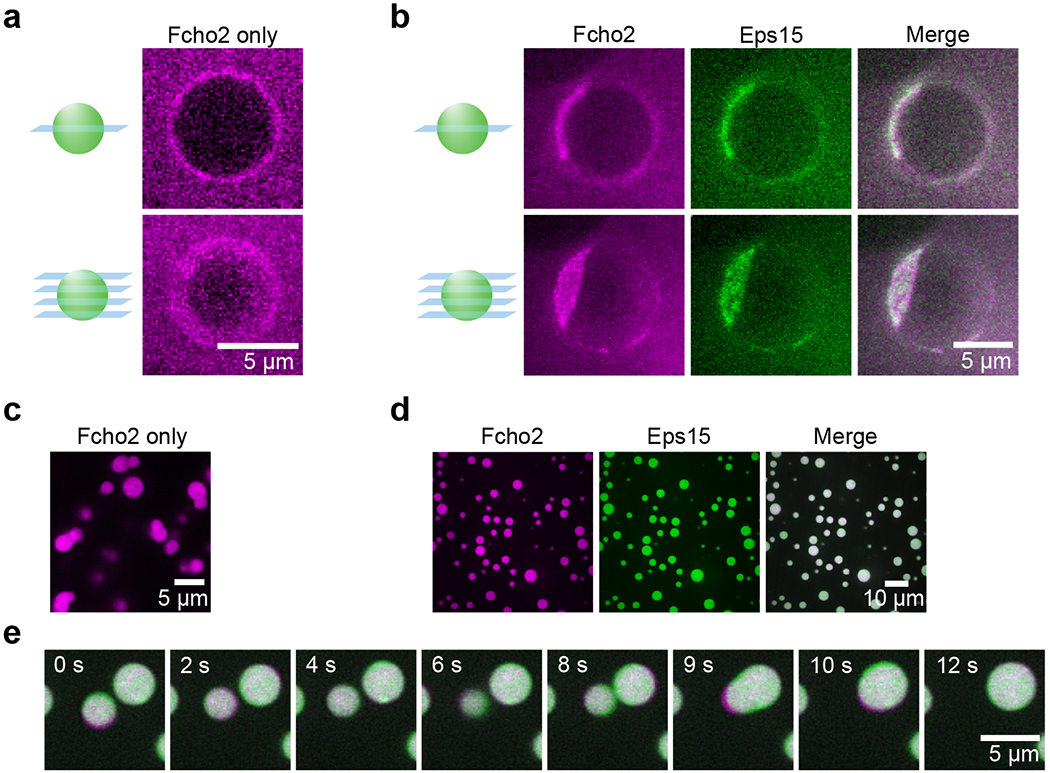
(a-e) Fcho2 is labeled with Atto-594. Eps15 contains an N-terminal 6xHis tag and is labeled with CF488a. (a-b) Center slices (upper panels) and corresponding z-projections (lower panels) of representative GUVs incubated with 500 nM of the indicated protein(s). GUVs contain 79% DOPC, 15% DOPS, 5% PtdIns(4,5)P2, and 1% DPEG10-biotin. (a) Full-length Fcho2 alone decorates GUVs homogeneously. (b) GUVs incubated with both Fcho2 and Eps15 display protein-rich domains. (c) 7 μM Fcho2 clusters into small, irregular aggregates. (d) When combined at a 1:34 ratio, Fcho2 and Eps15 colocalize in protein droplets. (e) Time course of a fusion event between droplets containing Fcho2 (magenta) and Eps15 (green). Scale bars are 5 μm in a-c, e and 10 μm in d.
Extended Data Figure 2: Eps15 and Fcho1 co-localize in protein-rich domains on membrane surfaces.
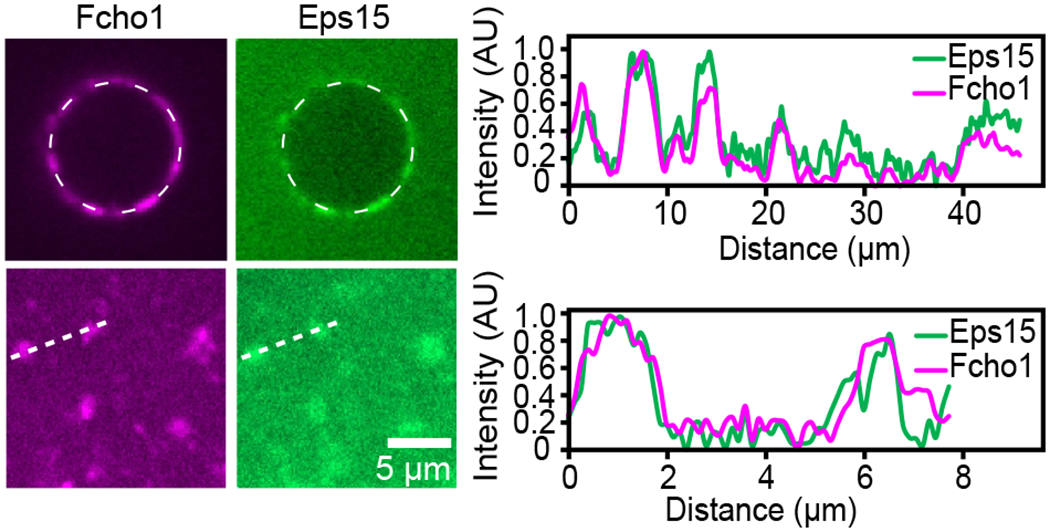
Normalized intensity of Fcho1 and Eps15 signal along the dashed lines in GUV and multibilayer images from Figures 1d and 2f. See Source Data Extended Data Figure 2.
Extended Data Figure 3: Eps15/Fcho1 droplet:solution partitioning decreases at increasing temperature.
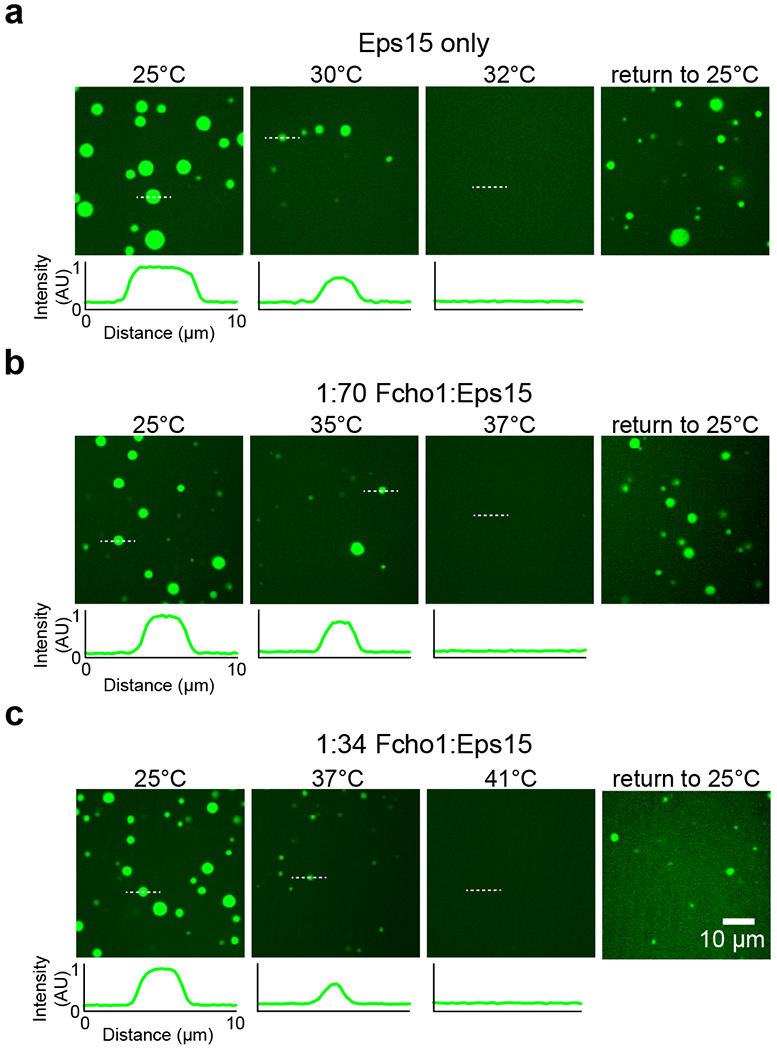
(a-c) Representative images of protein droplets at increasing temperatures, followed by the return to room temperature after heat removal. Plots show fluorescence intensity of Eps15-CF488a measured along dotted lines in each image. Intensity is normalized to the maximum value in the first 25°C panel for each set of images. Fcho1 is unlabeled. Total protein concentration is held at 7 μM while Fcho1:Eps15 ratio is varied. Droplets are formed from (a) 7 μM Eps15, (b) 0.1 μM Fcho1, 6.9 μM Eps15, and (c) 0.2 μM Fcho1, 6.8 μM Eps15. See Source Data Extended Data Figure 3.
Extended Data Figure 4: Eps15 mutants and Fcho1 assemble to varying degrees in solution.
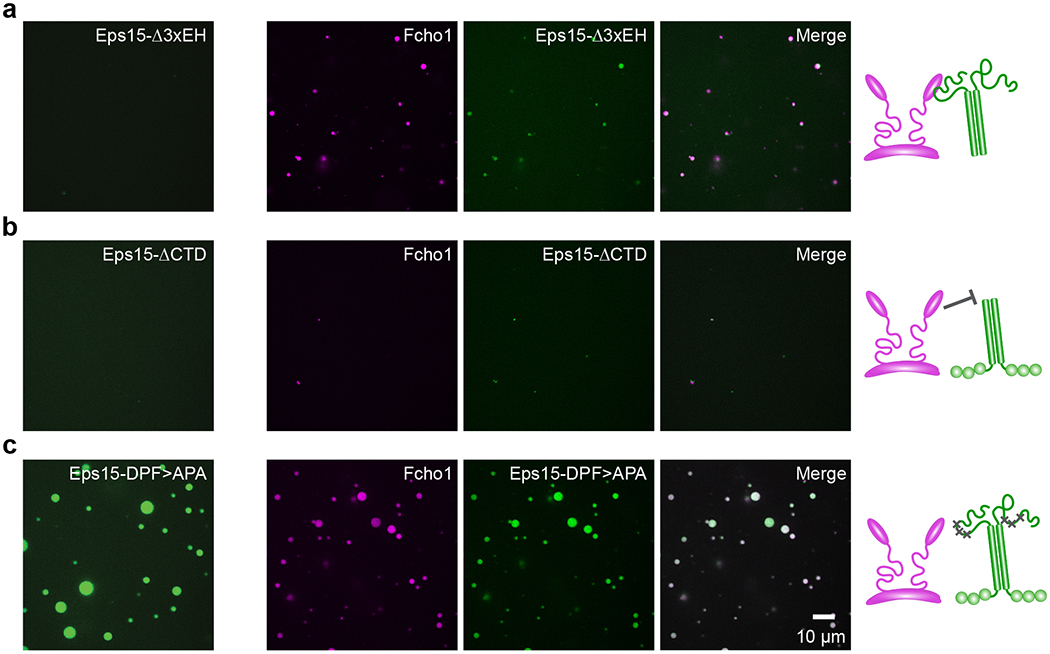
(a-c) Fcho1 is labeled with Atto-594, Eps15 mutants are labeled with CF488a. Panels on the left show 7 μM Eps15 mutant alone, set of panels on the right show 6.8 μM Eps15 mutant combined with 0.2 μM Fcho1 (34:1). Cartoons depict binding interaction between Fcho1 and Eps15 mutants. (a) Eps15 lacking the EH domains (Eps15-Δ3xEH) does not form droplets on its own, but when combined with Fcho1 forms small droplets. (b) Eps15 lacking the C-terminal disordered domain (Eps15-ΔCTD) does not form droplets on its own and addition of Fcho1 does not induce droplet formation, reinforcing that the CTD of Eps15 mediates its interaction with Fcho1. (c) Eps15 containing mutated Fcho1-binding DPF motifs (amino acids 623-636; Eps15-DPF>APA) robustly assembles into droplets on its own and co-assembles into droplets with Fcho1, presumably because the disordered domains of Eps15 and Fcho1 interact even in the absence of 3 key DPF motifs. Scale bar is 10 μm.
Extended Data Figure 5: Controls for Eps15-Cry2 cell experiments.
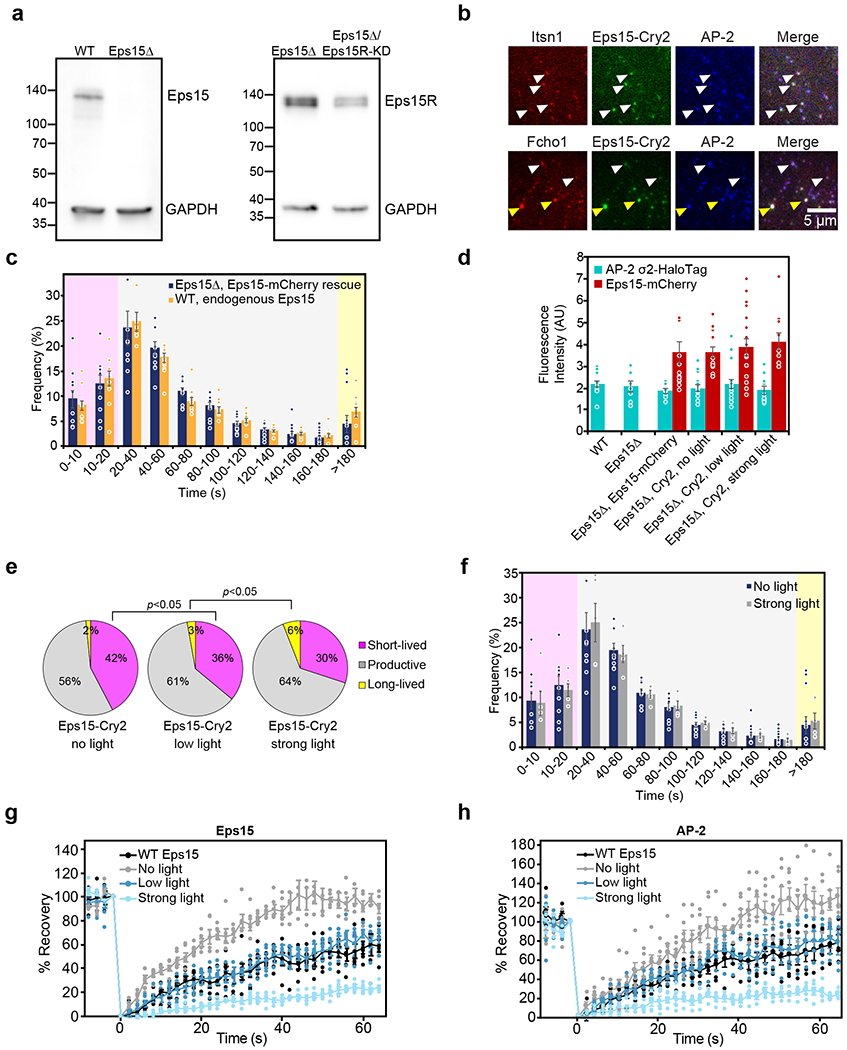
(a) Left: whole cell lysates from WT SUM159/AP-2-HaloTag cells and WT SUM159/AP-2-HaloTag cells gene edited by CRISPR to disrupt Eps15 were separated by SDS-PAGE and immunoblotted for Eps15 and GAPDH. Right: whole cell lysates from WT SUM159/AP-2-HaloTag cells and WT SUM159/AP-2-HaloTag cells transfected with siRNA against Eps15R were collected 24 hours post-transfection. Proteins were separated by SDS-PAGE and immunoblotted for Eps15R and GAPDH. (b) Itsn1-mCherry (upper panels), Fcho1-mCherry (lower panels), Eps15-Cry2-GFP, and AP2-HaloTag conjugated to JF646 colocalize in Eps15Δ cells expressing Eps15-Cry2 and exposed to low blue light levels. White arrowheads indicate examples of colocalization in endocytic structures. Notably, Fcho1-mCherry/Eps15-Cry2-GFP co-expression often resulted in the formation of large, persistent aggregates on the plasma membrane, denoted by yellow arrowheads. Scale bar is 5 μm. (c) The lifetime distributions of AP-2 σ2-HaloTag-labeled endocytic structures in Eps15 knockout cells expressing Eps15-mCherry and in wild-type Eps15 cells are nearly identical. (d) The average plasma membrane fluorescence intensity of AP-2 σ2-HaloTag::JF646 and Eps15-mCherry in the first frame of each movie analyzed in a and Figure 4. Eps15Δ n=10 biologically independent cell samples, 25,269 pits. WT Eps15 n=10 biologically independent cell samples, 8,969 pits. No light n=11 biologically independent cell samples, 21,996 pits. Low light n=17 biologically independent cell samples, 14,222 pits. Strong light n=12 biologically independent cell samples, 13,978 pits. (e) Lifetime distributions of clathrin-coated structures in Eps15Δ/Eps15R knockdown cells expressing Eps15-Cry2 at no, low, or strong blue light exposure. Plots show frequency of short-lived (<20 s, magenta), productive (20-180 s, gray), and long-lived (>180 s, yellow) structures for each condition. No blue light exposure resulted in 42 ± 3% (SEM) of CCPs being short-lived (<20 s). Low blue light exposure significantly reduced the frequency of short-lived CCPs from 42 ± 3% to 36 ± 4% (t-test, p=0.042, n=5, 5). While 2-3% of pits were long-lived (>180 s) in cells exposed to no or low blue light, the frequency of long-lived pits increased significantly to 6 ± 1% (t-test, p=0.009, n=5, 5) in cells exposed to strong blue light. No light n=5 biologically independent cell samples, 31,427 pits. Low light n=5 biologically independent cell samples, 27,026 pits. Strong light n=5 biologically independent cell samples, 17,623 pits. (f) The lifetime distributions of AP-2 σ2-HaloTag-labeled endocytic structures in Eps15 knockout cells expressing Eps15-mCherry exposed to either no blue light or 50 μW “strong” blue light are nearly identical. (g) Plot from Fig. 6f and (h) plot from Fig. 6h displaying the individual data points that were averaged together for each FRAP curve. n=5-6 biologically independent samples. Data are presented as mean ± SEM. See Source Data Extended Data Figure 5.
Extended Data Figure 6. The assembly state of initiator proteins impacts CME dynamics.
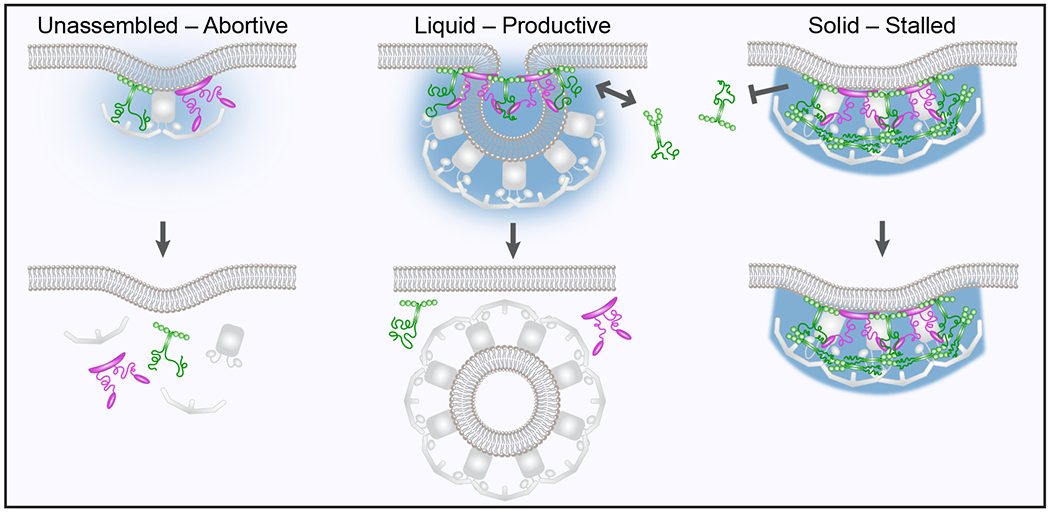
When Eps15 (green) and Fcho1 (magenta) exist in an unassembled, or dilute phase on the membrane surface, abortive structures are favored. In productive structures, Eps15 and Fcho1 assemble into a liquid protein phase capable of exchange with molecules in solution. Further assembly of Eps15 and Fcho1 into a gel or solid phase limits molecular exchange and promotes stalled endocytic structures.
Supplementary Material
Acknowledgements
We thank T. Kirchhausen for the gift of SUM159/AP-2σ2-HaloTag cells and L. Lavis for the gift of JF646 HaloTag ligand. This research was supported by the National Institutes of Health through grants R35GM139531 and R01GM112065 to J.C.S. and E.M.L., grant R01GM118933 to E.M.L, and F32GM133138 to K.J.D.; and by a National Science Foundation Graduate Research Fellowship (DGE-1610403) to G.K. The University of Texas Health Science Center at San Antonio (UTHSCSA) Center for Macromolecular Interactions is supported by the Cancer Therapy and Research Center through the National Cancer Institute P30 Grant CA054174, and Texas State funds provided through the UTHSCSA Office of the Vice President for Research.
Footnotes
Competing Interests
The authors declare no competing interests.
Data Availability Statement
All data supporting this work are available on request to the corresponding author. Source Data are provided with this paper.
Code Availability Statement
Data analysis was conducted using an ImageJ FRAP profiler plugin (http://worms.zoology.wisc.edu/ImageJ/FRAP_Profiler_v2.java) and CMEanalysis software (https://www.utsouthwestern.edu/labs/danuser/software/). No custom code was generated for this study.
References
- 1.Henne WM et al. FCHo Proteins Are Nucleators of Clathrin-Mediated Endocytosis. Science 328, 1281–1284 (2010). [DOI] [PMC free article] [PubMed] [Google Scholar]
- 2.Taylor MJ, Perrais D & Merrifield CJ A High Precision Survey of the Molecular Dynamics of Mammalian Clathrin-Mediated Endocytosis. PLoS Biology 9, e1000604 (2011). [DOI] [PMC free article] [PubMed] [Google Scholar]
- 3.Wang L, Johnson A, Hanna M & Audhya A Eps15 membrane-binding and-bending activity acts redundantly with Fcho1 during clathrin-mediated endocytosis. Molecular biology of the cell 27, 2675–2687 (2016). [DOI] [PMC free article] [PubMed] [Google Scholar]
- 4.Sengar AS, Wang W, Bishay J, Cohen S & Egan SE The EH and SH3 domain Ese proteins regulate endocytosis by linking to dynamin and Eps15. The EMBO Journal 18, 1159–1171 (1999). [DOI] [PMC free article] [PubMed] [Google Scholar]
- 5.Mayers JR et al. Regulation of ubiquitin-dependent cargo sorting by multiple endocytic adaptors at the plasma membrane. Proceedings of the National Academy of Sciences 110, 11857–11862 (2013). [DOI] [PMC free article] [PubMed] [Google Scholar]
- 6.Ma L et al. Transient Fcho1/2⋅Eps15/R⋅AP-2 Nanoclusters Prime the AP-2 Clathrin Adaptor for Cargo Binding. Developmental Cell 37, 428–443 (2016). [DOI] [PMC free article] [PubMed] [Google Scholar]
- 7.Morgan JR, Prasad K, Jin S, Augustine GJ & Lafer EM Eps15 Homology Domain-NPF Motif Interactions Regulate Clathrin Coat Assembly during Synaptic Vesicle Recycling. Journal of Biological Chemistry 278, 33583–33592 (2003). [DOI] [PubMed] [Google Scholar]
- 8.Chen H et al. Epsin is an EH-domain-binding protein implicated in clathrin-mediated endocytosis. Nature 394, 793–797 (1998). [DOI] [PubMed] [Google Scholar]
- 9.Cupers P, Haar E. ter, Boll W & Kirchhausen T Parallel Dimers and Anti-parallel Tetramers Formed by Epidermal Growth Factor Receptor Pathway Substrate Clone 15 (EPS15). J. Biol. Chem 272, 33430–33434 (1997). [DOI] [PubMed] [Google Scholar]
- 10.Henne WM et al. Structure and analysis of FCHo2 F-BAR domain: a dimerizing and membrane recruitment module that effects membrane curvature. Structure 15, 839–852 (2007). [DOI] [PubMed] [Google Scholar]
- 11.Lu R & Drubin DG Selection and stabilization of endocytic sites by Ede1, a yeast functional homologue of human Eps15. Mol. Biol. Cell 28, 567–575 (2017). [DOI] [PMC free article] [PubMed] [Google Scholar]
- 12.Tebar F, Sorkina T, Sorkin A, Ericsson M & Kirchhausen T Eps15 Is a Component of Clathrin-coated Pits and Vesicles and Is Located at the Rim of Coated Pits. J. Biol. Chem 271, 28727–28730 (1996). [DOI] [PubMed] [Google Scholar]
- 13.Sochacki KA, Dickey AM, Strub M-P & Taraska JW Endocytic proteins are partitioned at the edge of the clathrin lattice in mammalian cells. Nature Cell Biology 19, 352–361 (2017). [DOI] [PMC free article] [PubMed] [Google Scholar]
- 14.Carbone R et al. eps15 and eps15R are essential components of the endocytic pathway. Cancer Res. 57, 5498–5504 (1997). [PubMed] [Google Scholar]
- 15.Benmerah A, Bayrou M, Cerf-Bensussan N & Dautry-Varsat A Inhibition of clathrin-coated pit assembly by an Eps15 mutant. J. Cell. Sci 112 ( Pt 9), 1303–1311 (1999). [DOI] [PubMed] [Google Scholar]
- 16.Benmerah A, Poupon V, Cerf-Bensussan N & Dautry-Varsat A Mapping of Eps15 domains involved in its targeting to clathrin-coated pits. J. Biol. Chem 275, 3288–3295 (2000). [DOI] [PubMed] [Google Scholar]
- 17.Santonico E, Panni S, Falconi M, Castagnoli L & Cesareni G Binding to DPF-motif by the POB1 EH domain is responsible for POB1-Eps15 interaction. BMC Biochem. 8, 29 (2007). [DOI] [PMC free article] [PubMed] [Google Scholar]
- 18.Simonsen AC & Bagatolli LA Structure of spin-coated lipid films and domain formation in supported membranes formed by hydration. Langmuir 20, 9720–9728 (2004). [DOI] [PubMed] [Google Scholar]
- 19.Wei M-T et al. Phase behaviour of disordered proteins underlying low density and high permeability of liquid organelles. Nature Chemistry 9, 1118–1125 (2017). [DOI] [PMC free article] [PubMed] [Google Scholar]
- 20.Elbaum-Garfinkle S et al. The disordered P granule protein LAF-1 drives phase separation into droplets with tunable viscosity and dynamics. Proc. Natl. Acad. Sci. U.S.A 112, 7189–7194 (2015). [DOI] [PMC free article] [PubMed] [Google Scholar]
- 21.Banjade S & Rosen MK Phase transitions of multivalent proteins can promote clustering of membrane receptors. eLife Sciences 3, e04123 (2014). [DOI] [PMC free article] [PubMed] [Google Scholar]
- 22.Li P et al. Phase transitions in the assembly of multivalent signalling proteins. Nature 483, 336–340 (2012). [DOI] [PMC free article] [PubMed] [Google Scholar]
- 23.Shin Y & Brangwynne CP Liquid phase condensation in cell physiology and disease. Science 357, eaaf4382 (2017). [DOI] [PubMed] [Google Scholar]
- 24.Milovanovic D, Wu Y, Bian X & Camilli PD A liquid phase of synapsin and lipid vesicles. Science 361, 604–607 (2018). [DOI] [PMC free article] [PubMed] [Google Scholar]
- 25.Alberti S, Gladfelter A & Mittag T Considerations and Challenges in Studying Liquid-Liquid Phase Separation and Biomolecular Condensates. Cell 176, 419–434 (2019). [DOI] [PMC free article] [PubMed] [Google Scholar]
- 26.Hein MY et al. A human interactome in three quantitative dimensions organized by stoichiometries and abundances. Cell 163, 712–723 (2015). [DOI] [PubMed] [Google Scholar]
- 27.Bugaj LJ, Choksi AT, Mesuda CK, Kane RS & Schaffer DV Optogenetic protein clustering and signaling activation in mammalian cells. Nature Methods 10, 249–252 (2013). [DOI] [PubMed] [Google Scholar]
- 28.Shin Y et al. Spatiotemporal Control of Intracellular Phase Transitions Using Light-Activated optoDroplets. Cell 168, 159–171.e14 (2017). [DOI] [PMC free article] [PubMed] [Google Scholar]
- 29.Aguet F et al. Membrane dynamics of dividing cells imaged by lattice light-sheet microscopy. Mol Biol Cell 27, 3418–3435 (2016). [DOI] [PMC free article] [PubMed] [Google Scholar]
- 30.Grimm JB et al. A general method to improve fluorophores for live-cell and single-molecule microscopy. Nat Meth 12, 244–250 (2015). [DOI] [PMC free article] [PubMed] [Google Scholar]
- 31.Loerke D et al. Cargo and Dynamin Regulate Clathrin-Coated Pit Maturation. PLOS Biology 7, e1000057 (2009). [DOI] [PMC free article] [PubMed] [Google Scholar]
- 32.Ehrlich M et al. Endocytosis by Random Initiation and Stabilization of Clathrin-Coated Pits. Cell 118, 591–605 (2004). [DOI] [PubMed] [Google Scholar]
- 33.Boulant S, Kural C, Zeeh J-C, Ubelmann F & Kirchhausen T Actin dynamics counteract membrane tension during clathrin-mediated endocytosis. Nat. Cell Biol 13, 1124–1131 (2011). [DOI] [PMC free article] [PubMed] [Google Scholar]
- 34.Dambournet D et al. Genome-edited human stem cells expressing fluorescently labeled endocytic markers allow quantitative analysis of clathrin-mediated endocytosis during differentiation. J. Cell Biol (2018) doi: 10.1083/jcb.201710084. [DOI] [PMC free article] [PubMed] [Google Scholar]
- 35.Kaksonen M & Roux A Mechanisms of clathrin-mediated endocytosis. Nature Reviews Molecular Cell Biology (2018) doi: 10.1038/nrm.2017.132. [DOI] [PubMed] [Google Scholar]
- 36.Mettlen M, Chen P-H, Srinivasan S, Danuser G & Schmid SL Regulation of Clathrin-Mediated Endocytosis. Annu. Rev. Biochem 87, 871–896 (2018). [DOI] [PMC free article] [PubMed] [Google Scholar]
- 37.Avinoam O, Schorb M, Beese CJ, Briggs JAG & Kaksonen M Endocytic sites mature by continuous bending and remodeling of the clathrin coat. Science 348, 1369–1372 (2015). [DOI] [PubMed] [Google Scholar]
- 38.Zhuo Y et al. Dynamic interactions between clathrin and locally structured elements in a disordered protein mediate clathrin lattice assembly. J. Mol. Biol 404, 274–290 (2010). [DOI] [PMC free article] [PubMed] [Google Scholar]
- 39.Kozak M & Kaksonen M Phase separation of Ede1 promotes the initiation of endocytic events. bioRxiv (2019). [Google Scholar]
- 40.Smith SM, Baker M, Halebian M & Smith CJ Weak Molecular Interactions in Clathrin-Mediated Endocytosis. Front. Mol. Biosci 4, (2017). [DOI] [PMC free article] [PubMed] [Google Scholar]
- 41.Huang WYC et al. Phosphotyrosine-mediated LAT assembly on membranes drives kinetic bifurcation in recruitment dynamics of the Ras activator SOS. Proceedings of the National Academy of Sciences 113, 8218–8223 (2016). [DOI] [PMC free article] [PubMed] [Google Scholar]
- 42.Chen Y et al. Dynamic instability of clathrin assembly provides proofreading control for endocytosis. J. Cell Biol 218, 3200–3211 (2019). [DOI] [PMC free article] [PubMed] [Google Scholar]
- 43.Gellman AJ Oligomer desorption during heterogeneous catalytic synthesis of polymers. Catalysis Today 105, 144–151 (2005). [Google Scholar]
- 44.Bickford LC, Mossessova E & Goldberg J A structural view of the COPII vesicle coat. Curr. Opin. Struct. Biol 14, 147–153 (2004). [DOI] [PubMed] [Google Scholar]
- 45.Sato K & Nakano A Mechanisms of COPII vesicle formation and protein sorting. FEBS Lett. 581, 2076–2082 (2007). [DOI] [PubMed] [Google Scholar]
- 46.Sandvig K, Kavaliauskiene S & Skotland T Clathrin-independent endocytosis: an increasing degree of complexity. Histochem. Cell Biol 150, 107–118 (2018). [DOI] [PMC free article] [PubMed] [Google Scholar]
Methods References
- 47.Kennedy MJ et al. Rapid blue-light-mediated induction of protein interactions in living cells. Nat. Methods 7, 973–975 (2010). [DOI] [PMC free article] [PubMed] [Google Scholar]
- 48.Zeno WF, Rystov A, Sasaki DY, Risbud SH & Longo ML Crowding-Induced Mixing Behavior of Lipid Bilayers: Examination of Mixing Energy, Phase, Packing Geometry, and Reversibility. Langmuir 32, 4688–4697 (2016). [DOI] [PMC free article] [PubMed] [Google Scholar]
- 49.Ran FA et al. Genome engineering using the CRISPR-Cas9 system. Nat Protoc 8, 2281–2308 (2013). [DOI] [PMC free article] [PubMed] [Google Scholar]
- 50.Aguet F, Antonescu CN, Mettlen M, Schmid SL & Danuser G Advances in Analysis of Low Signal-to-Noise Images Link Dynamin and AP2 to the Functions of an Endocytic Checkpoint. Developmental Cell 26, 279–291 (2013). [DOI] [PMC free article] [PubMed] [Google Scholar]
Associated Data
This section collects any data citations, data availability statements, or supplementary materials included in this article.


