

Summary
Insulin resistance is a major pathophysiologic defect in Type 2 Diabetes and obesity, while anti-inflammatory M2-like macrophages are important in maintaining normal metabolic homeostasis. Here, we show that M2 polarized bone marrow-derived macrophages (BMDMs) secrete miRNA-containing exosomes (Exos), which improve glucose tolerance and insulin sensitivity when given to obese mice. Depletion of their miRNA cargo blocks the ability of M2 BMDM Exos to enhance insulin sensitivity. We found that miR-690 is highly expressed in M2 BMDM Exos and functions as an insulin sensitizer both in vivo and in vitro. Expressing a miR-690 mimic in miRNA-depleted BMDMs generates Exos that recapitulate the effects of M2 BMDM Exos on metabolic phenotypes. Nadk is a bona fide target mRNA of miR-690, and Nadk plays a role in modulating macrophage inflammation and insulin signaling. Taken together, these data suggest miR-690 could be a new therapeutic insulin-sensitizing agent for metabolic disease.
eTOC
Miscommunication between adipose tissue macrophages (ATMs) and insulin target tissues is key to the development of insulin resistance, while it is known that lean ATM-derived exosomes promote insulin sensitivity. Here, Ying et. al show that miR-690 within ATM-derived exosomes directly increases insulin sensitivity both in vitro and in vivo.
Graphical Abstract

Introduction
Insulin resistance is an antecedent defect in the great majority of patients with Type 2 Diabetes (T2D) (Kahn et al., 2006; Lee et al., 2018; Roden and Shulman, 2019; Romeo et al., 2012). Obesity is the main driver of insulin resistance in humans worldwide and the ongoing obesity epidemic is causing a parallel rise in the prevalence of T2D (Johnson and Olefsky, 2013; Ogden et al., 2016). It has become clear that obesity-induced chronic, subacute tissue inflammation, particularly when it occurs in adipose tissue and liver, can cause insulin resistance (Hotamisligil, 2017; Saltiel and Olefsky, 2017). As a hallmark of tissue inflammation, obesity results in the accumulation of proinflammatory macrophages in these tissues, and are the major source of inflammatory mediators such as tumor necrosis factor, galectin 3, and other cytokines (Hotamisligil et al., 1995; Hotamisligil et al., 1996; Li et al., 2016; Lumeng et al., 2007a; Lumeng et al., 2007b; Weisberg et al., 2003). Consistent with this formulation, many studies have demonstrated the importance of macrophage-mediated inflammation as a cause of insulin resistance (Lee et al., 2018).
In the healthy lean state, macrophages residing in key metabolic tissues such as adipose tissue, liver, and skeletal muscle preferentially display the alternatively activated, anti-inflammatory M2-like phenotype (Fink et al., 2014; Lumeng et al., 2007a; Morinaga et al., 2015). Eosinophils, regulatory T cells, and adipocytes are sources of interleukin 4 (IL4) and IL13, which polarize macrophages toward the M2-like state (Kang et al., 2008; Qiu et al., 2014; Tiemessen et al., 2007; Wu et al., 2011). The ability of M2-like macrophages to regulate tissue remodeling and inflammation resolution underpins their critical role in maintaining systemic insulin sensitivity and glucose homeostasis. For example, previous studies have shown that reducing the number of tissue resident M2-like macrophages in mice, by depletion of eosinophils or knockout of PPARγ, exacerbates obesity-induced glucose intolerance and insulin resistance (Odegaard et al., 2007; Wu et al., 2011). Obesity significantly changes tissue microenvironmental factors, such as increased chemokine secretion and elevated free fatty acid levels, all of which can switch macrophage activation to the more proinflammatory M1-like state (Kanda et al., 2006; Kratz et al., 2014; Li et al., 2015; Xu et al., 2013). Thus, it is challenging to enhance the proportion of M2-like macrophages in the context of obesity. One mechanism by which M2-like macrophages exert beneficial effects involves IL10 secretion; however, previous studies have shown that IL10 ablation in mice does not exacerbate obesity-induced glucose intolerance and insulin resistance (den Boer et al., 2006; Rajbhandari et al., 2018; Saraiva and O’Garra, 2010).
In addition to cytokines, emerging evidence has demonstrated that exosomes (Exos) play critical roles in modulating metabolic homeostasis (Crewe et al., 2018; Guay et al., 2019; Whitham et al., 2018; Ying et al., 2017). Our previous studies demonstrated insulin sensitizing effects of miRNA-containing Exos obtained from lean adipose tissue macrophages (ATMs), the majority of which are anti-inflammatory M2-like cells (Ying et al., 2017). Thus, we hypothesized that IL4-IL13-induced alternatively activated, anti-inflammatory M2-like macrophages secrete Exos containing miRNAs that can improve insulin sensitivity.
Here, we show that M2 polarized bone marrow-derived macrophages (BMDMs) produce Exos which lead to improved glucose tolerance and insulin sensitivity, both in vivo and in vitro. Ablation of miRNAs blunts the ability of these Exos to exert their effects, indicating that miRNAs are the key functional cargo components within these Exos. Among the miRNAs highly enriched within M2-like macrophage Exos, miR-690 is an insulin sensitizing miRNA, as evidenced by a significant improvement in cellular insulin signaling after in vitro or in vivo treatment with miR-690. DicerKO depletes all endogenous miRNAs, and treatment with DicerKO macrophage Exos packed with miR-690 leads to a robust enhancement in glucose tolerance, insulin sensitivity, and macrophage proinflammatory pathways. Finally, we find that Nadk is a bona fide target mRNA of miR-690 and Nadk can exert substantial effects on insulin sensitivity.
Results
Anti-inflammatory macrophage-derived extracellular vesicles can attenuate obesity-induced insulin resistance.
We previously showed that Exos harvested from M2-like ATMs in lean mouse eWAT can cause improved insulin sensitivity when administrated to obese mice in vivo (Ying et al., 2017). However, because of the relative scarcity of ATMs in lean mice, more in-depth mechanistic studies are challenging, as it takes 20–25 lean donor mice to harvest enough Exos to treat one recipient mouse. To overcome this, we treated mouse BMDMs with IL4/IL13 to direct them towards an anti-inflammatory M2-like phenotype in vitro. Using our previously reported Exos isolation method (Ying et al., 2017), we found that M2 Exos are small particles with a diameter of 50–200 nanometer, as measured by electron microscopy and NanoSight analysis (Figures S1A and S1B). Additionally, the expression of the exosome-specific markers syntenin1, TSG101, and CD63 were readily detectable in these M2 BMDM Exos pellets (Figure S1C). We examined whether Exos derived from these IL4-IL13-treated M2-like BMDMs (herewith referred to as M2 Exos) can be taken up into peripheral insulin target tissues after intravenous administration to WT mice after 10 weeks on a high-fat diet (HFD). After intravenous injection of PKH26-labeled M2 Exos (1×10⁹ Exos/mouse), robust red fluorescent PKH26 uptake was present in the liver, skeletal muscle, and adipose tissue from these obese WT recipients, demonstrating that M2 Exos were readily taken up into these tissues (Figure S1D).
We next assessed the effects of these anti-inflammatory M2 Exos on obesity-associated glucose intolerance and insulin resistance after 4 weeks of intravenous injection of M2 Exos into obese WT mice (1×10⁹ Exos/mouse, twice per week; starting at 8 weeks of HFD). While all recipient mice displayed comparable body weight and glucose-stimulated insulin secretion after 4 weeks treatment (Figures S2A and S2B), M2 Exos administration led to a marked improvement in glucose and insulin tolerance (Figures 1A and 1B and S2C). Additionally, compared to HFD-fed controls injected with empty liposomes, insulin-stimulated AKT phosphorylation was substantially higher in liver, skeletal muscle and adipose tissue of the obese recipient mice (Figures 1C–1E).
Figure 1. M2 Exos can improve obesity-induced glucose intolerance and insulin resistance.
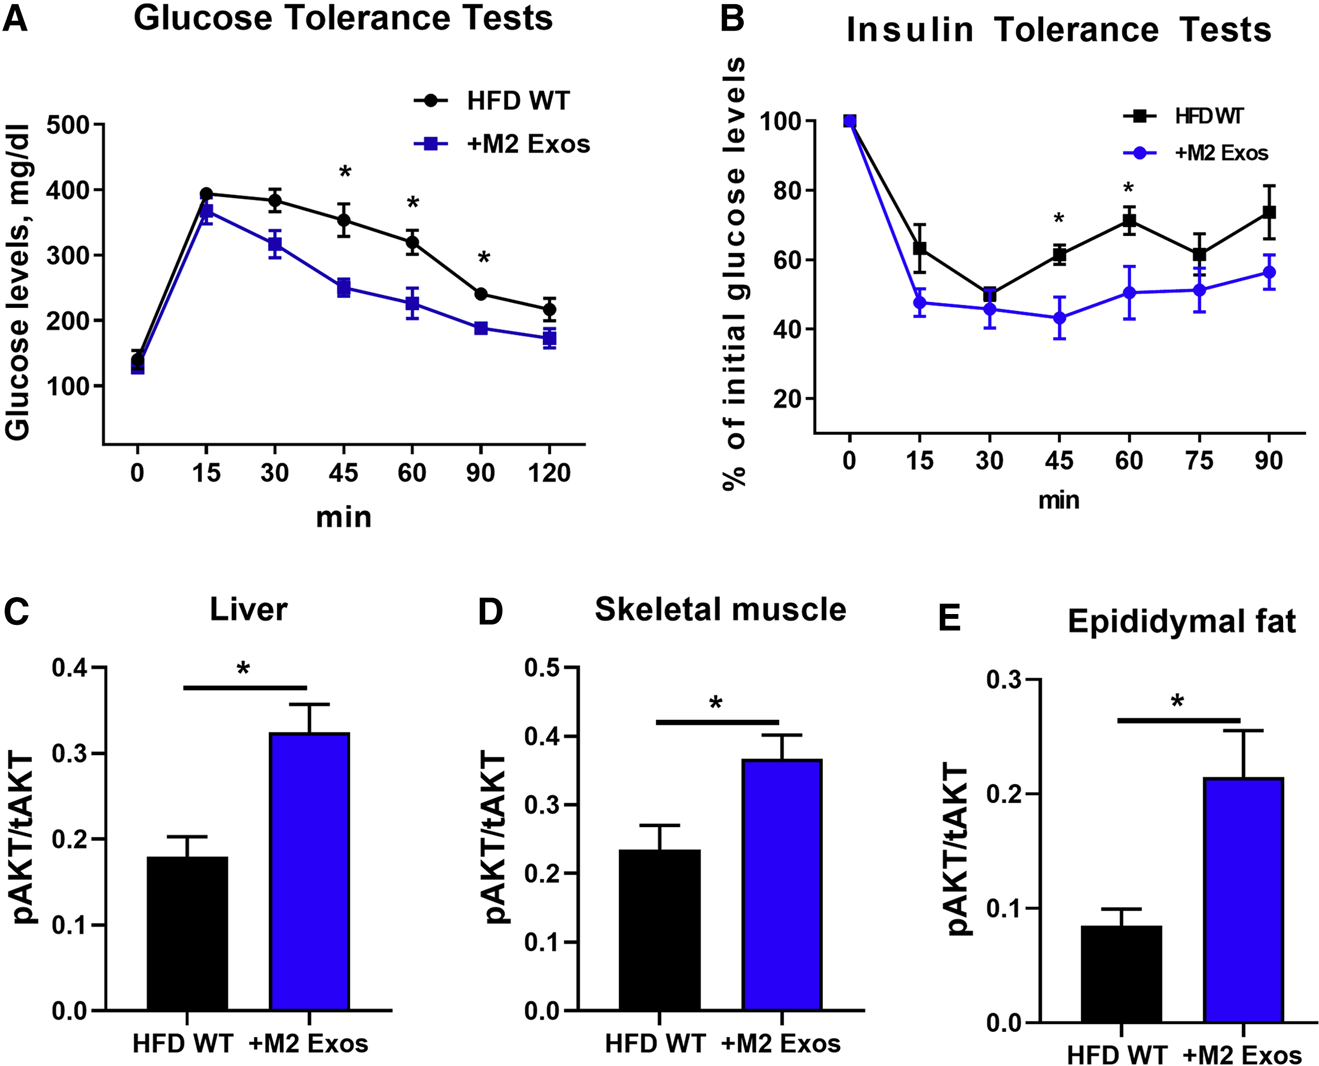
(A and B) Glucose and insulin tolerance tests of HFD-fed obese recipient mice after 4 weeks treatment with M2 Exos starting at 8wks of a HFD. Obese mice treated with empty liposomes were used as controls.
The levels of insulin-stimulated AKT phosphorylation in liver (C), skeletal muscle (D), and epididymal fat (E) of obese recipient mice treated with M2 Exos were measured by phospho-AKT (Ser473)/total AKT ELISA kits.
Data are presented as mean ± SEM. n = 6 per group (A-E). *P < 0.05, Student’s t-test. See also Figure S1 and S2.
Given the marked impact of M2 Exos on in vivo glucose tolerance and insulin sensitivity, we evaluated the effect of M2 Exos on insulin action in adipocytes, myocytes and hepatocytes (1×10⁸ Exos/0.5×106 cells). We found that in vitro treatment with M2 Exos led to greater insulin-stimulated glucose uptake in both 3T3 adipocytes and L6 myocytes, compared to control cells treated with empty liposomes (Figures 2A and 2B). In addition, M2 Exos treatment led to enhanced insulin-mediated suppression of glucagon-stimulated glucose output in primary hepatocytes isolated from 12wks HFD WT mice, whereas the control obese hepatocytes exhibited insulin resistance (Figure 2C). M2 Exos treatment also led to greater AKT phosphorylation in adipocytes, myocytes and hepatocytes, consistent with the insulin sensitizing actions of these Exos (Figures 2D–2F). Taken together, these results indicate that anti-inflammatory BMDM-derived M2-like Exos mitigate obesity-induced insulin resistance.
Figure 2. M2 Exos enhance cellular insulin responses.
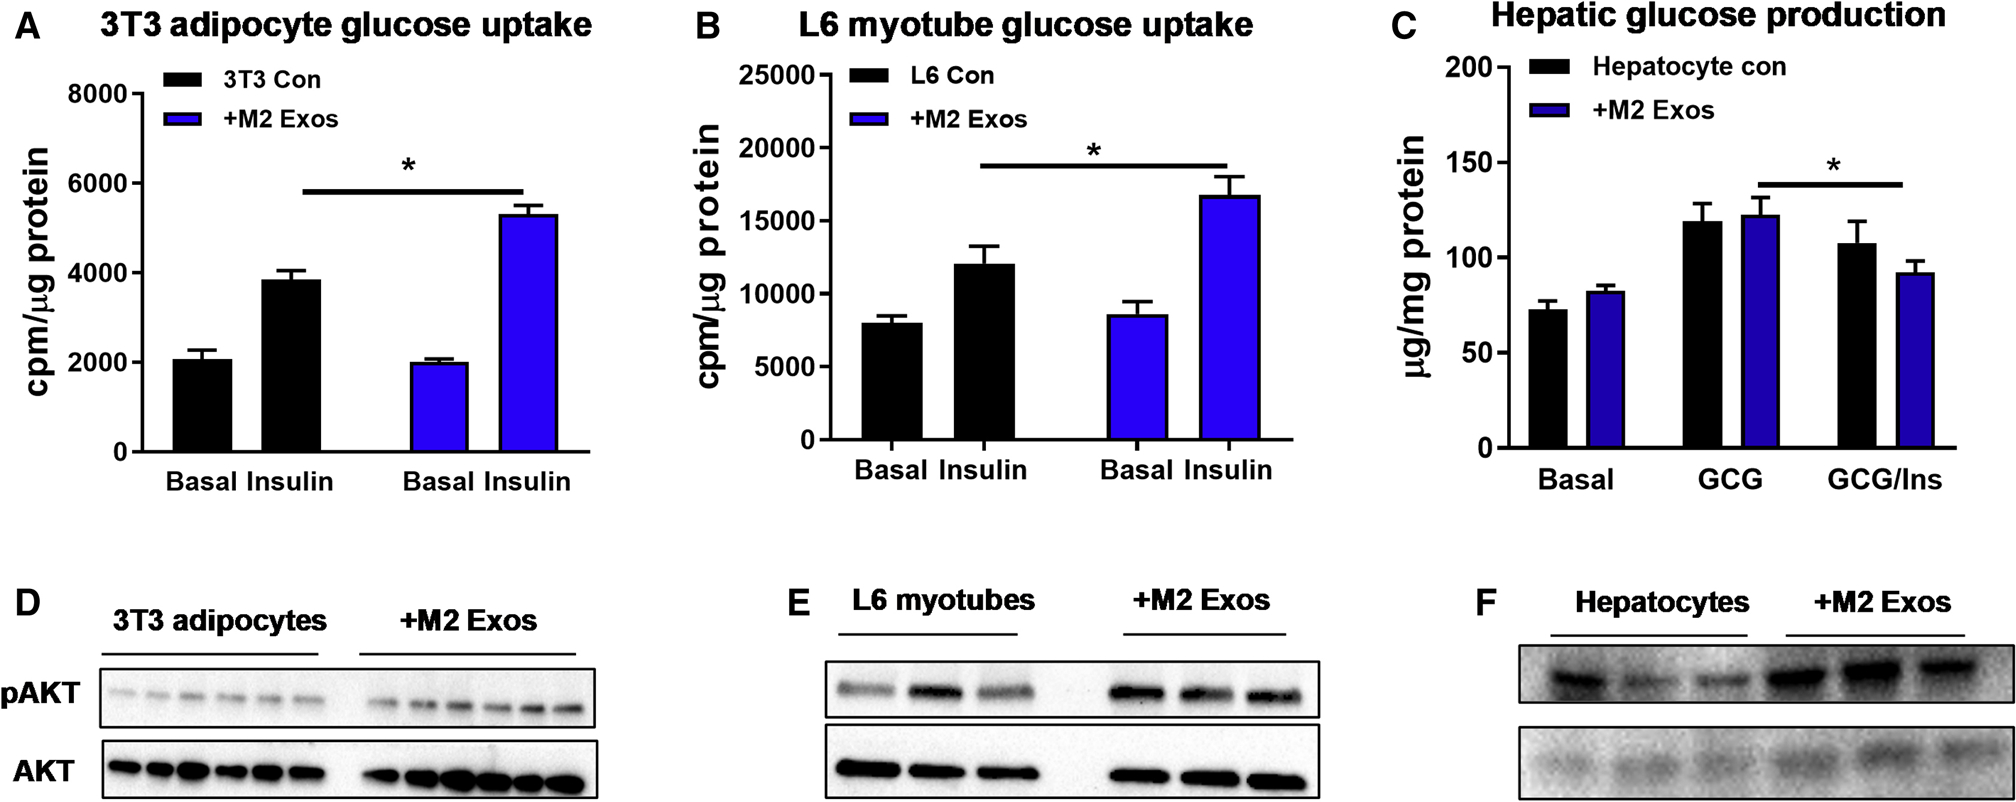
Effects of M2 Exos on glucose uptake of 3T3-L1 adipocytes (A) and L6 myotubes (B) and hepatic glucose output in primary mouse hepatocytes (C). Cells treated with empty liposomes were used as controls.
The abundance of insulin-stimulated AKT phosphorylation of 3T3-L1 adipocytes (D), L6 myotubes (E), and hepatocytes (F) after M2 Exos treatment.
Data are presented as mean ± SEM. n = 6 per group (A-C). *P < 0.05, Student’s t-test.
miRNAs are responsible for the M2 Exos effects.
Exos contain a variety of cargoes, including miRNAs, other RNA species, lipids, and proteins (Mathieu et al., 2019). To examine the importance of miRNAs within M2 BMDM Exos with respect to the phenotypes observed, we generated a mouse model with myeloid cell-specific knockout of Dicer, a key ribonuclease responsible of producing mature miRNAs (Figure S3A). The M2 BMDMs derived from these DicerKO mice produced miRNA-free Exos, as evidenced by non-detectable expression of myeloid cell-specific miR-223 in DicerKO M2 Exos (Figure S3B). Treatment of 3T3-L1 adipocytes and L6 myocytes with Exos derived from control or DicerKO M2 BMDMs showed that M2 Exos, but not miRNA-depleted Exos, enhanced insulin-stimulated glucose uptake of recipient cells (Figures 3A and 3B). We also assessed the in vivo effects of miRNA-free M2 Exos in HFD WT recipient mice. After 4 weeks treatment (starting at 10wks of HFD), the HFD-fed obese mice injected with M2 Exos exhibited enhanced insulin sensitivity and glucose tolerance, whereas miRNA-free M2 Exos treatment had negligible effects on these metabolic responses (Figures 3C and 3D). These data suggest that miRNAs are the key components contributing to the ability of BMDM Exos to enhance insulin sensitivity.
Figure 3. The miRNA cargo is necessary for the M2 Exos effects.
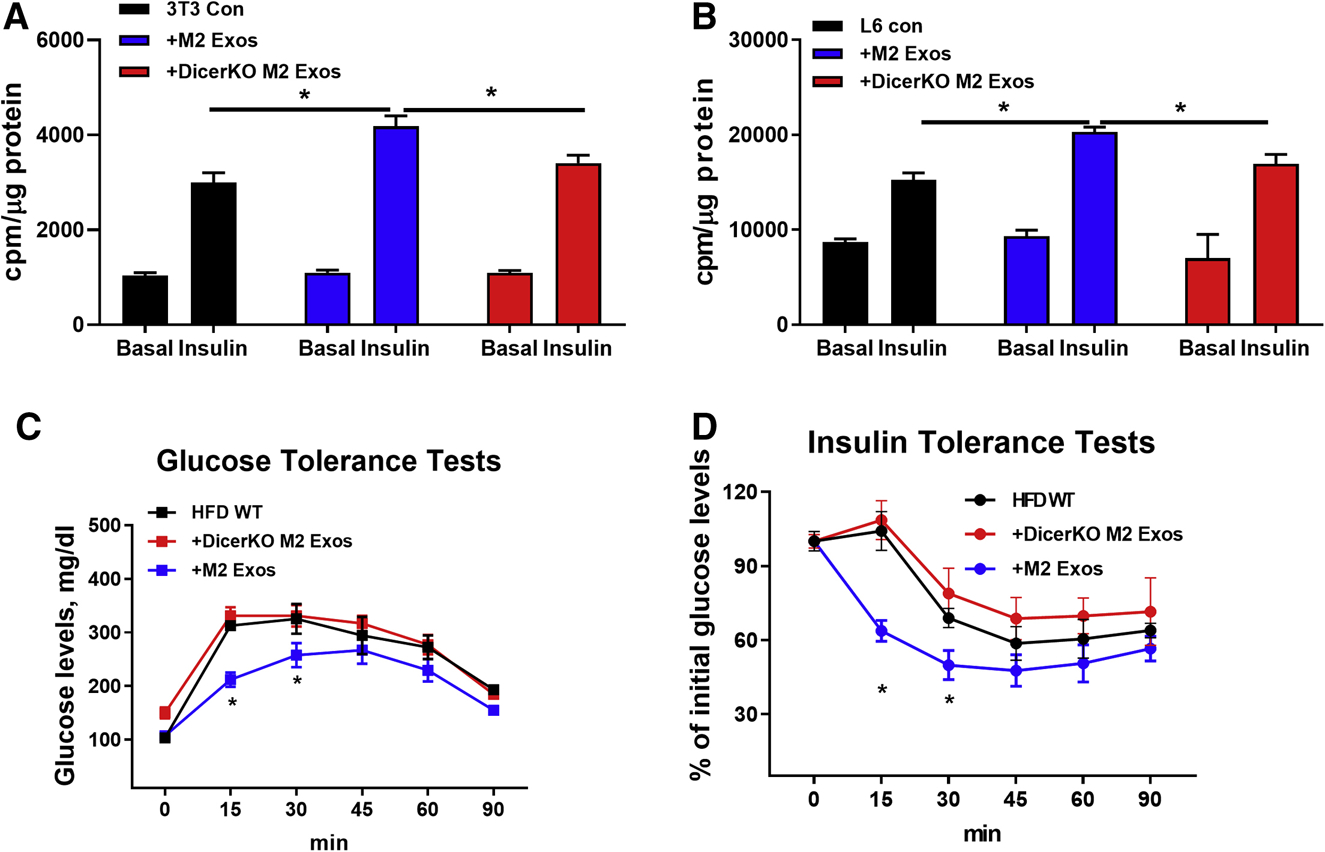
Glucose uptake of 3T3-L1 adipocytes (A) and L6 myotubes (B) after treatment with either M2 Exos or DicerKO M2 Exos. Cells treated with empty liposomes were used as controls.
Effects of 4wks DicerKO M2 Exos treatment on glucose intolerance (C) and insulin resistance (D) of recipient mice starting at 10wks HFD. Additional groups of HFD-fed obese mice were treated with either empty liposomes or M2 Exos.
Data are presented as mean ± SEM. n = 6 per group (A-D). *P < 0.05, Student’s t-test. See also Figure S3.
miR-690 causes enhanced insulin sensitivity.
Given the critical role of miRNAs within macrophage Exos, we next explored the mechanisms by which anti-inflammatory macrophage Exos miRNAs promote insulin sensitivity. We have established the Exos miRNA profile in anti-inflammatory M2-like macrophages (Ying et al., 2017) and assessed 5 of the top 20 overexpressed miRNAs in a 3T3-L1 adipocyte glucose transport screening assay (Figure S4A). Consistent with the high abundance of miR-690 within lean ATM Exos, lean M2-like ATMs expressed more miR-690 than obese M2-like ATMs (Figure S4B). We also observed that anti-inflammatory M2-like BMDMs or RAW264.7 cells expressed much more miR-690, compared to non-activated M0 and LPS-stimulated M1-like macrophages (Figure S4C). miR-690 abundance was similar in M2 BMDMs compared to lean M2 ATMs (Figure S4B). The expression of miR-690 was also higher in Exos from these anti-inflammatory M2-like macrophages (Figure S4D). In addition, we also found that miR-690 abundance was greater in the key metabolic tissues of HFD-fed obese recipient mice after 4 weeks treatment with M2 Exos (Figure S4E). These results suggest that miR-690 could lead to improved insulin sensitivity.
To explore this idea, we utilized a synthetic Cy3 labeled miR-690 mimic and tested whether miR-690 leads to an insulin sensitive phenotype. To test whether miR-690 exerts insulin sensitizing effects in vivo, the miR-690 mimic was encapsulated using Invivofectamine and intravenously injected into WT recipient mice at 10 weeks of HFD. The Cy3 labeled miR-690 mimic is efficiently delivered into key metabolic tissues, as shown by appearance of robust Cy3 red fluorescence in the liver, skeletal muscle, and adipose tissue of obese recipients (Figure S4F). qPCR results confirmed that the transferred miR-690 was significantly overexpressed in these tissues after injection of the miR-690 mimic (Figure S4G). Starting at 10wks of HFD, 4wks treatment with liposomes encapsulating the miR-690 mimic (5 nmol/mouse, twice per week) had no effect on body weight (Figure S4H). After 4 weeks of treatment, mice exhibited significantly improved glucose and insulin tolerance, compared to obese controls injected with empty Invivofectamine (Figures 4A and 4B). In addition, in vivo delivery of the miR-690 mimic led to higher levels of insulin-stimulated AKT phosphorylation in liver, skeletal muscle, and adipose tissue of obese recipients, compared to obese controls. These results show that miR-690 promotes insulin signaling (Figure 4C), indicating its function as an insulin sensitizing miRNA. While there was no change in total ATM number following treatment with liposomes containing the miR-690 mimic (Figure S4I), we found that treatment repolarized the activation state of ATMs towards an anti-inflammatory M2-like phenotype (Figure 4D). Thus, ATMs from treated mice displayed ~40% less M1-like ATMs, an ~6-fold greater number of M2-like ATMs with a resulting 10-fold reduction in the ratio of M1/M2 ATMs (Figure 4D). Consistent with this, qPCR analysis showed that the expression of proinflammatory genes was significantly repressed in epididymal fat after 4 weeks treatment with the miR-690 mimic loaded liposomes (Figure 4E).
Figure 4. miR-690 improves obesity-induced glucose intolerance and insulin resistance.
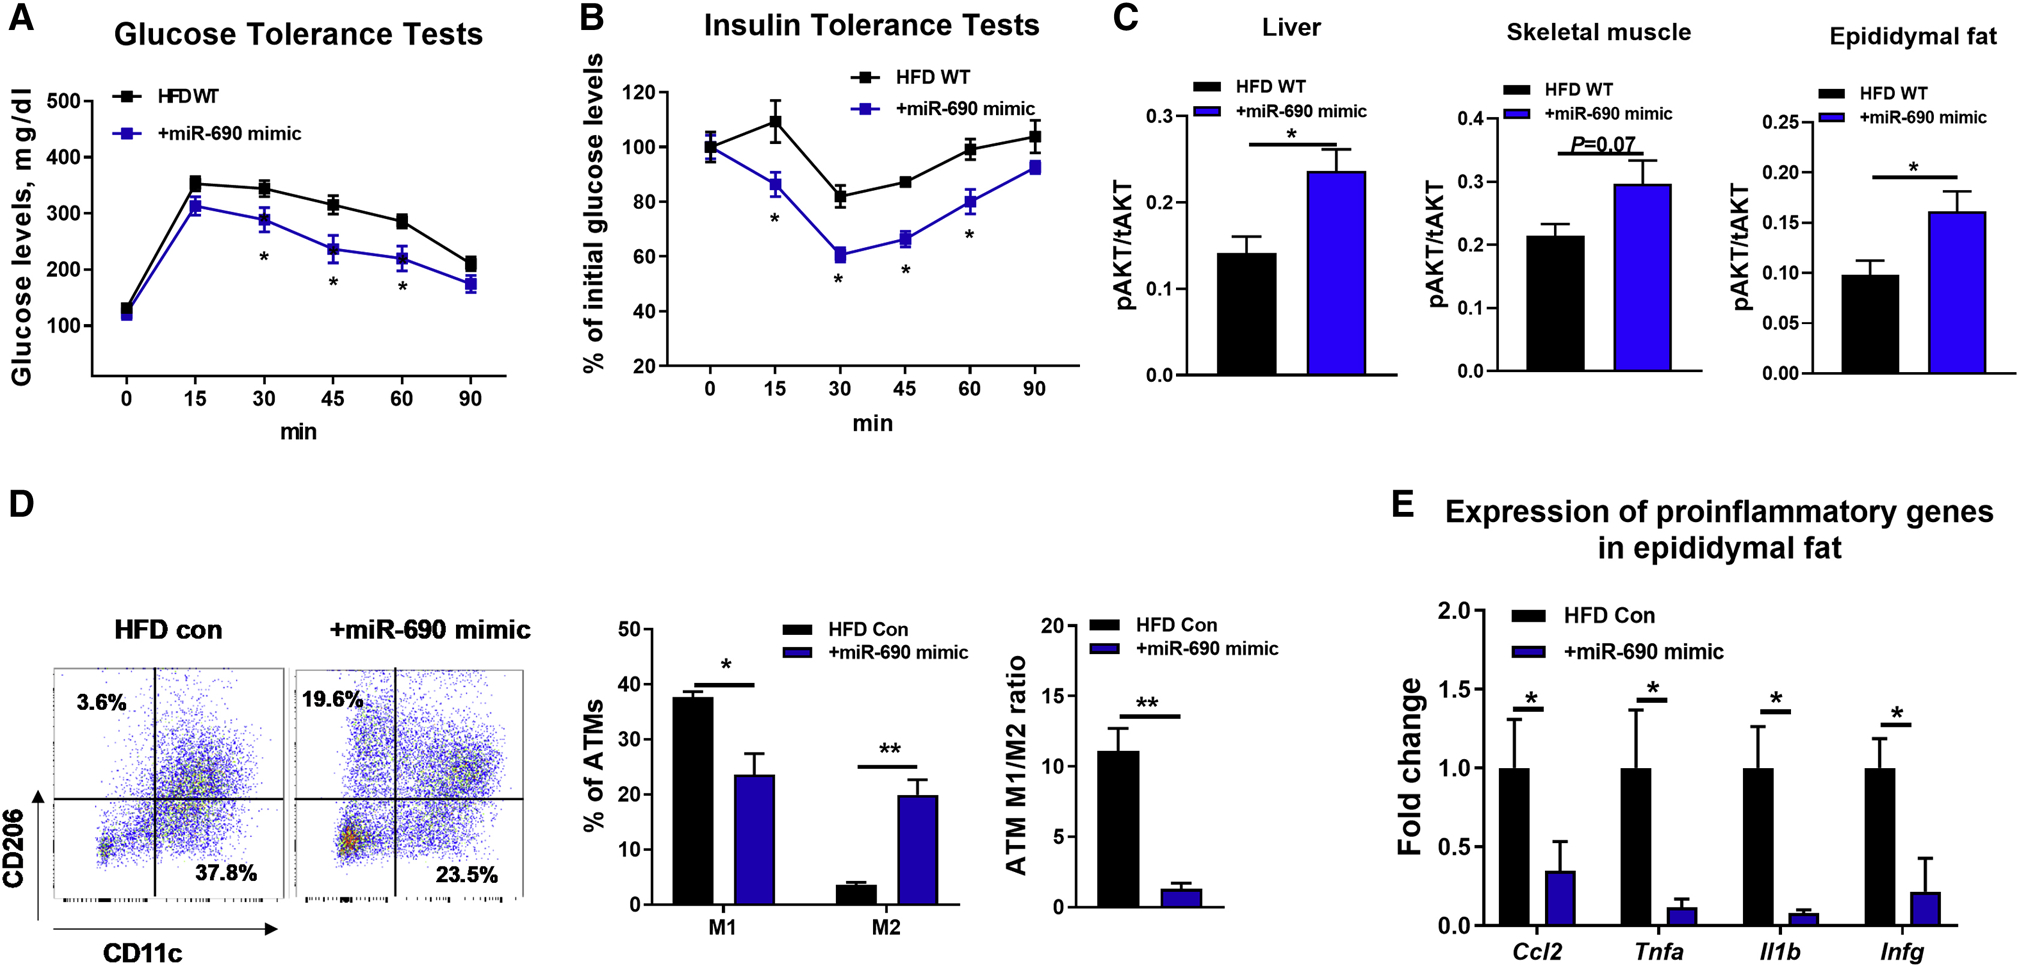
(A and B) Glucose and insulin tolerance tests of obese mice after 4wks treatment with miR-690 mimic/Invivofectamine starting at 10wks of HFD.
(C) Effect of miR-690 mimic/Invivofectamine on insulin-stimulated AKT phosphorylation in metabolic tissues.
(D) Adipose tissue macrophage activation (M1-like ATMs, CD11b+F4/80+CD11c+CD206-; M2-like ATMs, CD11b+F4/80+CD11c-CD206+) and the abundance of proinflammatory genes in epididymal fat (E) after treatment with miR-690 mimic/Invivofectamine.
Data are presented as mean ± SEM. n = 6 per group (A-C); n = 4 per group (D and E). *P < 0.05, Student’s t-test. See also Figure S4.
For in vitro studies, we used the synthetic miR-690 mimic to directly treat 3T3-L1 adipocytes and L6 myocytes and found greater insulin-stimulated glucose uptake in both cell types (Figures 5A and 5B; Figure S5A and S5B). In addition, miR-690 mimic treatment led to significantly reduced glucagon-induced hepatic glucose production in primary hepatocytes from obese mice (Figure 5C; Figure S5C). Insulin stimulated AKT phosphorylation was also greater in the miR-690 mimic treated cells, consistent with enhanced insulin signaling (Figure 5D). Co-transfection with a miR-690 hairpin inhibitor blocked the insulin sensitizing effects of miR-690 in 3T3-L1 adipocytes and primary hepatocytes (Figures S5D and S5E), but had negligible effects on control cells without miR-690 mimic treatment.
Figure 5. miR-690 enhances cellular insulin sensitivity.
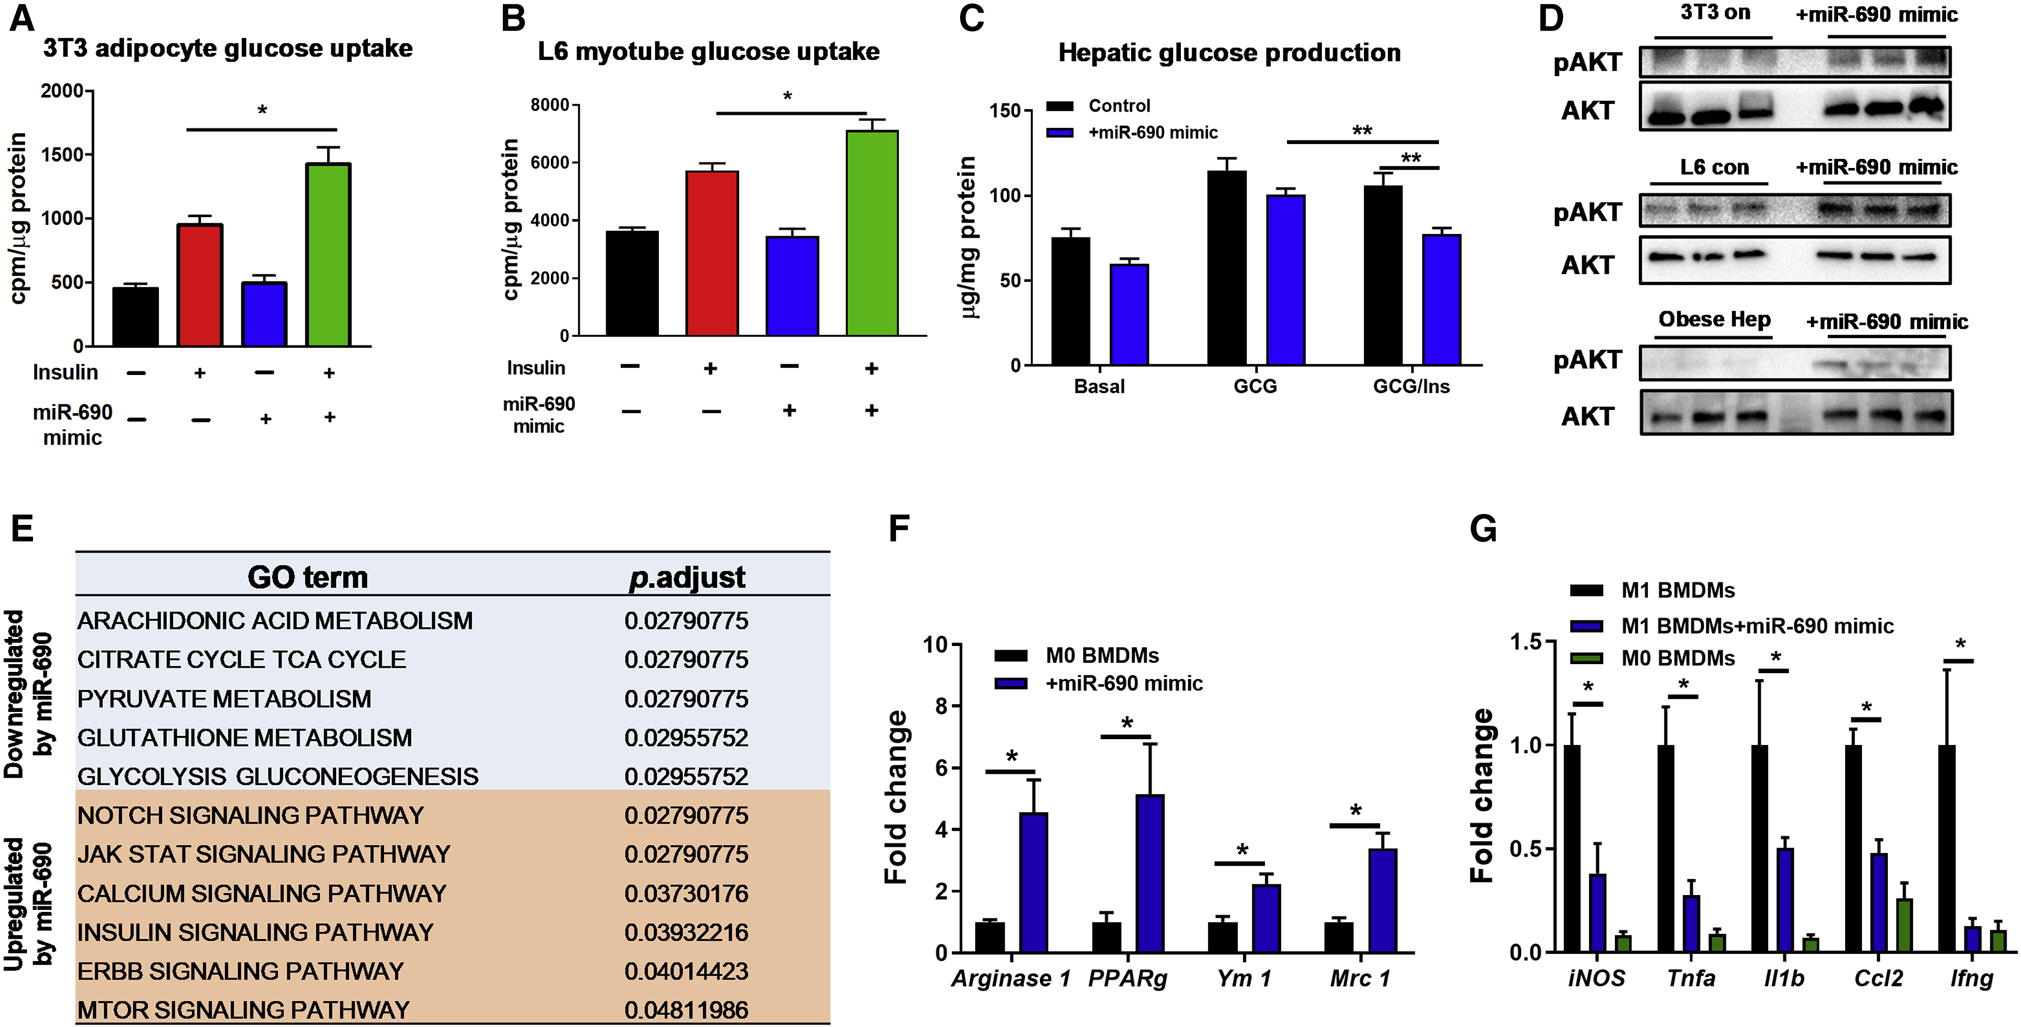
Effect of the miR-690 mimic on glucose uptake in 3T3-L1 adipocytes (A) and L6 myotubes (B) and hepatic glucose output in primary mouse hepatocytes (C). Cells transfected with an inactive miRNA mimic were used as controls.
(D) The insulin-stimulated phosphorylation of AKT after transfection with the miR-690 mimic.
(E) Pathways in 3T3-L1 adipocytes were upregulated or repressed after overexpression of miR-690. Effects of miR-690 on anti-inflammatory M2 activation of naïve M0 BMDMs (F) or on attenuating pro-inflammatory responses of LPS-stimulated BMDMs (G) were evaluated by qPCR analysis.
Data are presented as mean ± SEM. n = 6 per group (A-C, E); n = 4 per group (F and G). *P < 0.05, Student’s t-test. See also Figure S5.
To further understand the regulatory effects of miR-690, mRNA sequencing analysis on 3T3-L1 adipocytes was performed. Using gene ontology algorithms, we assessed functional annotations of differentially expressed genes between controls and cells transfected with the miR-690 mimic. As shown in Figure 5E, overexpression of miR-690 led to upregulation of pathways such as JAK/STAT and insulin signaling with suppression of pathways such as glutathione metabolism. Consistent with the marked increase in the anti-inflammatory ATMs in miR-690 liposome treated mice (Figure 4D), transfection of the miR-690 mimic into M0 bone marrow-derived macrophages promoted anti-inflammatory activation of BMDMs, as shown by elevated abundance of anti-inflammatory gene markers (Figure 5F) and less proinflammatory activation in the presence of liposaccharide (LPS) (Figure 5G).
It seemed possible that the uptake and biologic effects of these miR-690-containing liposomes might be different if the miR-690 mimic was expressed in natural Exos containing the essential lipid and protein cargoes. Additionally, perhaps miR-690 needs to work in concert with other Exos miRNAs to enhance insulin signaling. To assess these possibilities, we transfected the miR-690 mimic into BMDMs obtained from myeloid cell specific DicerKO mice, which can only produce miRNA-free Exos. Exos were then harvested from culture medium of these cells. These Exos were conjugated with latex beads (1×10⁸ Exos/1×107 beads), as described in previous studies (Phinney and Isakova, 2014; Suarez et al., 2017). We confirmed packaging of the Cy3-miR-690 mimic into these DicerKO BMDM Exos, as seen by Cy3 red fluorescence upon flow cytometric analyses (Figure S6A). Additionally, qPCR showed that miR-690 was enriched in DicerKO BMDM Exos after transfection with the Cy3-miR-690 (Figure S6B). WT mice on 12 weeks HFD were treated with these miR-690 enriched DicerKO BMDM Exos (1×10⁹ Exos/mouse) and the results showed robust delivery to metabolic tissues, as evidenced by the presence of Cy3 red fluorescence in the liver, skeletal muscle, and epididymal fat of obese recipients (Figure S6C). To evaluate the impact of miR-690 enriched Exos on insulin sensitivity, WT HFD mice were injected with either empty or miR-690 enriched DicerKO BMDM-derived Exos (1×10⁹ Exos/mouse, twice per week) starting at 10 weeks on HFD. After 5 weeks treatment, all mice had comparable body weight (Figure S6D). However, miR-690 BMDM-derived Exos treatment led to greater accumulation of miR-690 in liver, skeletal muscle and adipose tissues (Figure S6E), concomitant with improved glucose and insulin tolerance (Figures 6A and 6B). This improvement in in vivo insulin sensitivity was confirmed by hyperinsulinemic-euglycemic clamp studies. We observed higher glucose infusion rates and a greater degree of insulin-mediated suppression of hepatic glucose production, circulating free fatty acid levels, and enhanced insulin-stimulated glucose disposal rate (Figure 6C). Higher insulin-stimulated AKT phosphorylation was observed in liver, skeletal muscle and adipose tissue (Figure 6D). In addition, compared to controls, we observed that miR-690 enriched BMDM-derived Exos treatment led to a greater number of anti-inflammatory M2-like ATMs, a reduction in M1-like ATMs (Figure S6F), as well as lower expression of proinflammatory genes in epididymal fat (Figure S6G).
Figure 6. miR-690-enriched Exos can promote insulin sensitivity.
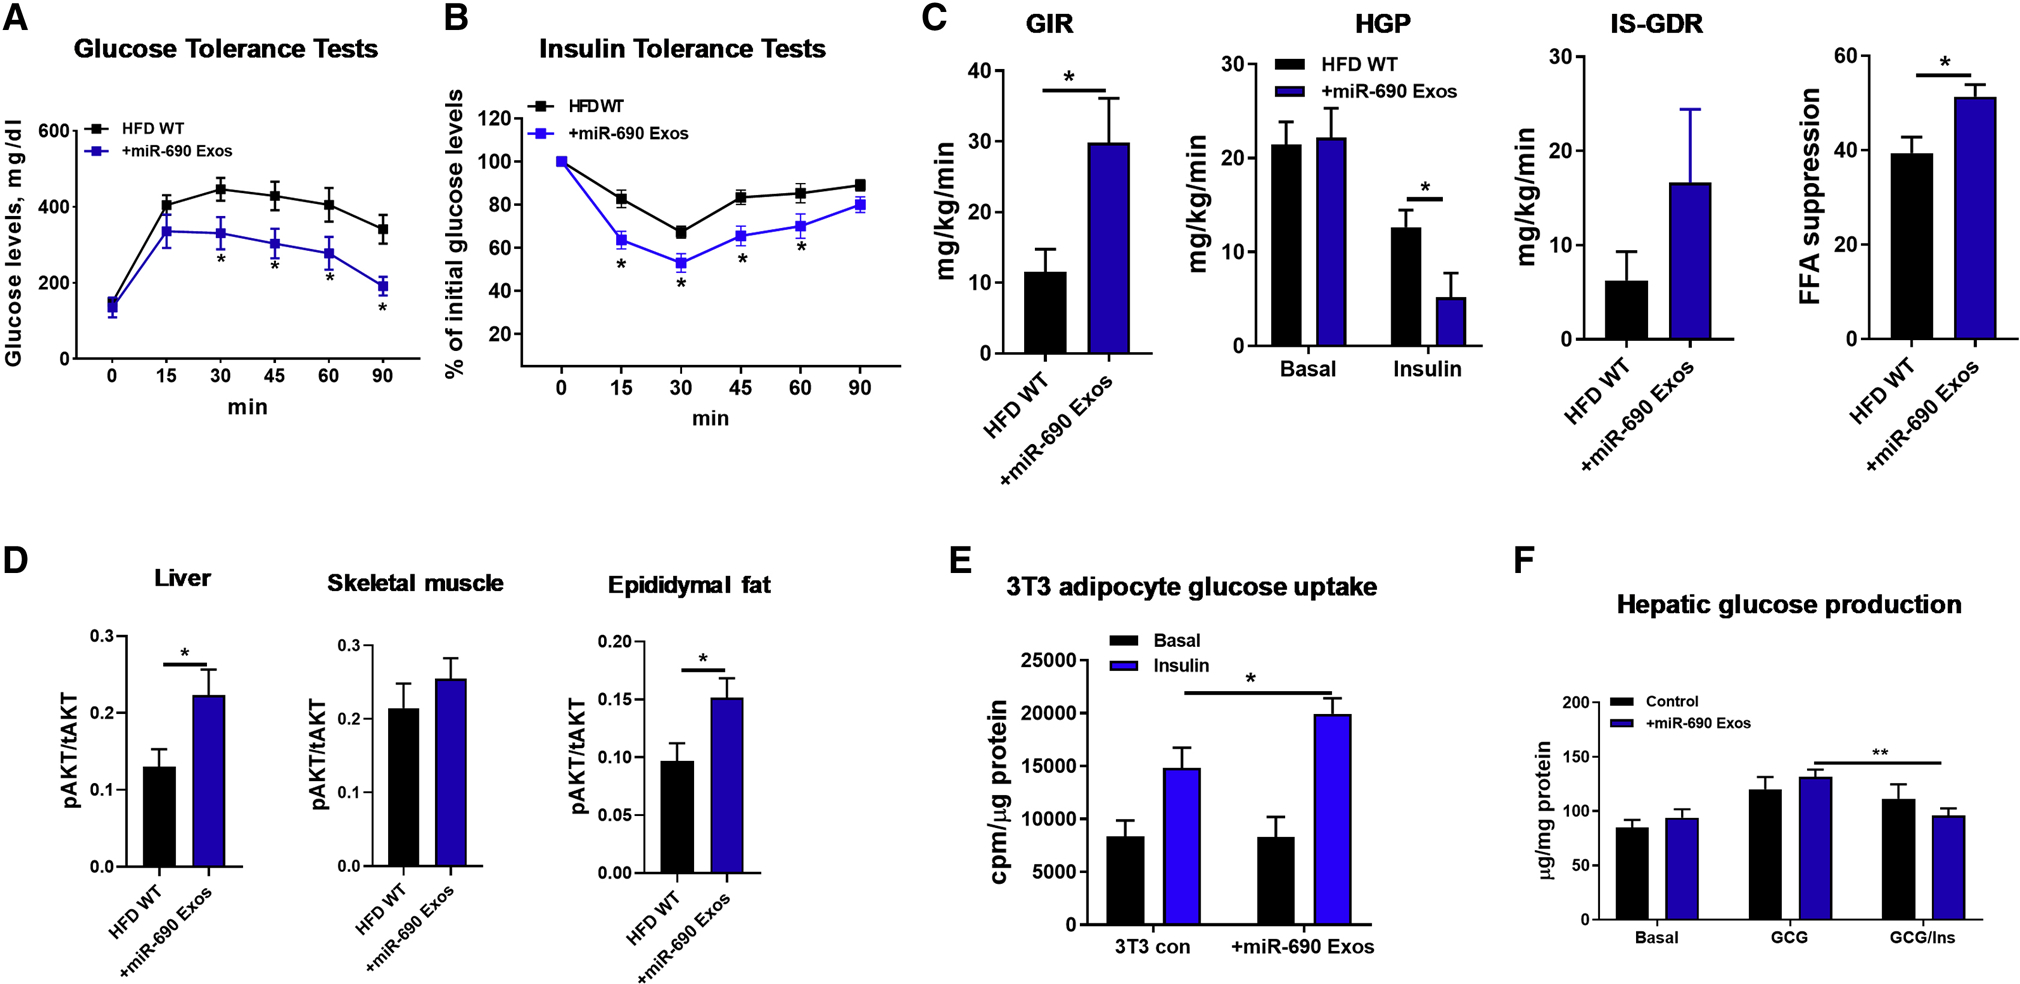
(A and B) Glucose tolerance and insulin sensitivity in HFD/obese mice after 5 weeks treatment with either DicerKO miR-690-enriched Exos or control DicerKO Exos.
(C) Glucose infusion rate (GIR), the percent suppression of free fatty-acid levels (FFA suppression), hepatic glucose production (HGP), and insulin-stimulated glucose disposal rate (IS-GDR, P=0.1) during hyperinsulinemic-euglycemic clamp studies.
(D) The levels of insulin-stimulated AKT phosphorylation in liver, skeletal muscle, and epididymal fat of HFD/obese mice treated with miR-690 Exos were measured with phospho-AKT (Ser473)/total AKT ELISA kits.
Effects of miR-690 Exos on 3T3-L1 adipocyte glucose uptake (E) and hepatic glucose production (F). Control cells were treated with miRNA-free DicerKO BMDM Exos.
Data are presented as mean ± SEM. n = 6 per group (A, B, D-F); n = 4–6 per group (C). *P < 0.05, Student’s t-test. See also Figure S6.
We also conducted in vitro studies with 3T3-L1 adipocytes and primary mouse hepatocytes. After coculturing with Exos prepared from miR-690 transfected DicerKO BMDMs, both 3T3-L1 adipocytes and hepatocytes expressed greater levels of miR-690, compared to control cells (Figure S6H). 3T3-L1 adipocytes treated with miR-690 Exos showed a greater degree of insulin-stimulated glucose uptake (Figure 6E). Insulin-induced suppression of hepatic glucose production was also enhanced in primary hepatocytes from obese mice treated with miR-690 Exos, compared to control obese hepatocytes (Figure 6F). Overall, these results demonstrate that miR-690 contributes to the beneficial effects of anti-inflammatory macrophage Exos on insulin action both in vivo and in vitro.
Nadk is a target gene of miR-690 that can modulate insulin signaling.
miRNAs exert their biological actions by either blocking translation and/or inducing degradation of target mRNAs by seed sequence base-pairing to mRNA recognition sites (Bartel, 2004, 2009). To identify target genes of miR-690, we used the target gene prediction algorithm TargetScan Mouse 7.2 (Agarwal et al., 2015). Among the tested potential targets containing the potential miRNA recognition sites, Nadk, a gene encoding NAD+ kinase, was highly repressed in 3T3-L1 adipocytes, L6 myocytes or primary hepatocytes after overexpression of miR-690 (Figure 7A). In addition, Nadk expression was significantly reduced in liver, skeletal muscle, and adipose tissue of obese recipients treated with miR-690/Invivofectamine (Figures S7A–S7C). Furthermore, we found that the human hepatocyte HepG2 cell line expressed much less NADK after transfection with the miR-690 mimic (Figure S7D). To further assess whether Nadk is a genuine target mRNA of miR-690, we performed luciferase reporter assays with a construct containing the 3’ untranslated region (UTR) of Nadk containing the miR-690 binding site. After 24 hours co-transfection of this reporter construct and the miR-690 mimic into HEK293 cells, luciferase activity was significantly reduced, compared to control cells transfected only with the Nadk 3’UTR containing luciferase construct (Figure 7B). Thus, these results suggest that Nadk is a bona fide miR-690 target mRNA.
Figure 7. The miR-690-Nadk axis plays a role in mediating cellular insulin responses.
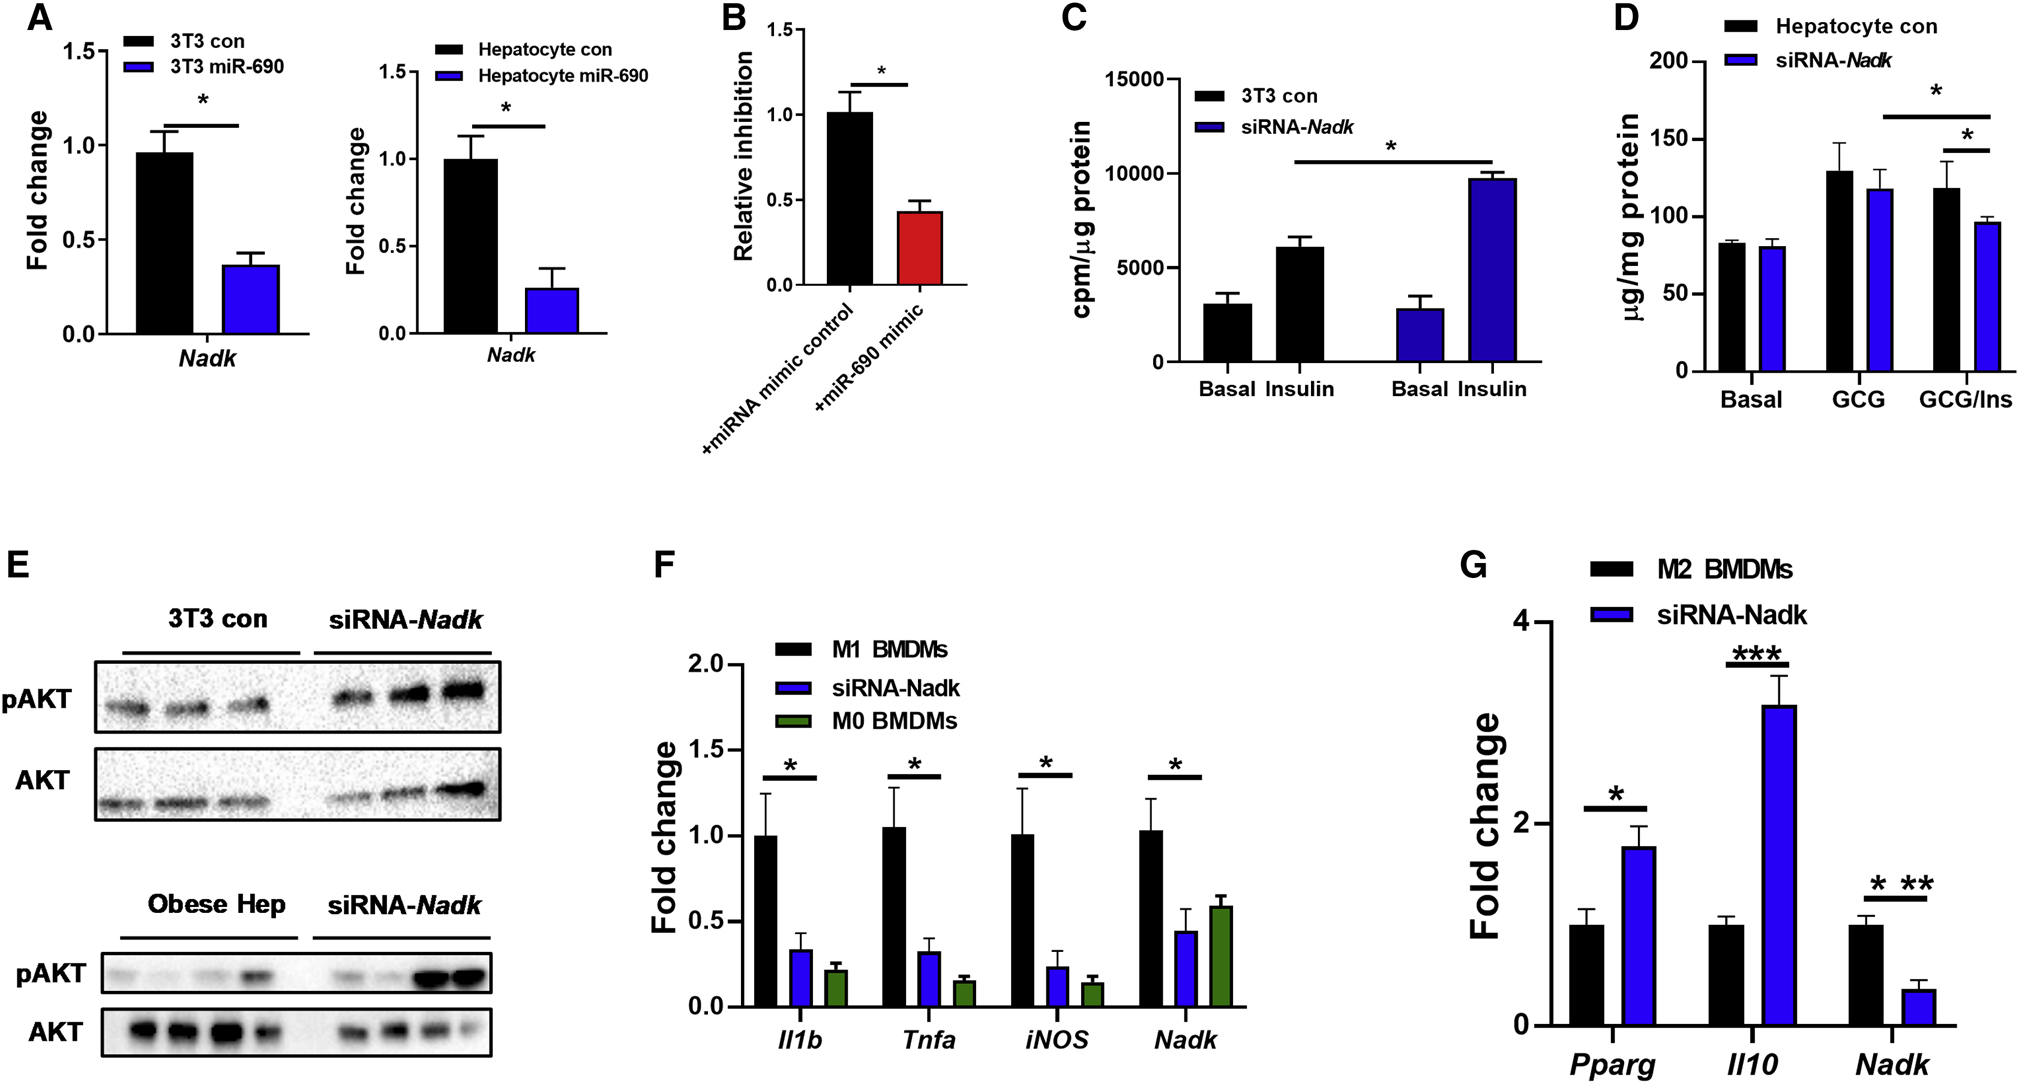
(A) Nadk abundance in 3T3-L1 adipocytes and hepatocytes after overexpression of miR-690.
(B) Luciferase activity of HEK293 cells after co-transfection of a reporter construct containing the 3’UTR region of Nadk with either the miRNA mimic control or miR-690 mimic.
Effect of Nadk siRNA on 3T3-L1 adipocyte glucose uptake (C) and hepatic glucose output in primary mouse hepatocytes (D). Controls cells were transfected with a scrambled siRNA.
(E) The levels of insulin-stimulated AKT phosphorylation after transfection of the Nadk siRNA.
Effect of Nadk knockdown on macrophage activation (F and G) was measured by qPCR analysis.
Data are presented as mean ± SEM. n = 6 per group (A-D); n = 4–6 per group (F and G). *P < 0.05, Student’s t-test. See also Figure S7.
We next evaluated the importance of miR-690-mediated Nadk suppression on cellular insulin sensitivity. After knockdown of Nadk with short interfering RNAs (siRNA-Nadk), 3T3-L1 adipocytes exhibited enhanced insulin stimulated glucose uptake (Figures 7C). In addition, siRNA-Nadk knockdown in obese mouse hepatocytes led to a reduction in hepatic glucose production after glucagon stimulation (Figure 7D). We also observed that Nadk knockdown resulted in greater activation of insulin signaling, as evidenced by higher levels of phosphorylated AKT in cells transfected with siRNA-Nadk (Figure 7E). However, treatment with both siRNA-Nadk and miR-690 Exos did not further improve the insulin effect, compared to the cells treated with either siRNA-Nadk or miR-690 Exos alone (Figure S7E). Overall, these data demonstrate that the miR-690-Nadk axis plays a role in modulating cellular insulin signaling.
We also observed a marked reduction in Nadk expression in BMDMs after overexpression of miR-690 (Figure S7F). To assess the role of Nadk in regulating macrophage polarization, BMDMs were transfected with an siRNA to inhibit Nadk expression. Similar to the ATM phenotype observed with in vivo miR-690 enriched DicerKO BMDM Exos treatment or overexpression of miR-690 in BMDMs, Nadk suppression blunted proinflammatory gene expression in BMDMs in the presence of LPS stimulation (Figure 7F). In addition, downregulation of Nadk in BMDMs led to a greater level of anti-inflammatory gene expression, after treatment with IL4/IL13 (Figure 7G).
Discussion
Insulin resistance is a major pathophysiologic feature of T2D, and obesity is the most common cause of insulin resistance in man (Johnson and Olefsky, 2013; Kahn et al., 2006; Roden and Shulman, 2019). Indeed, the world-wide obesity epidemic is the main driver of the parallel rise in T2D prevalence (Ogden et al., 2016). Therefore, a new method to enhance insulin sensitivity would have important disease-modifying potential. In this study, we have shown that Exos derived from M2 polarzied BMDMs can attenuate obesity-associated glucose intolerance and insulin resistance. miRNAs are responsible for the beneficial effects of M2 Exos, as evidenced by the minimal effect of miRNA-free BMDM Exos on insulin sensitivity. We find that miR-690, which is highly enriched in BMDM M2 Exos, can enhance insulin action both in vivo and in vitro. Packaging of miR-690 in miRNA deficient DicerKO BMDM Exos restores the beneficial effects of BMDM Exos on glucose tolerance and insulin sensitivity. Finally, we show that Nadk is a bona fide target mRNA of miR-690, and that the miR-690-Nadk axis can regulate cellular insulin activity.
Emerging evidence indicates that various types of EVs, including exomeres, exosomes, and microvesicles, can serve as circulating vehicles transporting miRNAs into neighboring or distant cells (Mathieu et al., 2019). Our previous studies demonstrated that ATMs from insulin sensitive lean mice secrete miRNA-containing Exos which can be transported to insulin target cells where they promote insulin sensitivity (Ying et al., 2017). However, it is challenging to harvest enough macrophages from lean adipose tissue for more in-depth mechanistic studies, because of the small number of ATMs in lean, healthy mice. In these current studies, we used mouse BMDMs as Exos producers. BMDMs were polarized to the anti-inflammatory M2 state by in vitro treatment with IL4/IL13 (Van Dyken and Locksley, 2013; Ying et al., 2013). Conditional medium from these cells was used to harvest M2 BMDM Exos according to the ultracentrifugation-based method we previously described (Ying et al., 2017). The majority of vesicles derived from BMDMs displayed the typical characteristics of Exos, as evidenced by a diameter of 30–150 nanometers by NanoSight and electron microscopic analysis, and expression of the exosome-associated markers TSG101, Syntenin 1, and CD63 (Kowal et al., 2016).
Previous studies report that pro-inflammatory M1-like macrophage-derived Exos can blunt cellular insulin sensitivity (Ying et al., 2017; Zhang et al., 2015). Given that macrophages residing in lean adipose tissue are largely anti-inflammatory M2-like cells and their Exos have beneficial effect on insulin sensitivity (Lackey and Olefsky, 2016; Ying et al., 2017), we stimulated BMDMs with IL4/IL13 to drive them towards an anti-inflammatory phenotype. The concept that anti-inflammatory, M2-like BMDMs-derived Exos can enhance glucose tolerance and insulin sensitivity is supported by both our in vivo and in vitro data. 4-week treatment of obese/HFD mice with M2 BMDM Exos led to improved glucose intolerance and insulin resistance. In vitro studies showed that treatment with M2 BMDM Exos promoted cellular insulin sensitivity, as demonstrated by enhanced insulin action on 3T3-L1 adipocyte glucose uptake or hepatic glucose production.
Exos contain a variety of cargo components, including miRNAs, other RNA species, lipids and proteins (Whitham et al., 2018). Most Exos functions have been attributed to miRNAs that negatively regulate target mRNA expression by binding to specific sequences in the 3’ UTR, resulting in mRNA degradation or translational arrest. Indeed, our results demonstrate that miRNAs within the M2 BMDM Exos are responsible for the insulin sensitizing phenotype we observed. Thus, miRNA-free M2 BMDM Exos collected from DicerKO BMDMs had negligible effects on insulin sensitivity in both in vivo and in vitro experiments. Consistent with this, Thomou et al. (2017) have shown that DicerKO adipocytes produce miRNA-free Exos which do not regulate gene expression of target cells. Another study by Phinney et al. (2015) also supports the key role of miRNAs in the function of mesenchymal stem cell (MSC) Exos, as demonstrated by non-significant effect of DicerKO MSC Exos on macrophage activation. In addition, our earlier report showed that Exos derived from Drosha-depleted macrophages showed a marked reduction in miRNA content and these Exos had no effect on cellular insulin responses, compared to WT macrophage Exos (Ying et al., 2017).
Our previous studies identified the miRNA profile within Exos derived from M2-like lean ATMs (Ying et al., 2017). Among the miRNAs highly enriched in these Exos, we now find that miR-690 functions as a novel insulin sensitizer, since it has beneficial effects on insulin action after in vitro expression of miR-690 in either 3T3-L1 adipocytes or hepatocytes. In addition, in vivo delivery of artificial liposomes encapsulating miR-690 shows that these particles are taken up by insulin target tissues, leading to greater expression of miR-690. In vivo treatment with these miR-690 containing liposomes led to improved glucose tolerance and insulin sensitivity in HFD-fed obese recipient mice. To further validate that miR-690 is responsible for these beneficial metabolic effects in the context of intact Exos, the miR-690 mimic was packaged into DicerKO BMDMD Exos. We found that in vivo treatment of HFD/obese recipient mice with the miR-690-overexpressing DicerKO BMDM Exos improved liver and adipose tissue insulin sensitivity. These beneficial effects are also supported by in vitro results with DicerKO BMDM Exos treated 3T3-L1 adipocytes and hepatocytes. In addition to the direct impact of miR-690 on insulin sensitivity, treatment with miR-690 attenuated obesity-associated adipose tissue inflammation and repolarized macrophages from the M1 to the M2 state, which would also contribute to improved insulin sensitivity. Together, these data indicate that miR-690 is largely responsible for the insulin sensitizing effects of M2 Exos.
To further understand the mechanisms underlying the effects of miR-690 on cellular insulin sensitivity, we profiled the transcriptome of 3T3-L1 adipocytes overexpressing miR-690. This analysis revealed that the miR-690 mimic represses the expression of many mRNAs that are associated with, for example, activation of insulin signaling and repression of glutathione metabolism. Among the mRNAs repressed by miR-690, we conducted further studies on Nadk, a gene encoding NAD+ kinase that converts nicotinamide adenine dinucleotide (NAD+) to NADP+ and found that it is a bona fide target mRNA of miR-690. The inhibitory effects of NAD+ kinase on cellular insulin action was evidenced by improved in vitro insulin signaling after siRNA-induced depletion of Nadk in 3T3-L1 adipocytes and hepatocytes. In addition, depletion of macrophage Nadk promoted the anti-inflammatory and inhibited the proinflammatory state. Previous studies have shown that obesity can reduce NAD+ levels through either repression of NAD+ biosynthesis or greater utilization of NAD+ (Canto et al., 2012; Katsyuba et al., 2020; Stromsdorfer et al., 2016). In addition, Yoshino et al. (2018; 2011) suggested that treatment with nicotinamide mononucleotide, a NAD+ intermediate, can enhance insulin sensitivity. However, the precise mechanisms by which NAD kinase modulates obesity-associated glucose intolerance and insulin resistance remain to be fully explored.
In summary, we find that M2-polarized BMDM-derived Exos can improve insulin sensitivity. Treatment with M2 Exos leads to enhanced in vivo and in vitro insulin sensitivity, whereas, depletion of Exos miRNAs prevents these effects. We identify miR-690 is a key insulin sensitizing miRNA that is highly expressed within M2 Exos, suggesting that this miRNA could become a new insulin sensitizing agent for the treatment of metabolic diseases.
Limitations of study
These studies were conducted in mice and whether comparable effects will be observed in human studies remains to be assessed, although miR-690 is expressed in human cells. With respect to translation, small RNA molecules are already in the clinic and, therefore, the manufacturing and developmental steps are all feasible and known. We also note that all of our Nadk experiments are in vitro and do not include animal studies. Experiments in myeloid-specific miR-690 KO mice, which are currently being developed, will be important to determine whether lean mice deprived of ATM-derived Exos containing miR-690 become insulin resistant. These KO mice should also allow us to deconvolute the relative contributions of direct effects to enhance insulin signaling vs. inhibition of ATM inflammation to the overall insulin sensitizing effects of miR-690. Unfortunately, given the current Covid-19 research restrictions, breeding tissue-selective KOs is not feasible and could not be done in the foreseeable future. Such studies will be important when this situation changes. Finally, it is possible that there are additional relevant mRNA targets of miR-690 and this should be the subject of future studies.
STAR Methods
RESOURCE AVAILABILITY
Lead Contact
Further information and requests for resources and reagents should be directly to and will be fulfilled by the Lead Contact, Jerrold M. Olefsky (jolefsky@health.ucsd.edu).
Materials Availability
All mouse lines in this study are available from the Jackson Laboratory.
Data and Code Availability
The RNA-seq data have been deposited in the NCBI Gene Expression Omnibus under accession number GSE149610.
EXPERIMENTAL MODEL AND SUBJECT DETAILS
Mice
C57BL/6 (B6) mice were fed a high-fat diet (60% fat calories, 20% protein calories, and 20% carbohydrate calories; Research Diets) or a normal chow diet ad libitum. In most assays, 8 weeks old mice were fed with HFD for 12–16 weeks. B6 WT, Dicer flox/flox and LysMCre mice were purchased from the Jackson Laboratory and allowed to adapt to housing in the University of California, San Diego animal facility for 1 week prior to random assignment to experiment cohorts or breeding cages. To generate myeloid cell-specific Dicer null mice, Dicer flox/flox were bred with transgenic mice harboring Cre recombinase driven by myeloid-specific lysozyme M promoter to create the following genotypes: Dicer flox/flox (control) and LysMCre-Dicer (DicerKO). In the experiments using DicerKO mice, Dicer flox/flox littermates were used as controls. All mice used in this study were male and maintained on at 22°C in a 12/12-hour light-dark cycle in a specific pathogen-free facility and given free access to food and water.
Study approval
All animal procedures were done in accordance with University of California, San Diego Research Guidelines for the Care and Use of Laboratory Animals and all animals were randomly assigned to cohorts when used.
Differentiation of adipocytes
To generate adipocytes, 3T3-L1 cells were differentiated in the induction medium (DMEM/F12 medium containing 4.5 g/L glucose, 10% FBS, penicillin-streptomycin, and glutamine and then induced with a differentiation cocktail consisting of 0.5 mM 3-isobutyl-1-methylxanthine, 1 μM dexamethasone, 10 μg/mL insulin, 0.2 mM indomethacin, and 1 μM rosiglitazone in DMEM supplemented with 10% FBS, PS, and glutamine) for 7–10 days.
Isolation of primary hepatocytes
Primary hepatocytes were isolated as described previously (Li et al., 2016; Ying et al., 2017). Briefly, mice were infused with a calcium free HEPES-phosphate buffer A (Calcium and magnesium-free PBS containing 0.2 μM EGTA, 10 mM HEPES, 1 mM glucose and 0.2% BSA, pH 7.4) via the vena cava for 3–5 min. After the color of the liver changed to a beige or light brown color, collagenase-containing buffer B (PBS with 1 mM magnesium and 1 mM calcium, 0.2% BSA, and 30 mM HEPES, 0.5mg/ml collagenase H) was perfused into liver. After the appearance of cracking on the surface of liver, perfusion was stopped immediately and the liver was excised into ice-cold buffer A. Cells from digested livers were teased out, suspended in Buffer A, filtered through 100 μm cell strainer, and centrifuged at 60 × g for 6 min at 4°C. The pellet was washed with Buffer B (no collagenase) twice and then mixed with Percoll (adjusted to physiological ionic strength with 10x PBS) to a final concentration of 36% and centrifuged at 100 × g for 10 min, 4°C. After removing the supernatant, the hepatocyte pellet was washed once with Buffer B (without collagenase) and then cultured in Williams Medium E containing 10% FBS on collagen-coated plates (GIBCO, Life Technologies) and antibiotics. After overnight incubation (16 hr), culture medium was refreshed.
METHOD DETAILS
Glucose tolerance and insulin tolerance tests.
For glucose tolerance tests, mice received one dose of dextrose (1 g/kg body weight) via i.p. injection after 12 hr of fasting. To measure the glucose-stimulated insulin secretion, about 20 μL of plasma were collected after glucose injection for 10 min. For insulin tolerance tests, mice were fasted for 6 hr and then i.p. injected with insulin (0.35 units/kg body weight for HFD mice).
Hyperinsulinemic-euglycemic clamp studies.
To perform hyperinsulinemic-euglycemic clamp assays, mice were surgically implanted with jugular vein cannulation. Three to five days after recovery, 6-hour fasted mice were infused with D-[3–3H] glucose (Perkin Elmer) for 90 min. After tracer equilibration, blood sampling occurred, then glucose (50% dextrose) and tracer (5 μCi/h) plus insulin (8 mU/kg/min) were infused into the jugular vein. Blood samples were measured from the tail vein at 10 min intervals. The steady-state conditions (120 mg/dl ± 10 mg/dl) was confirmed at the end of the clamp by maintaining glucose infusion and plasma glucose concentration for a minimum of 20 min. Blood samples at time point = −10, 0 (basal), 110, and 120 (end of experiment) min were collected to determine glucose-specific activity, as well as free fatty acid and insulin concentration. Tracer-determined rates were quantified by using the Steele equation for steady-state conditions. At steady state, the rate of glucose disappearance (GDR) is equal to the sum of the rate of endogenous glucose productions (HGP) plus the exogenous GIR. The IS-GDR is equal to the total GDR minus the basal glucose turnover rate.
In vivo insulin-stimulated AKT phosphorylation assay
Tissue insulin action was evaluated by measuring insulin-stimulated AKT phosphorylation in liver, skeletal muscle, and epididymal white adipose (eWAT). Briefly, after 8 hr fasting, mice were anesthetized and parts of these insulin target tissues were collected to measure basal level of AKT phosphorylation. After a dose of insulin (0.35 U/kg body weight for HFD mice) injected via vena cava, parts of liver, skeletal muscle, and eWAT were collected at 3 min, 7 min, and 10 min, respectively. The phosphorylation of AKT was measured using AKT ELISA kits.
Exos purification and characterization
The Exos from BMDM culture medium were prepared as previously described (Ying et al., 2017). After 24 hours culture, debris and dead cells in the medium were removed by centrifugation at 1,000 × g for 10 min and then filtrated through a 0.2 μm filter. The medium was then subjected to ultracentrifugation at 100,000 × g for 4 hours at 4°C. After wash with PBS (100,000 × g for 20 min), the EV-containing pellet was resuspended in 1 ml PBS and passed through a 0.2 μm filter to remove large particles. The particle size and concentration of ATM EVs were measured by NanoSight analysis (Malvern Instruments). To monitor Exos trafficking, Exos were labeled with PKH26 fluorescent dye using the PKH26 fluorescent cell linker kit (Sigma-Aldrich). After PKH26 staining, the EVs were washed with PBS and collected by ultracentrifugation (100,000 × g for 2 hours) at 4°C. Finally, PKH26 labeled EVs were resuspended in PBS.
In vivo Exos trafficking assays
PKH26-labeled BMDM Exos or Cy3-miR-690 containing EVs (1×10⁹ Exos per mouse) were delivered to HFD recipient mice through injection into tail vein. After 16 hours Exos injection, parts of Liver, skeletal muscle, and eWAT were collected for detecting the appearance of PKH26 red fluorescence.
In vivo and in vitro Exos treatment
For in vitro assays, 1×10⁸ Exos on the basis of NanoSight analysis were added to 0.1×10⁶ cells for 36 hours. For in vivo treatment, recipient mice were intravenously injected 1×10⁹ EVs twice per week.
Differentiation of bone marrow-derived macrophages
Bone marrow-derived macrophages (BMDMs) were prepared as previously described (Ying et al., 2013). BMDMs were treated with IL4 (20 ng/mL) and IL13 (10 ng/mL) to stimulate M2 polarization. After 24 hours, culture medium was replaced and BMDMs were cultured for another 24 hours for exosome collection. BMDMs were treated with LPS (100 ng/mL) to stimulate M1 polarization.
miR-690 mimic transfection or in vivo treatment
Cy3 labeled miR-690 mimic or miR-690 mimic were transfected into recipient cells with the lipofectamine RNAiMAX reagent (ThermoFisher Scientific). After 24 hours, the transfection efficiencies were validated by qPCR analysis. For the in vivo delivery, miR-690 mimic was encapsulated with Invivofectamine and then administrated into obese/HFD recipient WT mice (5 nmol mimic per mouse, twice per week) through tail vein injection.
Immuno-fluorescence staining
Pieces of liver, skeletal muscle and eWAT of HFD mice were snap frozen in optimum cutting temperature (O.C.T., Fisher Healthcare) with dry ice. Six μm cryo-sections of tissue sections were cut and fixed with pre-cold acetone for 20 min. Immunostaining was performed as previously described. Slides were blocked with 5% normal donkey serum for 60 min at RT. After washing, nuclei were stained with DAPI (4’,6-Diamidino-2–28 phenylindole dihydrochloride) for 10min at room temperature. Mounting media and cover slips were then added to slides for imaging. Images were acquired on a Keyence Fluorescent Microscope, and were processed with ImageJ (NIH, Bethesda, MD).
Quantitative Reverse Transcriptase-polymerase Chain Reaction (RT-PCR) Analysis
Total RNA was extracted using the RNA extraction protocol according to the manufacturer’s instructions (Zymo Research). cDNA was synthesized using SuperScript III and random hexamers. qPCR was carried out in 10 μl reactions using iTaq SYBR Green supermix on a StepOnePlus Real-Time PCR Systems (ThermoFisher Scientific). For miRNA RT-PCR, cDNA was synthesized using TaqMan™ microRNA reverse transcription kit and miRNA primers (5x). qPCR was performed using TaqMan™ universal master mix II and miRNA primers (20x) in 10 μl reactions on a StepOnePlus Real-Time PCR Systems (ThermoFisher Scientific). The data presented correspond to the mean of 2−ΔΔCt from at least three independent experiments after being normalized to β-actin or U6.
Glucose uptake assay
After 8 hr serum starvation, cells were stimulated with 100 nM insulin for 30 min in KRH buffer (137 nM NaCl, 4.8 mM KCl, 1.2 mM KH2PO4, 1.2 mM MgSO4, 2.5 mM CaCl2, 0.2% BSA, 16 mM HEPES) at 37°C. Then 3H-2-deoxy-D-glucose (3H-2-DOG, 0.1 mM, 0.4 μCi/ml) was supplemented to cells. After 10 min incubation at 37°C, cells were washed with ice-cold PBS twice. NaOH (1 N) was then added and incubated for 20 min to efficiently dissolve cells. An aliquot was used for protein concentration measurement. After neutralizing NaOH by adding HCl (1 N), the extracts were transferred to scintillation vials, and scintillation fluid was added and the radioactivity was counted. Results were normalized with protein concentration of cell lysates.
Glucose output assay
After 6 hr serum starvation, primary hepatocytes were washed twice and then exposed to glucose-free buffer (10 mM HEPES, 4 mM KCl, 125 mM NaCl, 0.85 mM KH2PO4, 1.25 mM Na2HPO4, 1 mM CaCl2, and 15 mM NaHCO3) containing glucagon (200 ng/ml), insulin (10 nM), or a combination of glucagon and insulin for 4 hours, at 37°C. Glucose production was determined by the measurement of glucose in the media. The primary hepatocytes attached the culture plate were dissolved by adding NaOH (1 N) and protein content was determined. The glucose results were normalized with protein concentration of cell lysates.
Western blot analysis
Cells or tissues were homogenized in RIPA buffer supplemented with protease and phosphatase inhibitors. Equal amounts of cell lysate proteins (30 μg protein per lane for pAKT detection) from each biological replicate were subjected to western blotting. Using ChemiDoc XRS imaging system (BioRad), the protein bands on blots were detected with the SuperSignal West Pico Chemiluminescent Substrate. Protein bands were analyzed using Image Lab software (BioRad). Western blot data in figures and supplemental figures are all representative of more than three independent experiments.
RNA-seq library preparation and sequencing
Total RNA was isolated from 3T3-L1 adipocytes treated with the miR-690 mimic using the Zymo Direct-Zol MiniPrep kit. RNA purity was assessed by an Agilent 2100 Bioanalyzer. Sequencing libraries were prepared using a TruSeq Stranded mRNA Library Prep Kit (Illumina) according to the manufacturer’s protocol. Samples were ligated to unique adaptors and subjected to PCR amplification. Libraries were then validated using an Agilent 2100 Bioanalyzer, normalized, and pooled for sequencing. RNA-seq libraries prepared from four biological replicates for each group as indicated were sequenced on an Illumina HiSeq 4000 using barcoded multiplexing.
miR-690 target gene prediction and validation
miR-690 target gene prediction was conducted with TargetScan Mouse 7.2 (www.targetscan.org) (Agarwal et al., 2015). To validate that Nadk is a genuine target gene of miR-690, the luciferase reporter assay was carried out with 3’ untranslated regions of Nadk containing potential WT or mutated miR-690 binding sites inserted downstream from the Renilla luciferase gene. The reporter constructs were cotransfected with miR-690 mimic or negative mimic control into HEK293 cells. After 24 hours cotransfection, the activities of Renilla luciferase were measured with the Dual-Glo luciferase reporter system.
QUANTIFICATION AND STATISTICAL ANALYSIS
Blinding was performed whenever deemed to be appropriate and applicable. Sample description and identification was unavailable to the core personnel during data plotting and analyses. No samples or data were excluded from the study for statistical purposes. Each in vitro experiment was independently performed with duplicate or triplicate to ensure reproducibility. Group sizes of 5 mice or above were sufficient to reach a statistical power of at least 80%. Mice were assigned at random to treatment groups for all mouse studies. Tests used for statistical analyses are described in the figure legends. The sample numbers are mentioned in the figure legends. To assess whether the means of two groups are statistically different from each other, unpaired two-tailed Student’s t-test was used for statistical analyses, all data passed the normality test using Prism8 software (GraphPad software v8.0; Prism, La Jolla, CA). P values of 0.05 or less were considered to be statistically significant. Degrees of significance were indicated in the figure legends. For the results of glucose and insulin tolerance tests, statistical comparisons between every two groups at each time point were performed with unpaired two-tailed Student’s t-test.
Supplementary Material
KEY RESOURCES TABLE
| REAGENT or RESOURCE | SOURCE | IDENTIFIER |
|---|---|---|
| Antibodies | ||
| Anti-TSG101 | ThermoFisher Scientific | Cat# MA1–23296 (1:1000 dilution) |
| Anti-CD63 | ABclonal | Cat# A5271 (1:1000 dilution) |
| Anti-syntenin 1 | ThermoFisher | Cat# PA5–28826 (1:1000 dilution) |
| Anti-GAPDH | Cell signaling technology | Cat# 2118S (1:2000 dilution) |
| Anti-Dicer | ThermoFisher | Cat# MA5–7595 (1:1000 dilution) |
| Anti-Phospho-AKT Ser473 | Cell signaling technology | Cat# 9271S (1:1000 dilution) |
| Anti-pan AKT | Cell signaling technology | Cat# 4691S (1:2000 dilution) |
| Chemicals, Peptides, and Recombinant Proteins | ||
| Live/Dead Fixable Aqua dead cell stain kit | ThermoFisher | Cat# L34966 |
| Novolin R regular human insulin used in ITTs | Novo-Nordisk | Cat# NDC 0169-1833-11 |
| Insulin used in glucose uptake and hepatic glucose production assays | Sigma-Aldrich | Cat# I9278 |
| Glucagon | Sigma-Aldrich | Cat# G2044–1MG |
| Dextrose | Hospira, Inc | Cat# 0409-6648-02 |
| 3H-glucose | Perkin Elmer | Cat# NET331C001MC |
| Collagenase II | Sigma-Aldrich | Cat# C2674 |
| Percoll | GE Healthcare Life Sciences | Cat# 17-0891-01 |
| TRIzol RNA isolation reagent | ThermoFisher Scientific | Cat# 15596026 |
| SuperSignal West Pico Chemiluminescent Substrate | ThermoFisher Scientific | Cat# 34077 |
| Halt Protease and Phosphatase Inhibitor Cocktail | ThermoFisher Scientific | Cat# 78440 |
| RIPA buffer (10x) | Cell Signaling Technology | Cat# 9806 |
| PKH26 | Sigma-Aldrich | Cat# PKH26GL-1KT |
| 60% high fat diet | Research Diets | Cat# D12492 |
| Collagenase H | Roche | Cat# 11249002001 |
| RBC lysis buffer | eBioscience | Cat# 00-4333-57 |
| High-capacity cDNA reverse transcription kit | ThermoFisher Scientific | Cat# 4368813 |
| iTaq SYBR Green supermix | Bio-Rad | Cat# 172–5125 |
| Exosome-depleted FBS | SBI | Cat# EXO-FBSHI-50A-1 |
| Invivofectamine | ThermoFisher Scientific | Cat# IVF3005 |
| Lipofectamine RNAiMAX reagent | ThermoFisher Scientific | Cat# 13778–075 |
| X-tremeGENE HP DNA transfection reagent | Roche | Cat# 6366236001 |
| TaqMan™ microRNA reverse transcription kit | ThermoFisher Scientific | Cat#4366597 |
| TaqMan™ universal master mix II | ThermoFisher Scientific | Cat#4440040 |
| Recombinant murine IL4 | Peprotech | Cat# 214–14 |
| Recombinant murine IL13 | Peprotech | Cat# 210–13 |
| Critical Commercial Assays | ||
| Direct-zol microprep kit | Zymo research | Cat# R2060 |
| Quick-RNA microprep kit | Zymo research | Cat#R1051 |
| Glucose colorimetric assay kit | Cayman | Cat# 10009582 |
| Insulin ELISA kit | ALPCO | Cat# 80-INSHU-E01.1 |
| Dual-Glo® Luciferase Assay System | Promega | E2920 |
| Akt(pS473)+total Akt ELISA kit | Abcam | Cat# ab126433 |
| TruSeq Stranded mRNA Library Prep Kit | Illumina | Cat# 20020594 |
| Experimental Models: Cell Lines | ||
| 3T3-L1 cell line | ATCC | CRL-11506 |
| HEK293 cell line | ATCC | CRL-11268 |
| Deposited Data | ||
| RNA seq data | GEO database | GSE149610 |
| Experimental Models: Organisms/Strains | ||
| Mouse: WT C57BL6/J | Jackson Laboratories | JAX: 000664 |
| Mouse: Dicer flox/flox | Jackson Laboratories | JAX: 006366 |
| Mouse: LysMcre | Jackson Laboratories | JAX: 004781 |
| Oligonucleotides | ||
| Actb forward | Integrated DNA Technologies | GGCTGTATTCCCCTCCATCG |
| Actb reverse | Integrated DNA Technologies | CCAGTTGGTAACAATGCCATGT |
| Nadk forward | Integrated DNA Technologies | TCATGGGGATGAGACCTGGAG |
| Nadk reverse | Integrated DNA Technologies | ACAAGCACACTCTTGGGAGAC |
| miR-690 RT-PCR primer | ThermoFisher Scientific | Assay ID: 001677 |
| U6 snRNA RT-PCR primer | ThermoFisher Scientific | Assay ID: 001973 |
| miR-223 RT-PCR primer | ThermoFisher Scientific | Assay ID: 007896_mat |
| miR-690 mimic | ThermoFisher Scientific | Cat# 4464066 |
| miRNA mimic negative control | ThermoFisher Scientific | Cat# 4464058 |
| Cy3-labeled miR-690 mimic | Horizon | Cat# CTM-591175 |
| Nadk 3’-UTR reporter plasmid | Genecopoeia | Cat# MmiT094456-MT06 |
| Software and Algorithms | ||
| Prism | Graphpad | https://www.graphpad.com/scientific-software/prism/ |
| FlowJo | FlowJo | |
| ImageJ | NIH | https://imagej.nih.gov/ij/ |
Highlights.
IL4/IL13-induced macrophages produce M2 Exosomes that can improve insulin resistance
miRNAs are responsible for the effects of M2 Exosomes
miR-690 is an insulin sensitizing miRNA within M2 Exosomes
The miR-690-Nadk axis regulates inflammation and insulin signaling
Acknowledgements
We thank the UCSD IGM Genomics Center for RNA sequencing and the UCSD electron microscopy core for electron microscopic analysis. This study was funded by the U.S. National Institute of Diabetes and Digestive and Kidney Diseases K99/R00 award (R00DK115998 to W.Y.) and the U.S. National Institute of Diabetes and Digestive and Kidney Diseases (DK063491 and DK101395 to J.M.O.).
Footnotes
Publisher's Disclaimer: This is a PDF file of an unedited manuscript that has been accepted for publication. As a service to our customers we are providing this early version of the manuscript. The manuscript will undergo copyediting, typesetting, and review of the resulting proof before it is published in its final form. Please note that during the production process errors may be discovered which could affect the content, and all legal disclaimers that apply to the journal pertain.
Declaration of Interests
W.Y. and J.M.O. are co-inventors on a provisional patent covering the use of miR-690 as an insulin sensitizer. Outside of this there are no competing interests for any of the authors.
References
- Agarwal V, Bell GW, Nam JW, and Bartel DP (2015). Predicting effective microRNA target sites in mammalian mRNAs. Elife 4, e05005. [DOI] [PMC free article] [PubMed] [Google Scholar]
- Bartel DP (2004). MicroRNAs: genomics, biogenesis, mechanism, and function. Cell 116, 281–297. [DOI] [PubMed] [Google Scholar]
- Bartel DP (2009). MicroRNAs: target recognition and regulatory functions. Cell 136, 215–233. [DOI] [PMC free article] [PubMed] [Google Scholar]
- Canto C, Houtkooper RH, Pirinen E, Youn DY, Oosterveer MH, Cen Y, Fernandez-Marcos PJ, Yamamoto H, Andreux PA, Cettour-Rose P, et al. (2012). The NAD(+) precursor nicotinamide riboside enhances oxidative metabolism and protects against high-fat diet-induced obesity. Cell Metab. 15, 838–847. [DOI] [PMC free article] [PubMed] [Google Scholar]
- Crewe C, Joffin N, Rutkowski JM, Kim M, Zhang F, Towler DA, Gordillo R, and Scherer PE (2018). An Endothelial-to-Adipocyte Extracellular Vesicle Axis Governed by Metabolic State. Cell 175, 695–708. [DOI] [PMC free article] [PubMed] [Google Scholar]
- den Boer MA, Voshol PJ, Schroder-van der Elst JP, Korsheninnikova E, Ouwens DM, Kuipers F, Havekes LM, and Romijn JA (2006). Endogenous interleukin-10 protects against hepatic steatosis but does not improve insulin sensitivity during high-fat feeding in mice. Endocrinology 147, 4553–4558. [DOI] [PubMed] [Google Scholar]
- Fink LN, Costford SR, Lee YS, Jensen TE, Bilan PJ, Oberbach A, Bluher M, Olefsky JM, Sams A, and Klip A (2014). Pro-inflammatory macrophages increase in skeletal muscle of high fat-fed mice and correlate with metabolic risk markers in humans. Obesity (Silver Spring) 22, 747–757. [DOI] [PubMed] [Google Scholar]
- Guay C, Kruit JK, Rome S, Menoud V, Mulder NL, Jurdzinski A, Mancarella F, Sebastiani G, Donda A, Gonzalez BJ, et al. (2019). Lymphocyte-Derived Exosomal MicroRNAs Promote Pancreatic beta Cell Death and May Contribute to Type 1 Diabetes Development. Cell Metab. 29, 348–361. [DOI] [PubMed] [Google Scholar]
- Hotamisligil GS (2017). Inflammation, metaflammation and immunometabolic disorders. Nature 542, 177–185. [DOI] [PubMed] [Google Scholar]
- Hotamisligil GS, Arner P, Caro JF, Atkinson RL, and Spiegelman BM (1995). Increased adipose tissue expression of tumor necrosis factor-alpha in human obesity and insulin resistance. J. Clin. Invest 95, 2409–2415. [DOI] [PMC free article] [PubMed] [Google Scholar]
- Hotamisligil GS, Peraldi P, Budavari A, Ellis R, White MF, and Spiegelman BM (1996). IRS-1-mediated inhibition of insulin receptor tyrosine kinase activity in TNF-alpha- and obesity-induced insulin resistance. Science 271, 665–668. [DOI] [PubMed] [Google Scholar]
- Johnson AM, and Olefsky JM (2013). The origins and drivers of insulin resistance. Cell 152, 673–684. [DOI] [PubMed] [Google Scholar]
- Kahn SE, Hull RL, and Utzschneider KM (2006). Mechanisms linking obesity to insulin resistance and type 2 diabetes. Nature 444, 840–846. [DOI] [PubMed] [Google Scholar]
- Kanda H, Tateya S, Tamori Y, Kotani K, Hiasa K, Kitazawa R, Kitazawa S, Miyachi H, Maeda S, Egashira K, et al. (2006). MCP-1 contributes to macrophage infiltration into adipose tissue, insulin resistance, and hepatic steatosis in obesity. J. Clin. Invest 116, 1494–1505. [DOI] [PMC free article] [PubMed] [Google Scholar]
- Kang K, Reilly SM, Karabacak V, Gangl MR, Fitzgerald K, Hatano B, and Lee CH (2008). Adipocyte-derived Th2 cytokines and myeloid PPARdelta regulate macrophage polarization and insulin sensitivity. Cell Metab. 7, 485–495. [DOI] [PMC free article] [PubMed] [Google Scholar]
- Katsyuba E, Romani M, Hofer D, and Auwerx J (2020). NAD+ homeostasis in health and disease. Nat. Metab 2, 9–31. [DOI] [PubMed] [Google Scholar]
- Kowal J, Arras G, Colombo M, Jouve M, Morath JP, Primdal-Bengtson B, Dingli F, Loew D, Tkach M, and Thery C (2016). Proteomic comparison defines novel markers to characterize heterogeneous populations of extracellular vesicle subtypes. Proc. Natl. Acad. Sci. USA 113, E968–977. [DOI] [PMC free article] [PubMed] [Google Scholar]
- Kratz M, Coats BR, Hisert KB, Hagman D, Mutskov V, Peris E, Schoenfelt KQ, Kuzma JN, Larson I, Billing PS, et al. (2014). Metabolic dysfunction drives a mechanistically distinct proinflammatory phenotype in adipose tissue macrophages. Cell Metab. 20, 614–625. [DOI] [PMC free article] [PubMed] [Google Scholar]
- Lackey DE, and Olefsky JM (2016). Regulation of metabolism by the innate immune system. Nat. Rev. Endocrinol 12, 15–28. [DOI] [PubMed] [Google Scholar]
- Lee YS, Wollam J, and Olefsky JM (2018). An Integrated View of Immunometabolism. Cell 172, 22–40. [DOI] [PMC free article] [PubMed] [Google Scholar]
- Li P, Liu S, Lu M, Bandyopadhyay G, Oh D, Imamura T, Johnson AMF, Sears D, Shen Z, Cui B, et al. (2016). Hematopoietic-Derived Galectin-3 Causes Cellular and Systemic Insulin Resistance. Cell 167, 973–984 e912. [DOI] [PMC free article] [PubMed] [Google Scholar]
- Li P, Oh DY, Bandyopadhyay G, Lagakos WS, Talukdar S, Osborn O, Johnson A, Chung H, Maris M, Ofrecio JM, et al. (2015). LTB4 promotes insulin resistance in obese mice by acting on macrophages, hepatocytes and myocytes. Nat. Med 21, 239–247. [DOI] [PMC free article] [PubMed] [Google Scholar]
- Lumeng CN, Bodzin JL, and Saltiel AR (2007a). Obesity induces a phenotypic switch in adipose tissue macrophage polarization. J. Clin. Invest 117, 175–184. [DOI] [PMC free article] [PubMed] [Google Scholar]
- Lumeng CN, Deyoung SM, Bodzin JL, and Saltiel AR (2007b). Increased inflammatory properties of adipose tissue macrophages recruited during diet-induced obesity. Diabetes 56, 16–23. [DOI] [PubMed] [Google Scholar]
- Mathieu M, Martin-Jaular L, Lavieu G, and Thery C (2019). Specificities of secretion and uptake of exosomes and other extracellular vesicles for cell-to-cell communication. Nat. Cell Biol 21, 9–17. [DOI] [PubMed] [Google Scholar]
- Morinaga H, Mayoral R, Heinrichsdorff J, Osborn O, Franck N, Hah N, Walenta E, Bandyopadhyay G, Pessentheiner AR, Chi TJ, et al. (2015). Characterization of distinct subpopulations of hepatic macrophages in HFD/obese mice. Diabetes 64, 1120–1130. [DOI] [PMC free article] [PubMed] [Google Scholar]
- Odegaard JI, Ricardo-Gonzalez RR, Goforth MH, Morel CR, Subramanian V, Mukundan L, Red Eagle A, Vats D, Brombacher F, Ferrante AW, et al. (2007). Macrophage-specific PPARgamma controls alternative activation and improves insulin resistance. Nature 447, 1116–1120. [DOI] [PMC free article] [PubMed] [Google Scholar]
- Ogden CL, Carroll MD, Lawman HG, Fryar CD, Kruszon-Moran D, Kit BK, and Flegal KM (2016). Trends in Obesity Prevalence Among Children and Adolescents in the United States, 1988–1994 Through 2013–2014. JAMA 315, 2292–2299. [DOI] [PMC free article] [PubMed] [Google Scholar]
- Phinney DG, Di Giuseppe M, Njah J, Sala E, Shiva S, St Croix CM, Stolz DB, Watkins SC, Di YP, Leikauf GD, et al. (2015). Mesenchymal stem cells use extracellular vesicles to outsource mitophagy and shuttle microRNAs. Nat. Commun 6, 8472. [DOI] [PMC free article] [PubMed] [Google Scholar]
- Phinney DG, and Isakova IA (2014). Mesenchymal stem cells as cellular vectors for pediatric neurological disorders. Brain Res. 1573, 92–107. [DOI] [PMC free article] [PubMed] [Google Scholar]
- Qiu Y, Nguyen KD, Odegaard JI, Cui X, Tian X, Locksley RM, Palmiter RD, and Chawla A (2014). Eosinophils and type 2 cytokine signaling in macrophages orchestrate development of functional beige fat. Cell 157, 1292–1308. [DOI] [PMC free article] [PubMed] [Google Scholar]
- Rajbhandari P, Thomas BJ, Feng AC, Hong C, Wang J, Vergnes L, Sallam T, Wang B, Sandhu J, Seldin MM, et al. (2018). IL-10 Signaling Remodels Adipose Chromatin Architecture to Limit Thermogenesis and Energy Expenditure. Cell 172, 218–233 e217. [DOI] [PMC free article] [PubMed] [Google Scholar]
- Roden M, and Shulman GI (2019). The integrative biology of type 2 diabetes. Nature 576, 51–60. [DOI] [PubMed] [Google Scholar]
- Romeo GR, Lee J, and Shoelson SE (2012). Metabolic syndrome, insulin resistance, and roles of inflammation--mechanisms and therapeutic targets. Arterioscler. Thromb. Vasc. Biol 32, 1771–1776. [DOI] [PMC free article] [PubMed] [Google Scholar]
- Saltiel AR, and Olefsky JM (2017). Inflammatory mechanisms linking obesity and metabolic disease. J. Clin. Invest 127, 1–4. [DOI] [PMC free article] [PubMed] [Google Scholar]
- Saraiva M, and O’Garra A (2010). The regulation of IL-10 production by immune cells. Nat. Rev. Immunol 10, 170–181. [DOI] [PubMed] [Google Scholar]
- Stromsdorfer KL, Yamaguchi S, Yoon MJ, Moseley AC, Franczyk MP, Kelly SC, Qi N, Imai S, and Yoshino J (2016). NAMPT-Mediated NAD(+) Biosynthesis in Adipocytes Regulates Adipose Tissue Function and Multi-organ Insulin Sensitivity in Mice. Cell Rep. 16, 1851–1860. [DOI] [PMC free article] [PubMed] [Google Scholar]
- Suarez H, Gamez-Valero A, Reyes R, Lopez-Martin S, Rodriguez MJ, Carrascosa JL, Cabanas C, Borras FE, and Yanez-Mo M (2017). A bead-assisted flow cytometry method for the semi-quantitative analysis of Extracellular Vesicles. Sci. Rep 7, 11271. [DOI] [PMC free article] [PubMed] [Google Scholar]
- Thomou T, Mori MA, Dreyfuss JM, Konishi M, Sakaguchi M, Wolfrum C, Rao TN, Winnay JN, Garcia-Martin R, Grinspoon SK, et al. (2017). Adipose-derived circulating miRNAs regulate gene expression in other tissues. Nature 542, 450–455. [DOI] [PMC free article] [PubMed] [Google Scholar]
- Tiemessen MM, Jagger AL, Evans HG, van Herwijnen MJ, John S, and Taams LS (2007). CD4+CD25+Foxp3+ regulatory T cells induce alternative activation of human monocytes/macrophages. Proc. Natl. Acad. Sci. USA 104, 19446–19451. [DOI] [PMC free article] [PubMed] [Google Scholar]
- Van Dyken SJ, and Locksley RM (2013). Interleukin-4- and interleukin-13-mediated alternatively activated macrophages: roles in homeostasis and disease. Annu. Rev. Immunol 31, 317–343. [DOI] [PMC free article] [PubMed] [Google Scholar]
- Weisberg SP, McCann D, Desai M, Rosenbaum M, Leibel RL, and Ferrante AW Jr. (2003). Obesity is associated with macrophage accumulation in adipose tissue. J. Clin. Invest 112, 1796–1808. [DOI] [PMC free article] [PubMed] [Google Scholar]
- Whitham M, Parker BL, Friedrichsen M, Hingst JR, Hjorth M, Hughes WE, Egan CL, Cron L, Watt KI, Kuchel RP, et al. (2018). Extracellular Vesicles Provide a Means for Tissue Crosstalk during Exercise. Cell Metab. 27, 237–251 e234. [DOI] [PubMed] [Google Scholar]
- Wu D, Molofsky AB, Liang HE, Ricardo-Gonzalez RR, Jouihan HA, Bando JK, Chawla A, and Locksley RM (2011). Eosinophils sustain adipose alternatively activated macrophages associated with glucose homeostasis. Science 332, 243–247. [DOI] [PMC free article] [PubMed] [Google Scholar]
- Xu X, Grijalva A, Skowronski A, van Eijk M, Serlie MJ, and Ferrante AW Jr. (2013). Obesity activates a program of lysosomal-dependent lipid metabolism in adipose tissue macrophages independently of classic activation. Cell Metab. 18, 816–830. [DOI] [PMC free article] [PubMed] [Google Scholar]
- Ying W, Cheruku PS, Bazer FW, Safe SH, and Zhou B (2013). Investigation of macrophage polarization using bone marrow derived macrophages. J. Vis. Exp 76, 50323. [DOI] [PMC free article] [PubMed] [Google Scholar]
- Ying W, Riopel M, Bandyopadhyay G, Dong Y, Birmingham A, Seo JB, Ofrecio JM, Wollam J, Hernandez-Carretero A, Fu W, et al. (2017). Adipose Tissue Macrophage-Derived Exosomal miRNAs Can Modulate In Vivo and In Vitro Insulin Sensitivity. Cell 171, 372–384. [DOI] [PubMed] [Google Scholar]
- Yoshino J, Baur JA, and Imai SI (2018). NAD(+) Intermediates: The Biology and Therapeutic Potential of NMN and NR. Cell Metab. 27, 513–528. [DOI] [PMC free article] [PubMed] [Google Scholar]
- Yoshino J, Mills KF, Yoon MJ, and Imai S (2011). Nicotinamide mononucleotide, a key NAD(+) intermediate, treats the pathophysiology of diet- and age-induced diabetes in mice. Cell Metab. 14, 528–536. [DOI] [PMC free article] [PubMed] [Google Scholar]
- Zhang Y, Shi L, Mei H, Zhang J, Zhu Y, Han X, and Zhu D (2015). Inflamed macrophage microvesicles induce insulin resistance in human adipocytes. Nutr. Metab. (Lond) 12, 21. [DOI] [PMC free article] [PubMed] [Google Scholar]
Associated Data
This section collects any data citations, data availability statements, or supplementary materials included in this article.
Supplementary Materials
Data Availability Statement
The RNA-seq data have been deposited in the NCBI Gene Expression Omnibus under accession number GSE149610.