Abstract
The genome-wide protein architecture of chromatin that maintains chromosome integrity and gene regulation is ill-defined. Here we use ChIP-exo/seq1,2 to define this structure in Saccharomyces. We identified 21 ensembles consisting of ~400 different proteins related to DNA replication, centromeres, subtelomeres, transposons, and RNA polymerase (Pol) I, II, and III transcription. Replication proteins engulfed a nucleosome, centromeres lacked a nucleosome, and repressive proteins encompassed three nucleosomes at subtelomeric X-elements. We find that most Pol II promoters evolved to lack a regulatory region, having only a core promoter. These constitutive promoters comprised a short nucleosome-free region (NFR) adjacent to a +1 nucleosome, which together bound TFIID to form a preinitiation complex (PIC). Positioned insulators protected core promoters from upstream events. A small fraction of promoters were architected for inducibility, wherein sequence-specific transcription factors (TFs) create a nucleosome-depleted region (NDR) that is distinct from NFRs. We describe TF structural interactions with the genome and cognate cofactors, including nucleosomal and transcriptional regulators RPD3-L, SAGA, NuA4, Tup1, Mediator, and SWI-SNF. Surprisingly, we do not detect TF-TFIID interactions, suggesting that they do not stably occur. Our model for gene induction involves TFs, cofactors, and general factors like TBP and TFIIB, but not TFIID. However, constitutive transcription involves TFIID but not TFs and cofactors. From this we define a highly integrated network of TF-regulated transcription.
Genomes regulate genes so as to achieve homeostasis – the maintenance of cellular components in proper balance. They also adapt – making adjustments in rapidly changing environments, so as to regain homeostasis3. Achieving these tasks has necessitated the evolution of constitutive and inducible gene control. Whether these controls are fundamentally different at the molecular level is unknown. A classical view posits a single basic regulatory paradigm for genes (Extended Data Fig. 1a)4. Environmental signals toggle “on” TFs that recruit cofactors, and assemble a PIC consisting of Pol II and general factors (GTFs) like TBP, TFIID, and TFIIB at core promoter transcription start sites (TSS)5. The extent to which constitutive gene expression involves TFs is unclear, as TF binding sites and their cofactors remain unidentified at most promoters. TFs, cofactors, chromatin, and PICs play into any distinction between inducible and constitutive mechanisms, but their inter-relationships remain enigmatic.
Genome-wide protein meta-assemblages
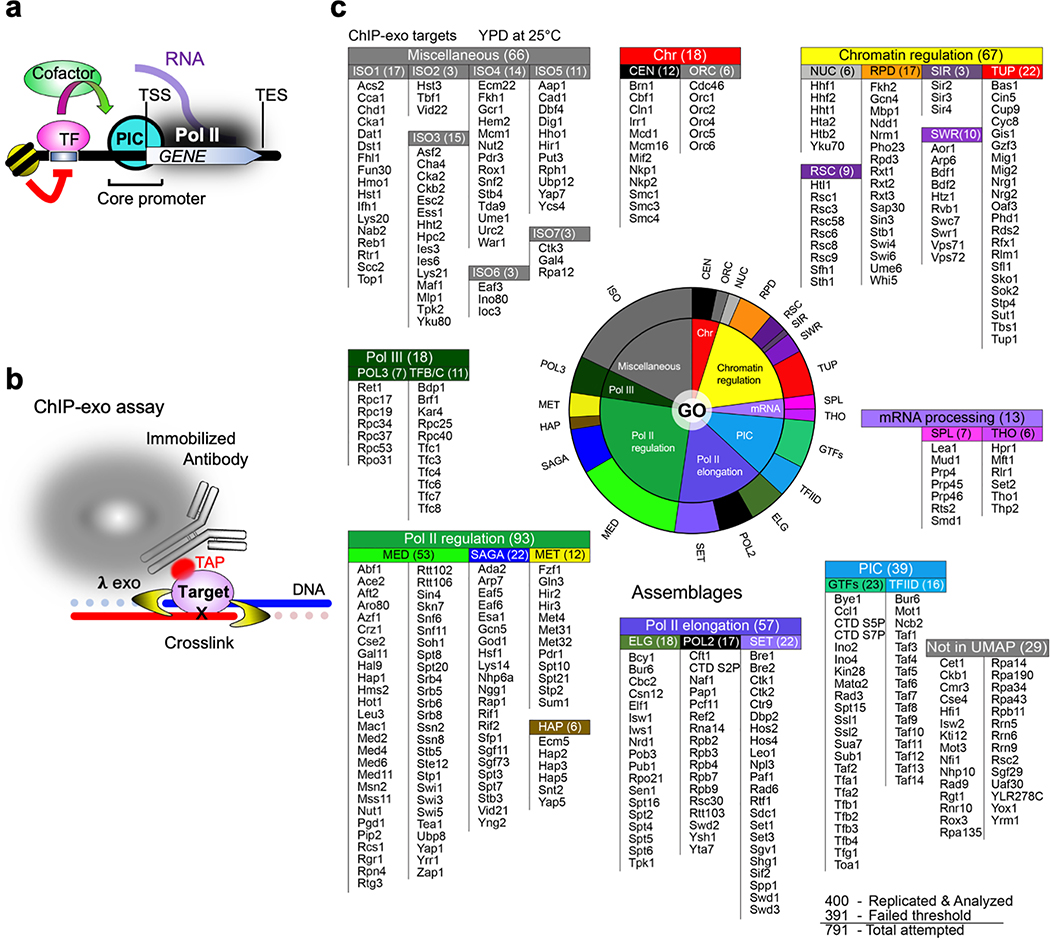
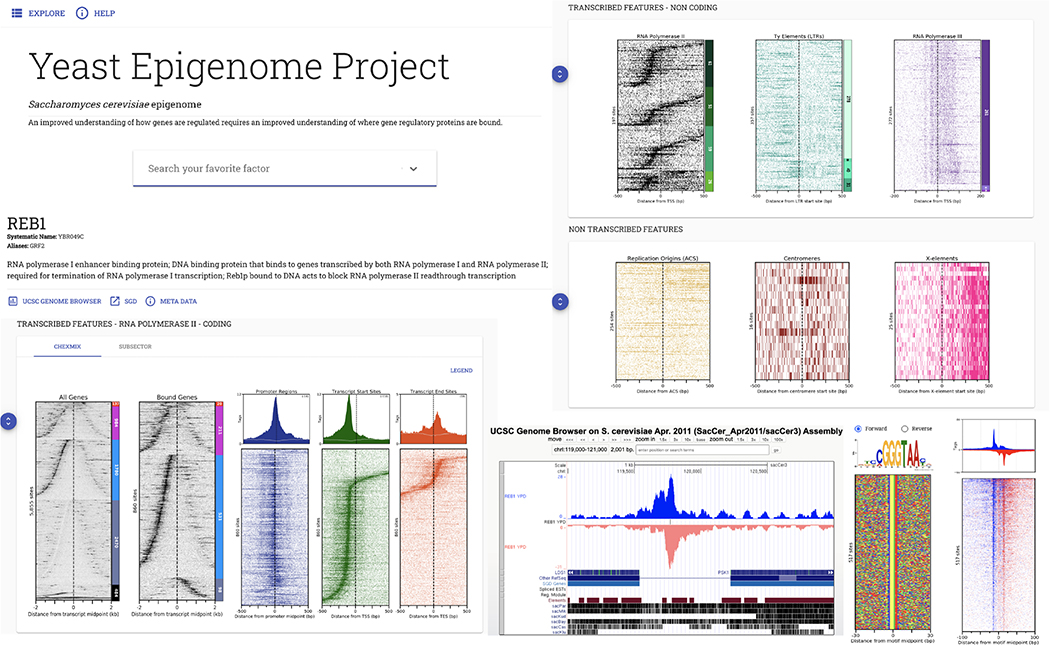
We utilized ChIP-exo (Extended Data Fig. 1b)1,2, an ultra-high resolution version of ChIP-seq, to map genome-wide binding. Targets proteins were selected based on Gene Ontology (GO) annotations related to chromosomal function (Extended Data Fig. 1c and Supplementary Data11BY, subscript denotes worksheet number and column letter). In total 1,229 datasets were collected on 791 targets, from which 400 targets had reproducibly significant data (Supplementary Data 21A). The interaction pattern of all 1,229 datasets around individual and broad classes of genomic features (Fig. 1a) can be visualized and downloaded at yeastepigenome.org (e.g., Extended Data Fig. 2). We also developed and provide ScriptManager, a platform for customized analysis of this data (see Methods).
Fig. 1 |. Genome-wide meta-assemblages.
a, Genomic feature classes with N memberships analyzed (Supplementary Data 11D). Pol II classes are from this study along with relative PIC occupancy levels (•). b, Hierarchical clustering of genome-wide co-localization of 371 targets (Supplementary Data 3). c, UMAP projection of 371 target co-locations (colored based on K-means, Supplementary Data 21C,D).
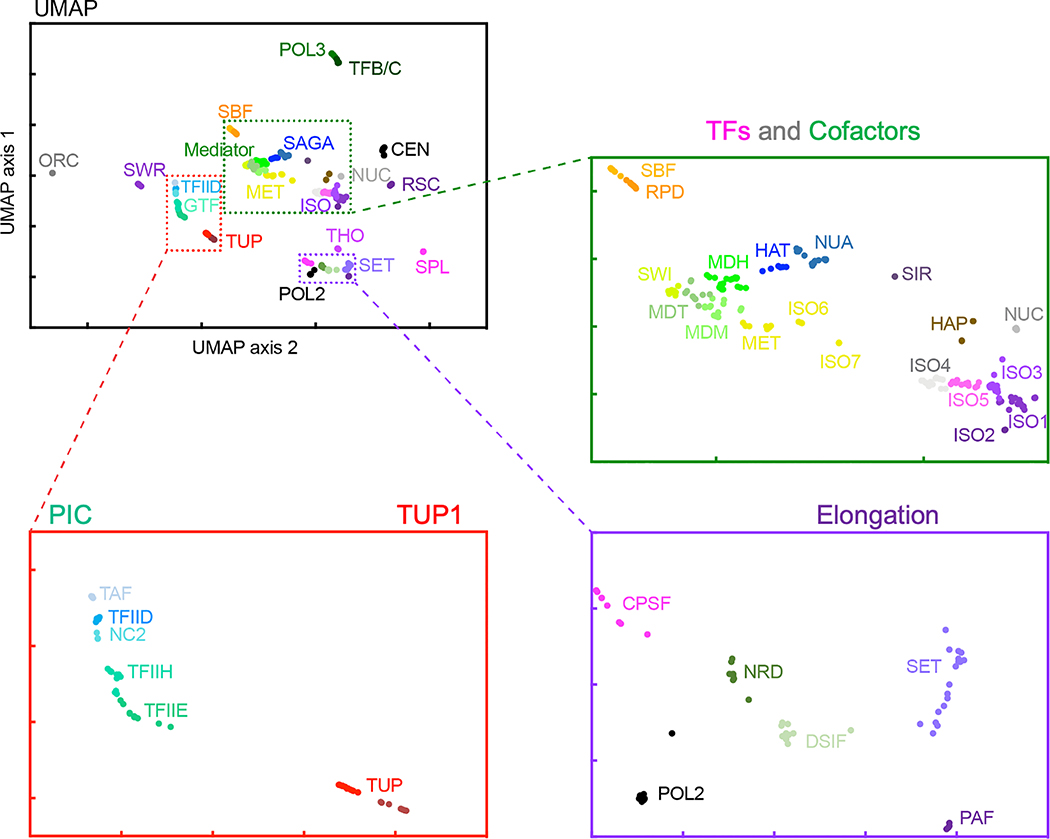
Binarized co-location counts among targets were hierarchically clustered (Fig. 1b). The three largest clusters (yellow) corresponded to three major aspects of gene expression: 1) promoter regulation, 2) PIC assembly, and 3) transcription elongation. Thus, the vast majority of chromatin proteins are dedicated to gene regulation. We used UMAP to represent each dataset as a single point in a 2D projection (Fig. 1c and Extended Data Fig. 3). Points in close proximity reflect a population-based composite co-localization of targets (“meta-assemblages”). We performed K-means clustering on the projection and derived 21 meta-assemblages that largely corresponded to known interacting biochemical complexes, or related gene ontologies (Fig. 1c, outer pie and Supplementary Data 2(1F,H)(2G,H)(2I)). This likely represents a comprehensive predominant protein architecture of the yeast genome (“epigenome”) in rich media (deeper analysis in Supplementary Data 21–8).
Overall, the organization defined by UMAP represents a remarkable degree of concordance and mutual validation of biochemically purified and functionally annotated complexes with their architectural organization across a genome, particularly from an unsupervised approach. For example, promoter cofactors Mediator, SWI-SNF, SAGA, NuA4, and their cognate TFs each formed tight meta-assemblages that were located near each other but far from gene-body elongation factors (Fig. 1c). Proteins of replication origins, sub-telomeres, and centromeres also formed distinct tight meta-assemblages that were far from each other and from gene meta-assemblages. This provided strong validation of the ChIP-exo/seq approach and epitope-tagging. Importantly, we can now link most TFs with their cognate cofactors and promoter architecture.
Protein architecture at genomic features
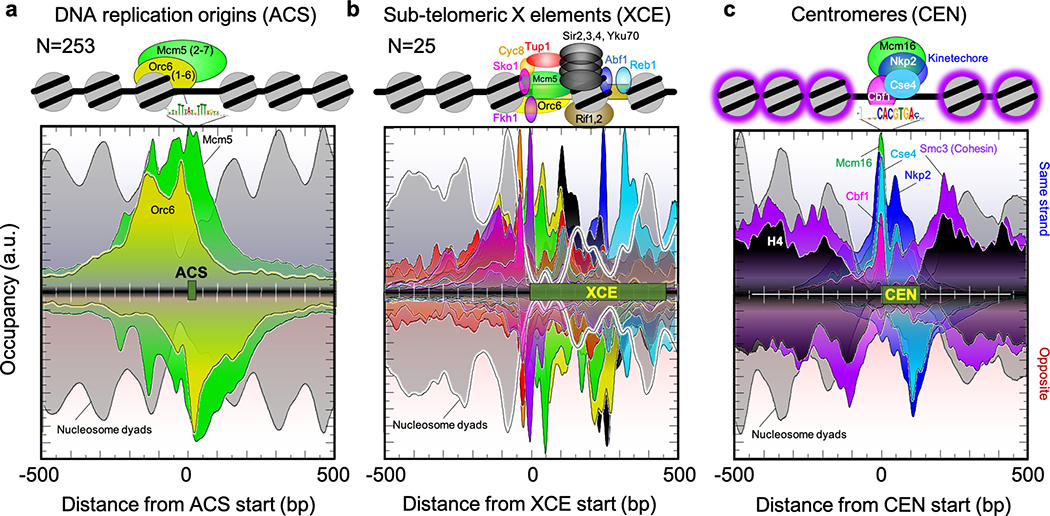
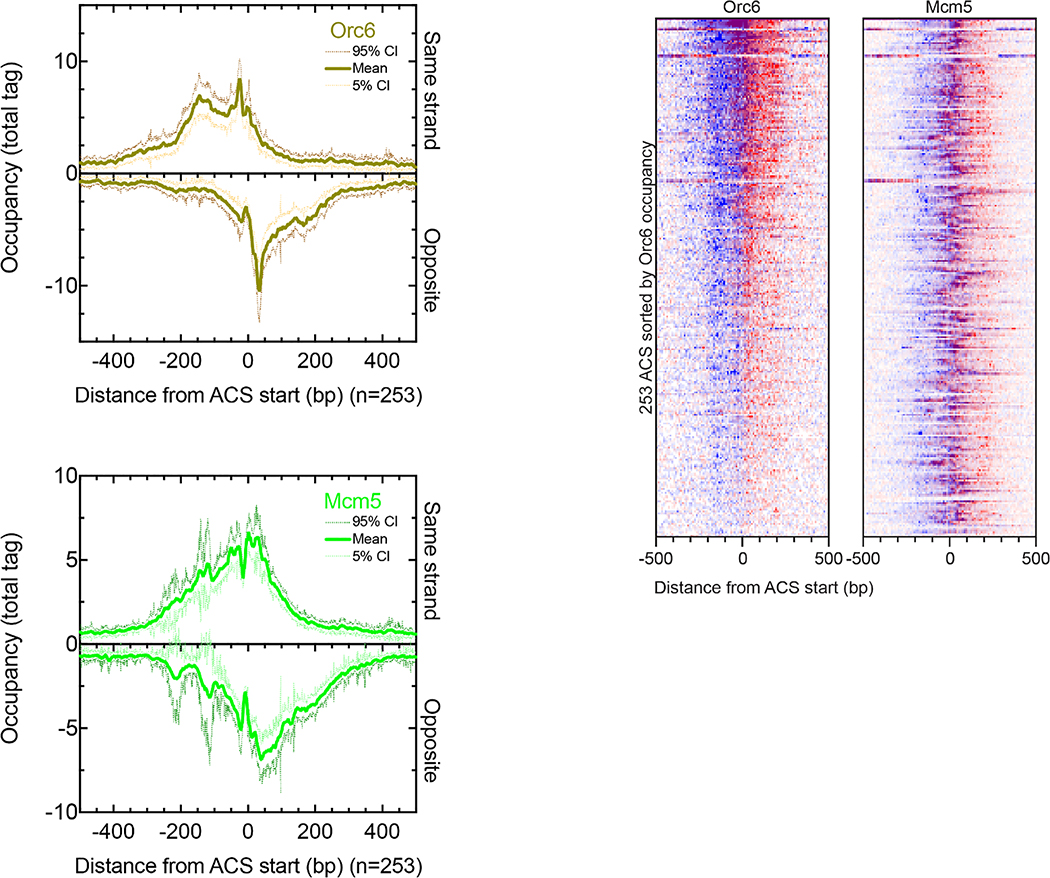
DNA replication initiates at 253 ACS elements that are constitutively bound by origin recognition complexes (ORC)6. The “ORC” meta-assemblage contained six measured targets (Fig. 2a and Extended Data Fig. 4), most of which gave highly-structured ORC and MCM DNA helicase ChIP-exo patterns spread over ~300 bp. ORCs at nucleosome-free ACSs engulfed a neighboring nucleosome. The 50–100 bp offset of Mcm5 binding from ORC is consistent with a recent cryo-EM based model7.
Fig. 2 |. Architecture at nontranscribed features.
a-c, Averaged distribution of strand-separated ChIP-exo tag 5’ ends (exonuclease stop sites, left to right is 5’−3’) for representative targets around strand-oriented annotated features. Opposite-strand data are inverted (right to left is 5’−3’). The Y-axes are linear arbitrary units (a.u.), which are not comparable in magnitude across different datasets. Nucleosome dyads are H3 MNase paired-end ChIP-seq (strands averaged).
Subtelomeric X-elements represent a SIR-repressive heterochromatic environment that functionally supports telomeres8. Indeed, SIR proteins formed a structurally robust meta-assemblage on a single nucleosome centered on ~300 bp X core elements (XCE), along with ORC/MCM and insulator TFs at two flanking nucleosomes (Fig. 2b). KU (Yku70) and RIF (Rif1) complexes, along with TFs Fkh1, Abf1, and Reb1 were present at the vast majority of mappable X-elements. A Sko1-mediated Tup1 repression complex was present at only half, perhaps reflecting variable repression capabilities of subtelomeric regions. Thus, XCE appear to create a well-structured triple nucleosome ensemble comprised of major repressor proteins.
The centromeric “CEN” meta-assemblage contained 12 targets at 16 centromeres (Fig. 2c), which are responsible for proper chromosomal segregation during cell division. They included site-specifically bound Cbf1 at the centromere center (CDE I) and kinetochore components offset by ~100 bp towards the AT-rich CDE III elements9. These factors generated strong and well-positioned crosslinks covering ~170 bp of DNA, suggesting they are positionally fixed to CDEs. Condensin and cohesin play a role in chromosomal condensation and segregation. They were absent at the centromere and instead overlapped the surrounding nucleosomes, suggesting they interact with nucleosomes. In contrast to lower resolution maps10,11, we did not detect histones at centromeres, despite robust detection of histone-like Cse4 and kinetochore components there, and robust detection of histones (H2A, H2A.Z, H2B, H3, H4) in the immediate flanking regions12. Thus, yeast centromeres appear to lack the histone components of a nucleosome in vivo. The resident kinetochore complex protects a nucleosome-sized region of DNA from nucleases, which was a basis for a nucleosome originally being called there13. Nonetheless, Cse4-containing nucleosomes have been defined biochemically and structurally in vitro10,14, and so the question remains open.
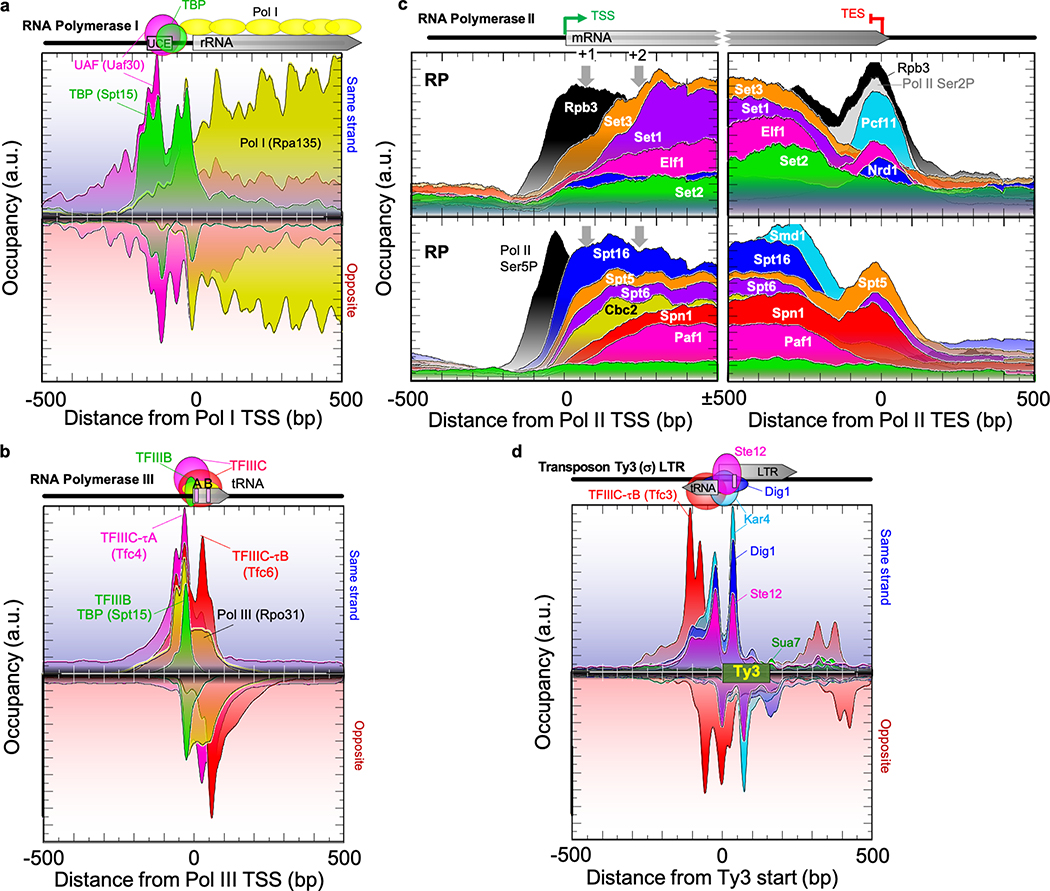
The Pol I complex produces ribosomal RNA (rRNA) from a single highly-repeated gene. It contained TBP anchored near the rRNA TSS (Fig. 3a). It also had major crosslinking interactions with the well-positioned Pol I-specific upstream activating factor (UAF, Uaf30) complex that covered ~70 bp between −155 and −60 bp from the TSS. UAF also had reciprocal crosslinks with TBP at the core promoter. Thus, the Pol I initiation complex has a fixed bipartite engagement covering ~200 bp of rRNA promoter DNA, with an intervening ~100 bp. The broad extension of Pol I downstream into the rRNA gene body with less occupancy at promoters indicates that Pol I dissociates rapidly from its PIC into an elongating state.
Fig. 3 |. Architecture at transcribed features.
a-d, See Fig. 2. c, Panels are for ribosomal protein genes (RP), showing only the sense strand. Gray arrows are nucleosome dyads.
Pol III of the “POL3” meta-assemblage transcribes ~275 highly similar tRNA genes. It contained 18 targets that could be separated into TFIIIB/C and Pol III meta-assemblages (Fig. 3b). Their organization matched locations modeled from atomic structures of the TFIIIB/Pol III promoter complex15, but with the TBP component of TFIIIB crosslinking ~30 bp upstream of the TSS. The ChIP-exo pattern further demonstrated that TFIIIC and Pol III make crosslinks not only at the internal A and B boxes, but also at co-incident locations ~40 bp upstream of TBP. Due to DNA bending by TBP, this region is in close proximity to TFIIIB/C and Pol III within gene bodies. Equivalent positions of crosslinking points were observed across all TFIIIB/C/Pol III subunits. This suggests a single predominant structure envelopes entire Pol III genes and ~70 bp upstream, as it makes a short (~80 bp) transcript.
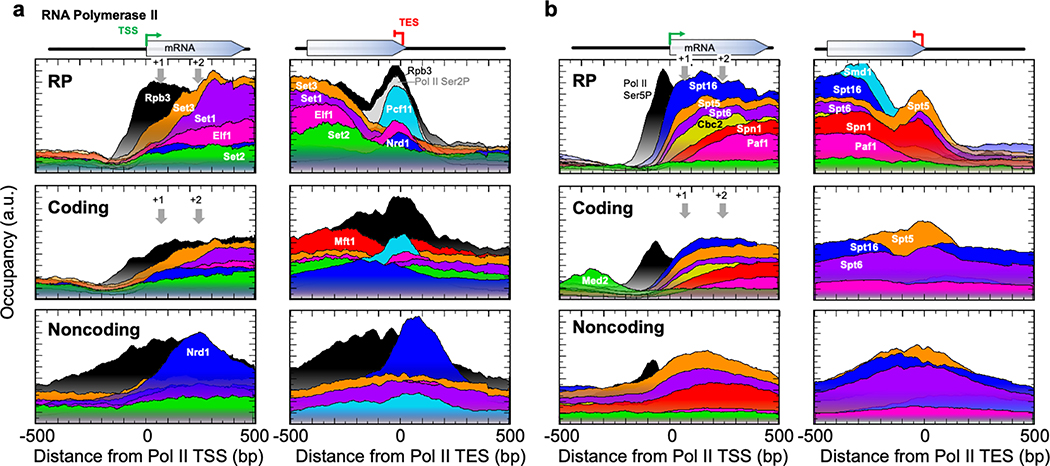
There are ~7,500 distinct Pol II-transcription units (defined by a TSS/PIC), of which ~80% code for proteins. Targets that are associated with transcription elongation generally matched Pol II occupancy across gene bodies, but unlike Pol II (Rpb3), were not present at promoters (Fig. 3c and Extended Data Fig. 5). Instead, occupancy within genes increased in the 5’ region and decreased in the 3’ region, with many having distinct “entry/exit” points, consistent with other studies16. Whether these are true co-transcriptional entry/exit points or are simply crosslinkable retention sites is not clear. Termination factors like Pcf11 were primarily at sites of termination. There was little evidence of elongation/termination-associated factors binding being restricted to specific sets of genes, except that the Nrd1 early termination pathway was enriched at noncoding transcription (ncRNA) units (Extended Data Fig. 5a, lower left). Also, splicing factors (e.g., Smd1) were largely limited to RP genes (Extended Data Fig. 5b, upper right). The data are consistent with one predominant elongation entourage at most pol II genes that changes in composition at fixed distances from the TSS/TES (rather than at a percentage of gene length).
Consistent with other reports17,18, albeit disparate19–21, we found no evidence for Mediator being stably associated with the Pol II core initiation or elongation entourage, despite its detection in upstream promoter regulatory regions (e.g., Med2 in Extended Data Fig. 5b). Disparate gene body binding may be related to ~100 genes that produced relatively high and variable background (see Methods).
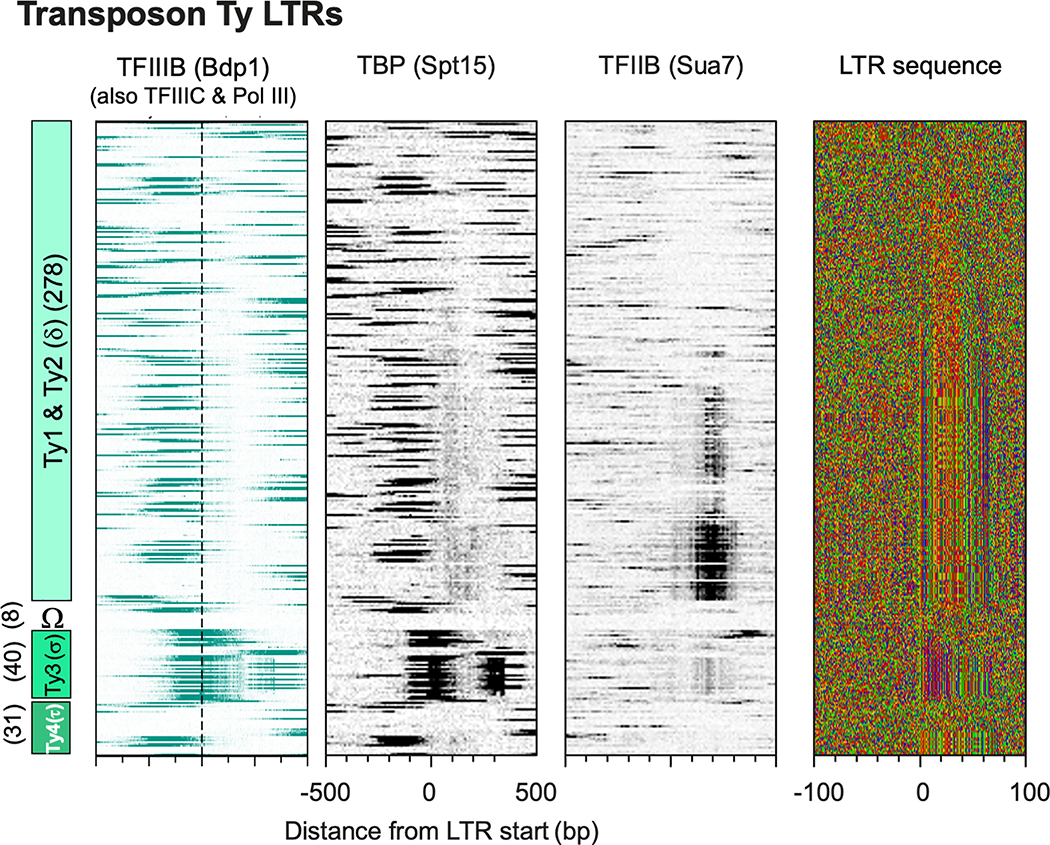
The long terminal repeats (LTRs) of certain classes of Ty transposons are transcribed by Pol II as part of retroviral-like transposition22. However, most lacked a PIC, except a subset of full-length Ty1,2 (delta) (Extended Data Fig. 6). At Ty3 (sigma), the Pol II pheromone factors Ste12, Dig1, and Kar4 were assembled and had nearly identical points of crosslinking (Fig. 3d). However, instead of Pol II, we detected the Pol III machinery associated with adjacent divergent tRNA genes. This suggests that Pol II TFs may work with Pol III at some tRNA genes to integrate mating and Ty3 transposition22.
Inducible vs constitutive promoters
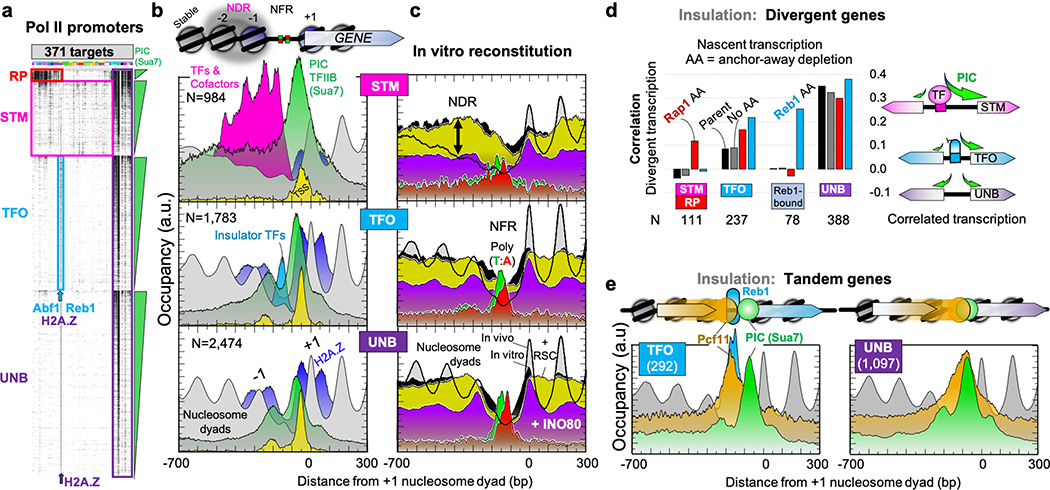
In examining Pol II promoters, we opted against an unsupervised approach, as it treats binding events equivalently, without consideration that certain targets play a more central role in defining specific regulatory architectures. Four fundamentally distinct architectural themes emerged (see Methods, Fig. 4a, and Supplementary Data 11D): 1) RP, from 137 ribosomal protein promoters having a unique architecture (examined separately23); 2) STM, from 984 promoters that had properties associated with inducibility, and characteristically bound by TFs and major cofactor meta-assemblages SAGA, TUP, and/or Mediator/SWI-SNF; 3) TFO, from 1,783 promoters with a TF organization that lacked STM cofactors (but typically had Abf1 or Reb1 insulator TFs); and 4) UNB, from 2,474 promoters that were unbound by anything except a PIC. Remarkably, as detailed in Supplementary Information, the consensus architecture at TFO/UNB promoters indicates that two-thirds of all promoters evolved to lack TF/cofactor regulation under any condition (not just in rich media). This is an architecture suitable for constitutively low gene expression. RP and STM represent the architecture of inducible promoters that have upstream activator sequences (UAS). The ~1,300 ncRNA promoters were similarly classified (Supplementary Data 1E), indicating that they are governed by the same regulatory mechanisms.
Fig. 4 |. Classification of inducible, insulated, and constitutive Pol II promoters.
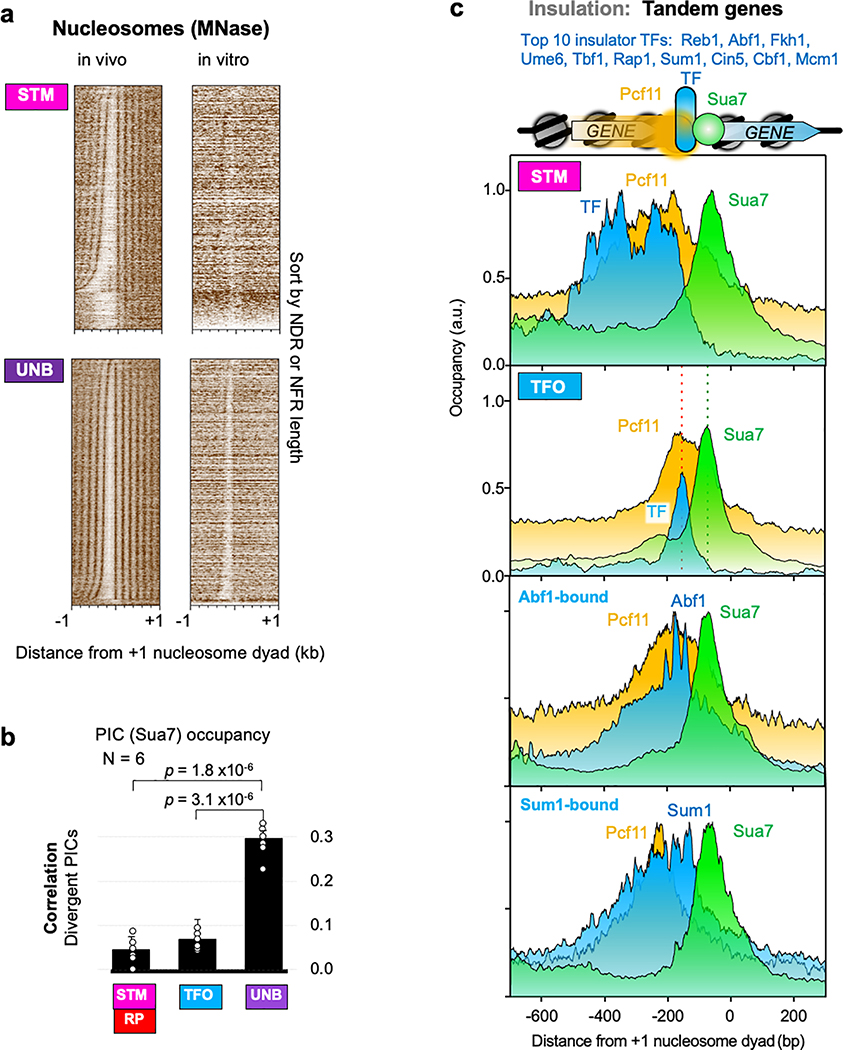
a, Four architectural themes at individual promoters (rows), with black denoting target (columns) binding (Supplementary Data 23). b, Schematic and example composite data for STM, TFO, and UNB classes. “TFs & Cofactors” are a combined set of ChExMix calls for targets labeled as such in Supplementary Data 21K, including TFs, SAGA, TUP, and Mediator. c, STM promoters have NDRs, while TFO/UNB have NFRs. In vitro nucleosomes assembled with purified genomic DNA and histones (black fill) had ATP plus either purified RSC (yellow) or INO80 (purple) added (data from Ref. 24). Poly (T:A) are sense-strand tracts (>5) of A (red) or T (green). d, Insulator TFs uncouple divergent transcription. Nascent transcription (CRAC data from Ref. 26) for control or Rap1/Reb1 anchor-away (AA) depleted strains was collected for N divergent gene pairs sharing the same promoter region, then correlated between the gene pairs. e, Pcf11 termination factor accumulates at insulator TFs. Architecture at promoters adjacent to an upstream termination region (tandem genes) and having (TFO) or lacking (UNB) an insulator TF.
Assembly of Pol II PICs occurs in the context of chromatin, where the TSS resides on the inside edge of a downstream +1 nucleosome (Fig. 4b). Most promoters have a constitutive nucleosome-free NFR. The seemingly interchangeable term NDR, for TF-mediated nucleosome depletion, is problematic. Since TFs are absent from UNB promoters they would lack TF-regulated nucleosome depletion and an NDR. We therefore considered whether NFRs and NDRs are distinct.
NFRs at TFO/UNB promoters were short (<150 bp) and bisected by a pair of oppositely-stranded nucleosome-disfavoring poly(dA:dT) tracts (Fig. 4c, red/green). NFRs have been biochemically reconstituted on genomic DNA with purified histones and chromatin remodelers24. When applied to our promoter classes, we found that histones alone reconstituted NFRs in vitro at TFO/UNB, but less effectively at STM (Fig. 4c, dip in black-filled plots compared to in vivo, and Extended Data Fig. 7a). TFO/UNB NFRs were widened by the RSC remodeler (Fig. 4c, wider dip in yellow-fill compared to black-fill) and had their −1/+1 nucleosomes positioned by INO80 (purple fill)24. STM promoter nucleosomes, in contrast, were less responsive to RSC and INO80. They bound TFs/cofactors in vivo and were nucleosome-depleted at the −1/−2 nucleosome positions (Fig. 4b, magenta). Unlike NFRs, NDRs had an intrinsic capacity to form nucleosomes in vitro and were unperturbed by remodelers (Fig. 4c, vertical arrow around −400). These same regions have been interpreted to have MNase-sensitive “fragile” nucleosomes in vivo (Supplementary Data 1BX, 69% were “fragile” at STM vs 19% at UNB). However, our data indicate that MNase-sensitivity reflects TF/cofactor binding rather than unstable nucleosomes25. Thus, inducible promoters have NDRs, while constitutive promoters have NFRs.
In the compact yeast genome, promoters and terminators often share the same NFR/NDR at adjacent genes, with the potential to mutually influence their expression unless insulated26. In support of this, PIC occupancy at divergent promoter pairs was less correlated at promoters (TFO) having insulator TFs compared to UNB promoters (Extended Data Fig. 7b). The same was observed for divergent nascent transcription (Fig. 4d). RP/STM divergent promoters also had low transcription correlation. Anchor-away (AA) removal of Rap1, which binds RP/STM, resulted in a higher correlation (red in Fig. 4d). This was not observed with Reb1 removal, which mainly binds TFO promoters. Reb1, but not Rap1, removal resulted in higher correlations at TFO and Reb1-bound promoters (Fig. 4d, cyan). As a negative control, removal of Rap1 had little effect at Reb1-bound promoters. We suggest that insulator TFs like Rap1 and Reb1 uncouple divergent transcription at promoters to which they bind. Similarly, where a gene terminator is shared with a promoter (tandem genes), termination factor Pcf11 overlapped with the adjacent PIC, unless intervened by an insulator TF (Fig. 4e and Extended Data Fig. 7c). This supports prior conclusions on insulators that were based on nascent transcription26.
Taken together, these results suggest that PIC assembly is mechanistically tied to adjacent upstream PIC assembly at divergent genes, and transcription termination at tandem genes, unless these events are insulated. In such architectural arrangements, some insulator TFs may not be direct effectors of transcription via cofactor recruitment, but instead insulate and direct −1/+1 nucleosome positioning24. Others may be condition-specific for cofactor recruitment.
TF-cofactor interactions and circuits
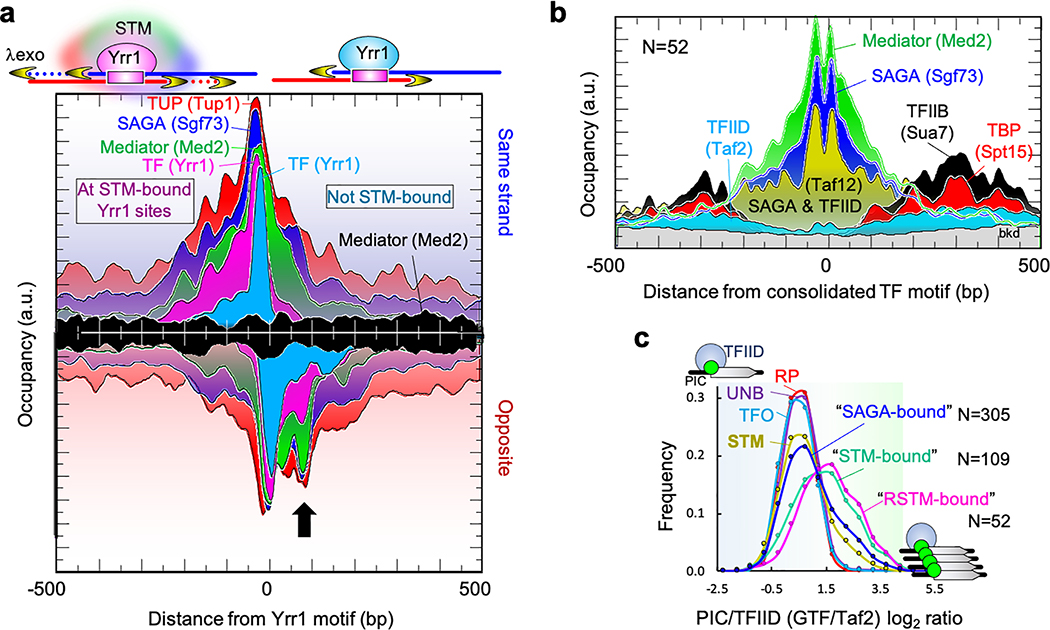
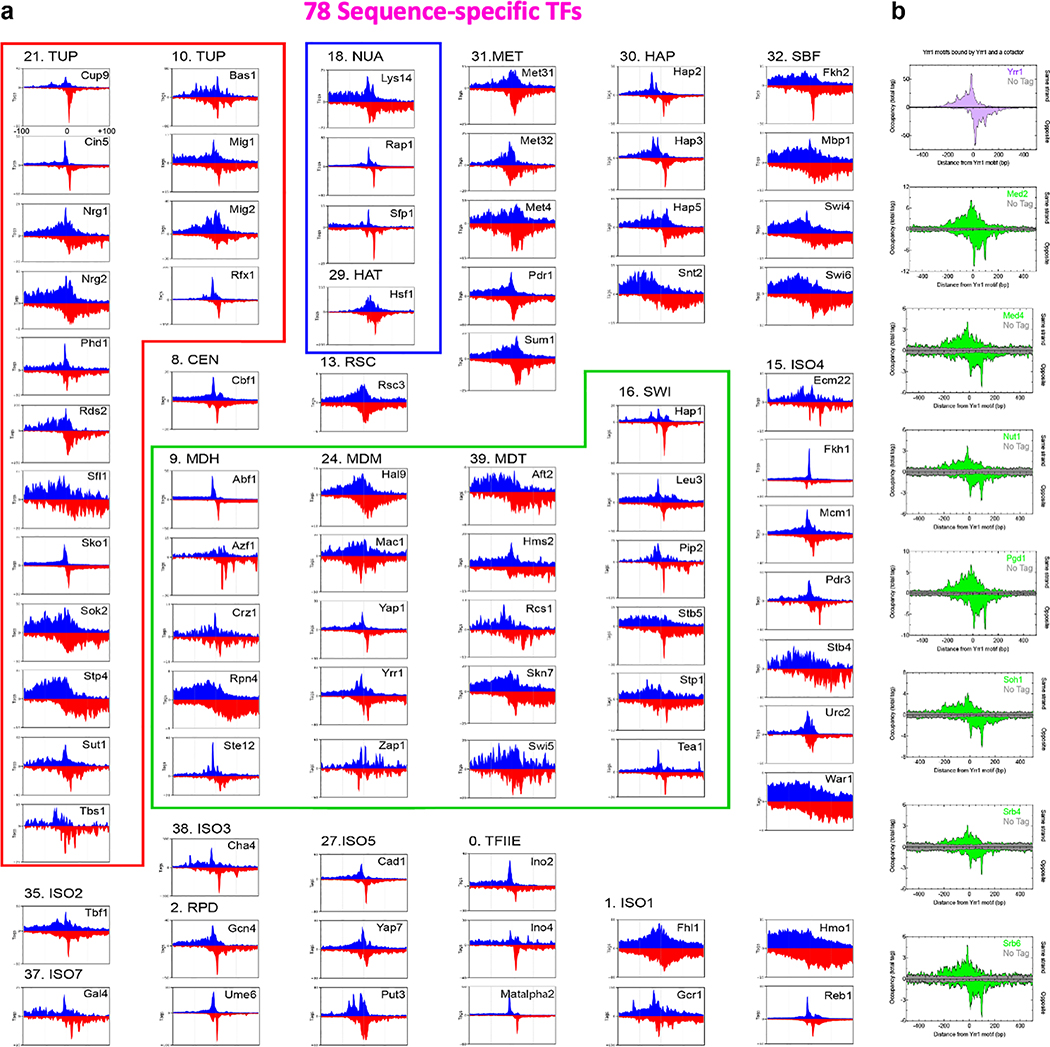
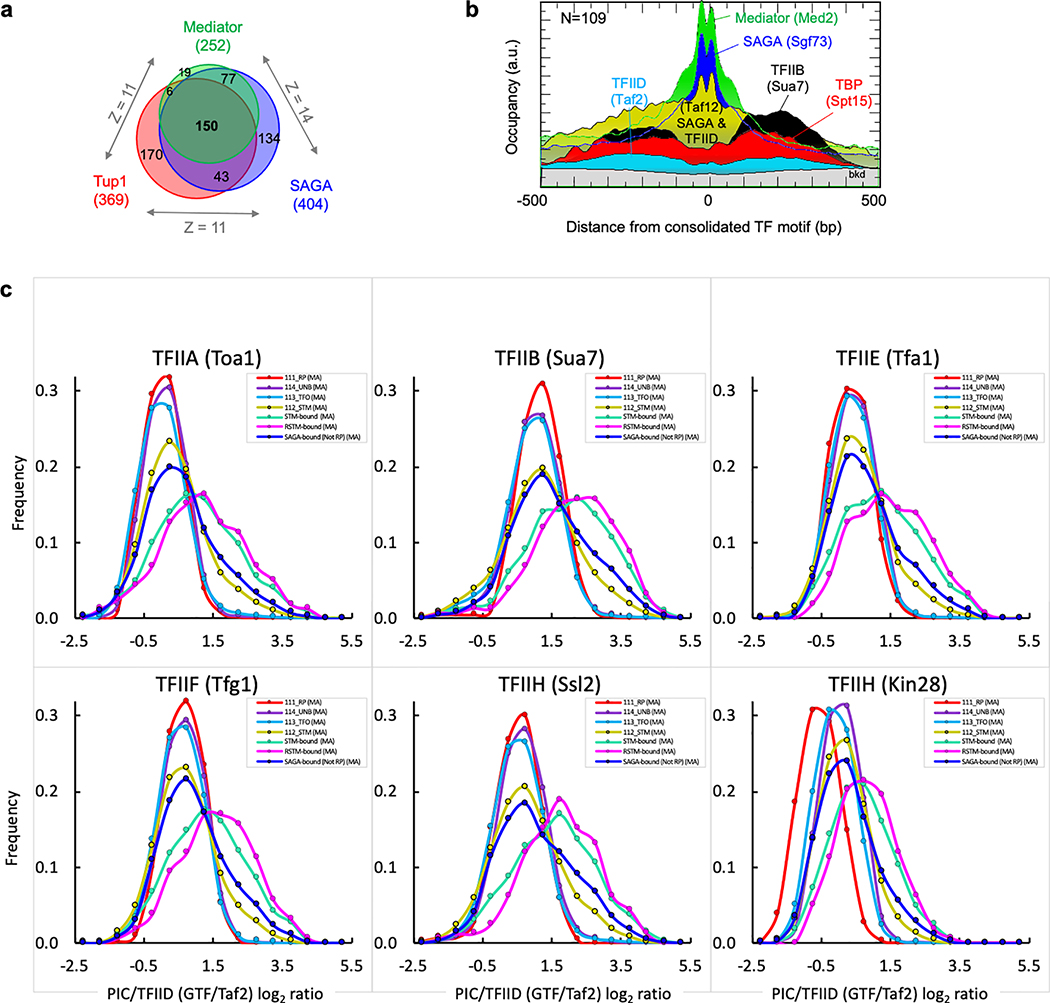
A comprehensive set of 78 sequence-specific TFs were bound to promoters in rich media (Supplementary Data 21K). The JASPAR database of TF-motif interactions independently confirmed proper motif specificity for 90% of the TFs (Supplementary Data 21M). Some TFs had robust ChIP-exo patterning around their cognate motif (Extended Data Fig. 8a, e.g., Cup9 and Cin5), which reflects their site-specific structural interactions with DNA on a genomic scale. Remarkably, most TFs had relatively diffuse ChIP-exo patterning flanking their motif (Extended Data Fig. 8a, e.g., Nrg1, Bas1, and Yrr1). As exemplified by Yrr1 in Fig. 5a (magenta vs cyan), the diffuse TF patterning was particularly pronounced at sites having multiple STM cofactors present (e.g., SAGA, TUP, Mediator, SWI-SNF, and RPD3-L), and less diffuse at other sites for the same TF, but lacking STM cofactors. STM cofactors may impart a distinct local environment that results in more dispersed crosslinking. The same diffuse patterning occurred with STM cofactors that were anchored there (Fig. 5a and Extended Data Fig. 8b). Since they tend to co-occupy the same set of promoters (Extended Data Fig. 9a, Supplementary Data 21K), TFs might coexist with multiple positive/negative cofactors of chromatin accessibility and Pol II recruitment. This diffuse patterning is consistent with the notion of TF-anchored condensates27.
Fig. 5 |. TFs stably interact with STM cofactors but not GTFs.
a, Architecture at Yrr1 motifs in two classes of Yrr1-bound promoters: “STM-bound” (left-side labels) and “Not STM-bound” (right-side cyan and black labels) (see Methods). The arrow points to where cofactor crosslinking permeates Yrr1 crosslinking. b, Representative architecture of STM cofactors or PIC components at a consolidated set of TF motifs at RSTM promoters (strand averaged; see Methods and Supplementary Data 11AI), and oriented by TSS. Taf12 is in SAGA and TFIID. c, Frequency distribution of promoters having the indicated PIC/TFIID ratio (average of six GTFs, 3-bin moving average), separated by promoter class (RP, STM, TFO, UNB) or promoter sets based on cofactor enrichment. “SAGA-bound” excludes RP promoters, which are highly enriched with SAGA and shown separately. The “STM-bound” promoter set required all of the following to be present: SAGA, Mediator/ SWI/SNF, and TUP; “RSTM-bound” additionally required the presence of RPD3-L complex. The x-axis is in arbitrary units.
Unlike STM cofactors, we detected no ChIP-exo patterning of TFIID, TBP or any GTFs at a consolidated set of promoter TF sites, despite GTF detection to the periphery where TSSs reside (Fig. 5b and Extended Data Fig. 9b). Thus, a long-standing paradigm that TFs stably engage TFIID at promoters was not evident, despite clear TF-cofactor interactions. PIC assembly is driven by TFIID at essentially all genes28, although at inducible genes it is augmented through SAGA independent of TFIID28–30. While the gene-specificity of SAGA has been enigmatic and controversial31, the ChIP-exo assay detects SAGA at only a subset of genes. The discrepancy may reside in low specificity of other assays32.
We addressed SAGA specificity further. As a direct readout of TFIID-independent PIC assembly, we expect high GTF levels relative to TFIID where SAGA is bound. However, most SAGA-bound promoters (RP/STM/“SAGA-bound”) lacked high GTF/TFIID ratios, although a smaller fraction did have high ratios (equivalent modes in Fig. 5c and Extended Data Fig. 9c, and rightward tail). Thus, SAGA binding is not concomitant with TFIID-independent PIC assembly. Instead, promoters having multiple STM cofactors displayed high GTF/TFIID ratios (“STM-bound” and “RSTM-bound” in Fig. 5c). Thus, maximal TFIID-independent PIC assembly is achieved under conditions where there is maximal engagement of a wide variety of negative and positive TF/cofactors with NDRs, including but not limited to SAGA.
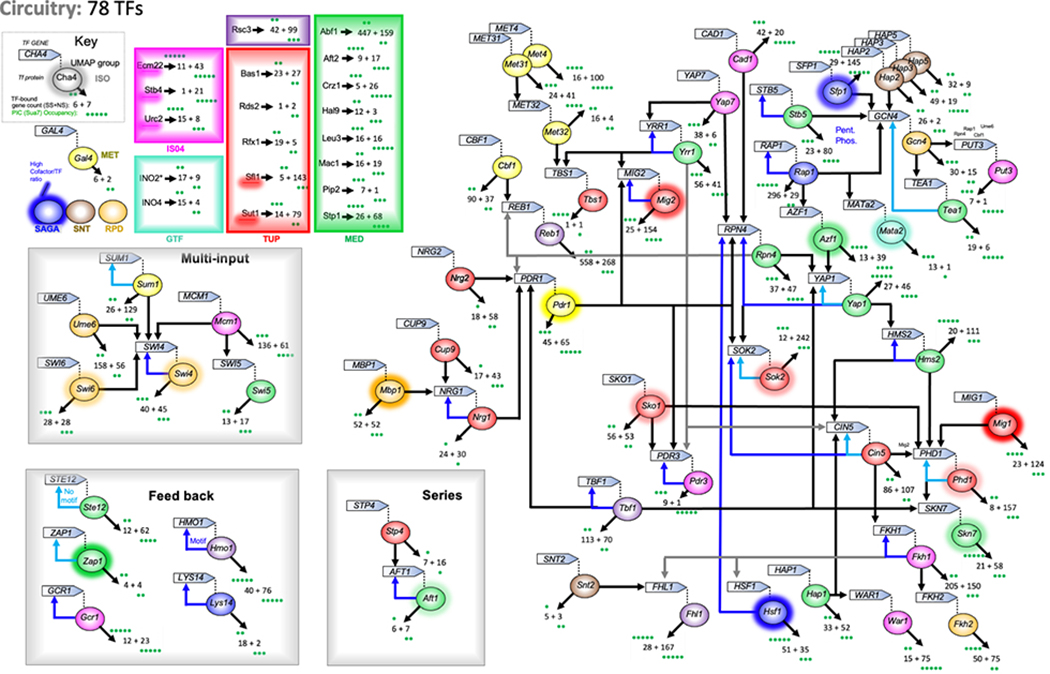
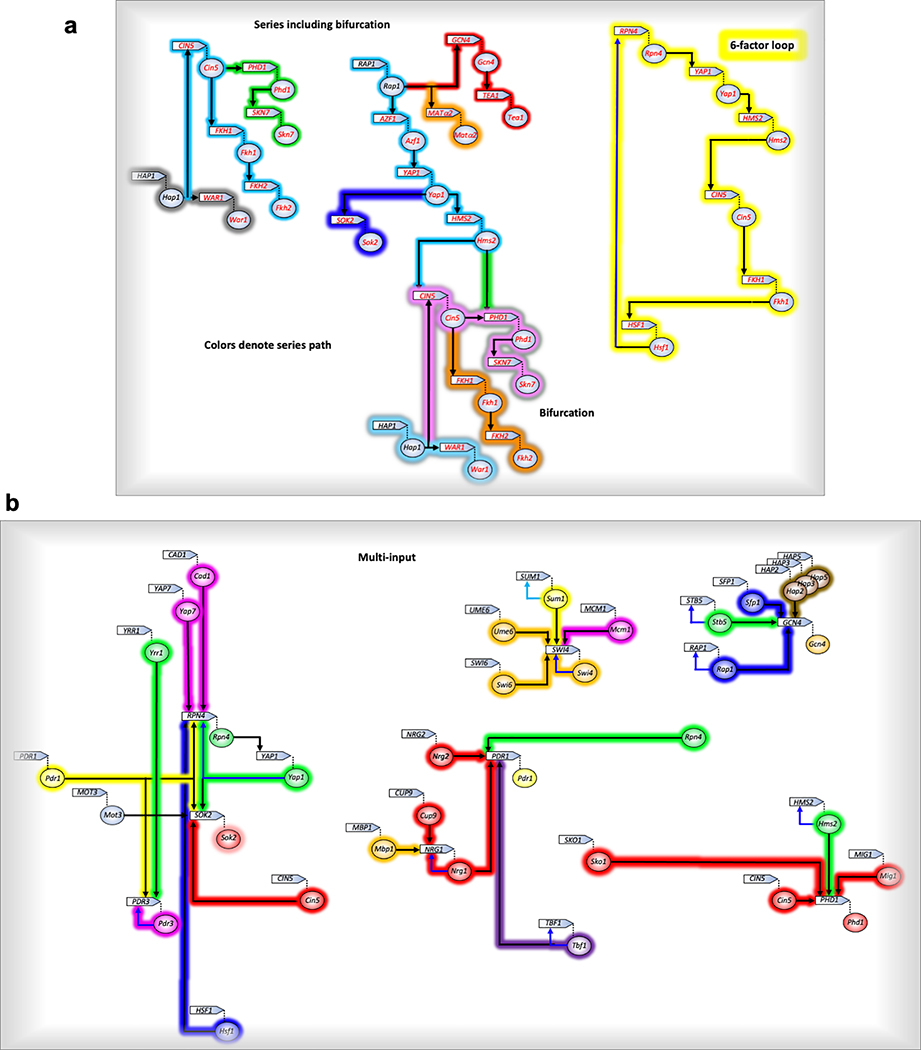
Promoters bound by TFs included both cognate (motif-based) and noncognate interactions (Extended Data Fig. 10). In assessing cognate interactions, most TFs bound promoters of ~4–30 genes, whereas ~20% bound 50–100 genes each, and eight that were mostly insulator-like (Abf1, Reb1, Cin5, Mcm1, Tbf1, Ume6, Fkh1, Rap1) bound >100 genes each. TFs bound other TF promoters (Extended Data Fig. 10), from which archetype regulatory circuit motifs have been described33. About half of all TF-encoding genes lacked TF binding (42/78 were UNB), and thus are expected to be constitutive and at the start of their regulatory circuit. Strikingly, about half (43/78) of the TFs existed within a single highly integrated circuit, suggesting that TF regulation is highly interconnected. Eleven TFs bound to multiple TF-encoding genes (multi-output archetype), suggesting that they have the potential to diversify their control through other TFs. Most TFs (47/78) bound only one other TF gene (single output), thereby propagating the circuit. There were long regulatory series with as many as seven TFs in series that bifurcated and/or looped (Extended Data Fig. 11a). Remarkably, about one-third of the TFs bound to their own promoter (simple loop) indicating that direct feedback control is common for TFs (autoregulation archetype). Nine TF promoters had multiple TFs site-specifically bound (multi-input archetype; Extended Data Fig. 11b). In most cases, each bound TF was a member of a different meta-assemblage. Thus, multiple TF regulatory mechanisms/meta-assemblages (e.g., RPD, SAGA, TUP, MED, etc.) converge at TF genes. One-quarter (21/78) bound to no other TF gene and thus are likely to be at the end of their circuit.
Conclusions
Consistent with published studies, we find that the vast majority of Pol II promoters share the same basic constitutive architecture. Local DNA sequence and chromatin remodelers create a constitutive NFR flanked by stable and well-positioned nucleosomes. This is recognized by TFIID and is configured for constitutively low gene expression. TFs and cofactors are not involved, except that some TFs (like Abf1 and Reb1) organize nucleosomes and insulate against nearby genomic events.
TFs and cofactors that directly regulate PIC assembly define the ~20% of all genes and are architected for inducibility. This involves a dynamic “futile cycle” of nucleosome acetylation (by SAGA and Nua4) and deacetylation (Rpd3-L), coupled to nucleosome eviction (SWI/SNF) and stabilization (Tup1-Cyc8), that produces an NDR. In this inducible environment, PIC assembly is augmented beyond what TFIID delivers. The stage is then set for enhanced recruitment of Pol II via TF/Mediator complexes34. Much of this induced transcription may exist in hubs where multiple induced promoters coalesce, perhaps for the purposes of efficiently recycling the transcription machinery34. Once transcription has cleared the promoter most genes appear to encounter the same Pol II ensemble whose architecture changes at fixed distances along gene bodies.
This comprehensive high-resolution view of genomic chromatin architecture ties into constitutive genes have post-initiation global regulatory controls35, and raises questions as to how environmental signaling directs inducibility through TF/cofactor control. A clear view of epigenomic architecture provide a better context to understand how it integrates with other layers of gene regulation that occur during RNA processing, transport, and translation. Since most of the key proteins examined here are evolutionary conserved, their architectural themes likely exist in other eukaryotes.
Methods
Strains and antibodies
The vast majority of data for this study was collected from TAP-tagged Saccharomyces cerevisiae strains (originally purchased from Dharmacon; now available from Horizon Inspired Cell Solutions (Cambridge, United Kingdom)). The background strain for this collection was BY4741 (derivative of S288-C; MATa his3Δ1 leu2Δ0 met15Δ0 ura3Δ0). Negative control ChIPs and ChIPs with specific antibodies were performed with BY4741. If the TAP-tagged strain for a particular target was unavailable, we instead used HA-tagged strain (originally purchased from Dharmacon; now available from Horizon Inspired Cell Solutions (Cambridge, United Kingdom). The background strain for the HA-collection was diploid, derived from BY4741 designated Y800 (MATa leu2-D98cry1R/ MATα leu2-D98CRY1 ade2–101 HIS3/ade2–101 his3-D200 ura3–52 caniR/ura3–52CAN1 lys2–801/lys2–801 CYH2/cyh2R trp1–1/TRP1 Cir0 carrying pGAL-cre (amp, ori, CEN, LEU2)).
Rabbit IgG (Sigma, I5006, various lot #) conjugated to Dynabeads was used against TAP-tagged strains in which the TAP-tag containing Protein A was the target. Santa Cruz Biotechnology sc-7392 antibody was used against HA-tagged strains. Millipore antibody 04–1570-I, 04–1571-I, or 04–1572-I were used against the serine 7, 2, or 5 phosphorylated forms of the C-terminal domain of RNA polymerase II, respectively; and 07–352 against H3K9ac. Cell Signaling antibody 5546S was used against H2BK123ub. Cse4 ChIP-exo was performed with antibody from Carl Wu (Johns Hopkins University). Hsf1 ChIP-exo was performed with antibody from David Gross (Louisiana State University). MNase ChIP-seq was performed on the following histone modifications (along with Abcam antibody catalog number) and presented online: H3 (ab1971), H3K27ac (ab4729), H3K36me3 (ab9050), H3K4me3 (ab8580), H3K79me3 (ab2621), H3K12ac (ab46983), and H2B (Active Motif 39237).
Cell growth and ChIP-exo
Saccharomyces cerevisiae strains were grown in 67 ml of yeast peptone dextrose (YPD) media to an OD600 = 0.8 at 25°C. Cells were cross-linked with formaldehyde at a final concentration of 1% for 15 minutes at 25°C and quenched with a final concentration of 125 mM glycine for 5 minutes. Cells were collected by centrifugation, and washed in 1 ml of ST Buffer (10 mM Tris-HCl, pH 7.5, 100 mM NaCl) at 4 °C. The cells were pelleted again, the supernatant was removed, and the pellet was flash frozen.
Since STM classification criteria included promoters that became bound by SAGA upon acute heat shock as previously described36, we performed equivalent heat shock but using the exact workflow of the current study. We used this new data to assign heat shock-induced binding of SAGA (which was highly correlated with the prior study). For these heat shock samples, yeast was grown in 67 ml of YPD to an OD600 = 0.8 at 25°C, then an equal volume of 55°C YPD media was added to raise the temperature of the culture to 37°C and incubated at 37°C for 6 minutes. Then, cells were cross-linked with formaldehyde at a final concentration of 1% for 15 minutes at room temperature by adding a 50 ml solution of ice-cold 3.7% formaldehyde in water. Note that protein-DNA crosslinks occur rapidly. Cross-linking was quenched with a final concentration of 125 mM glycine for 5 minutes. Cells were collected by centrifugation, and washed in 1 ml of ST Buffer at 4 °C. The cells were pelleted again, the supernatant was removed, and the pellet was flash frozen.
Chromatin preparations are based on modifications of a prior protocol1. Frozen cell pellets were resuspended and lysed in 1 ml of FA Lysis Buffer (50 mM Hepes-KOH, pH 7.5, 150 mM NaCl, 2 mM EDTA, 1% Triton, 0.1% sodium deoxycholate, and CPI) and 500 μl volume of 0.5 mm zirconia/silica beads by bead beating in a Mini-Beadbeater-96 machine (Biospec) for three cycles of 3 min on / 7 min off cycles (Samples were kept in a freezer during the off cycle). The lysates were transferred to a new tube and microcentrifuged at maximum speed for 3 minutes at 4°C to pellet the chromatin. The supernatants were discarded, and the pellets were resuspended in 600 ul of FA Lysis Buffer and transferred to 15 ml polystyrene conical tubes containing 300 ul of 0.1 mm zirconia/silica beads. The samples were then sonicated in a Bioruptor Pico (Diagenode) for 8 cycles with 15 seconds on and 30 seconds off intervals to obtain DNA fragments 100 to 500 bp in size. Each ChIP-exo assay processed the equivalent of 33 ml cell culture (~8 × 10⁸ cells). The remaining half of the processed chromatin was flash frozen and stored at −80°C in case a technical replicate was desired.
A 33 ml culture-equivalent (~630 million cells) of yeast fragmented and solubilized chromatin (~190 μl) was incubated overnight (~16 hr) at 4°C with the appropriate antibody. A 10 ul bed volume of conjugated IgG-Dynabeads (0.83 mg/ml IgG and 5 mg/ml Dynabeads) or 3 ug of specific antibodies with a 10 ul slurry-equivalent of Protein A Mag Sepharose (GE Healthcare) was used in each reaction.
ChIP-exo 5.0 was performed as described1. Essentially, ChIP libraries were partially constructed on the immunoprecipitated resin, then lambda exonuclease was used to trim nucleotides in the 5’ to 3’ direction until stopped by a protein-DNA crosslink. The DNA was then eluted and library construction completed.
In a typical experiment with TAP-tagged yeast strains, 48 ChIP-exo experiments were performed concurrently. Each set included 46 unique targets, a Reb1-TAP sample as a positive control, and a BY4741 (parental strain lacking the TAP tag) as a negative control. Following 18 cycles of PCR, all 48 samples were pooled equally by volume. Library concentration was quantified by qPCR. Equivalent workflows occurred with other strains.
Using paired-end Illumina sequencing and cellular conditions identical to those used to generate ChIP-exo data, we generated a genome-wide nucleosome map (MNase histone H3 and H2B ChIP-seq) with improved accuracy over our prior maps. MNase ChIP-seq was performed as described37. Briefly, formaldehyde-crosslinked chromatin was digested with MNase to achieve ~80% mononucleosomes. After H3 or H2B ChIP and library construction, libraries were size-selected by agarose gel electrophoresis, and sequenced.
Sequencing and mapping
High-throughput DNA sequencing was performed with an Illumina NextSeq 500 or 550 in paired-end mode producing a 40 bp Read_1 and a 36 bp Read_2. Additional previously published ChIP-exo datasets for Hsf1, Msn2, Spt15, Spt16, Ifh1, and Fhl1 were included in data processing and analysis for this study23,36. Data were managed, quality controlled, and processed through a custom automated workflow control called PEGR (Platform for Epi-Genomic Research)38. Sequence reads were aligned to the yeast (sacCer3) genome using bwa-mem (v0.7.17) Aligned reads were filtered using Picard (v2.7.1)39 and samtools (v0.1.18)40 to remove PCR duplicates (i.e., where the 5’ coordinates-strand of Read_1 and Read_2 were identical to another read pair), and non-uniquely mapping reads. For ChIP-exo, the resulting mapped 5’ end of Read_1 (exonuclease stop site) is defined as a “tag”. For MNase, the resulting mapped midpoint of Read_1 and Read_2 is defined as a “tag”.
Data quality, statistics and reproducibility
We tested many targets that were not expected to directly bind to DNA, and thus could not assume that every target would produce a positive ChIP signal. We empirically determined a minimum of 200,000 deduplicated tags were required to assess the quality of an individual dataset. If a dataset received less than 200,000 tags, then we required the tag duplication level (# of reads discarded by PICARD / # of input reads) of the sample to be less than 70% before we sequenced it deeper. For example: if a dataset had 100,000 mappable deduplicated tags (unique Read_1/Read_2 combination), but a total of 1 million mappable tags before filtering, then the duplication level was 90% and it was assumed that the library was insufficiently complex to warrant additional sequencing. If a library was insufficiently complex, we performed a technical replicate with the remainder of the chromatin preparation. Following this procedure, we produced a sufficiently complex library for over 95% of targets tested from a single yeast culture. In practice, pooling equivalent proportions of 48 barcoded libraries (in terms of reaction volumes) provided similar sequencing depth across all samples. All analyzed datasets were confirmed with independent biological replicates that passed our quality control metrics. A dataset was considered successful if significant locations were identified by ChExMix (see below) and these locations were not in regions that produce highly variable data. “N” is reported for the number of target datasets (hierarchical clustering and UMAP) or the number of genomic features (composite plots and heatmaps) analyzed.
Raw FASTQ reads for each sample were aligned against the known TAP or HA epitope FASTA sequence and nearby genomic sequence to confirm the presence and location of the epitope in each strain. See https://github.com/CEGRcode/2021-Rossi_Nature/03_EpitopeID.
Mapping statistics for each dataset are available at yeastepigenome.org, along with mapped data downloads. Analyses shown at yeastepigenome.org can be reproduced or further custom analyzed using ScriptManager (https://github.com/CEGRcode/scriptmanager), which provides a simple user-friendly interface. It includes simple instructions for installation and for data analysis. Manuscript composite plot data values can be found at https://github.com/CEGRcode/2021-Rossi_Nature.
ChExMix locations
ChExMix41 version 0.31 was run with the following non-default parameters: --noread2 --scalewin 1000 --minmodelupdateevents 50 --fixedalpha 0 --mememinw 8 --mememaxw 21 --minmodelupdaterefs 25 --lenientplus. We also used the --excludebed option to exclude from analysis of a custom set of hyper-variable regions that included the rDNA locus, tRNA genes, and telomere regions (This list is available https://github.com/CEGRcode/2021-Rossi_Nature: ChexMix_Peak_Filter_List_190612.bed). By default, ChExMix requires the tag count at binding events to achieve at least 1.5 fold enrichment and a minimum Benjamini-Hochberg42 corrected p-value of 0.01 (Binomial), compared with the scaled “masterNoTag_20180928” negative control count. All experiments for a given protein target were analyzed by ChExMix individually. The resulting peak calls for each individual replicate experiment can be found at yeastepigenome.org or GEO. In addition, the --lenientplus option enables a multi-replicate reproducibility assessment mode in ChExMix. Using this feature, replicate experiments passing Quality Control were analyzed simultaneously, and the resulting joint peak calls were used to classify Pol II features (see “Pol II promoter classes”, below). Locations are defined as ChExMix peaks if their tag counts pass the thresholds in the combined meta-experiment (essentially merging tag counts across replicates), or in one or more individual replicate experiments. However, locations are only reported if the NCIS-scaled tag counts did not vary significantly across replicates (Binomial, 1.5 fold, p<0.01). This latter condition had the effect of screening out locations that were not reproducibly enriched across replicated experiments. Locations resulting from a combined analysis of two independent replicates can be found at https://github.com/CEGRcode/2021-Rossi_Nature/04_ChExMix_Peaks (and at https://doi.org/10.26208/rykf-6050 for individual replicates).
The negative control for ChExMix peak calling, termed “masterNoTag_20180928”, was created by merging 15 individual BY4741 (background strain) ChIP experiments into a single BAM file. These negative controls were generated over an 18-month period during the main phase of data collection. The file “masterNoTag_20180928.bam” is comprised of the following SampleIDs: 11851, 11946, 12094, 12880, 13484, 13822, 14202, 14408, 14637, 14825, 15256, 15818, 16073, 17814, and 18504 and is available at https://doi.org/10.26208/rykf-6050.
Meta-assemblages
Meta-assemblages are based on cell populations. Thus, their member targets tend to bind the same genomic locations, although not necessarily at the same time or above a preset algorithmic threshold. Due to parameter constraints placed on clustering, significant but rare (e.g., HIR) and/or highly isolated (e.g., Vid22/Tbf1) binding events tended to cluster near each other in UMAP, and so were placed in a single miscellaneous meta-assemblage (ISO) without further analysis.
Using bedtools intersect (bedtools version 2.27.1), all ChExMix peaks (regardless of whether they were Pol II sector-associated, defined above) for each of 384 validated input targets were intersected in a 100 bp window around themselves. This produced a symmetrical matrix of counts representing the frequency of peak overlap between all samples. 2D hierarchical clustering43 was then performed using average linkage and uncentered correlation as the metric.
The interaction matrix was further filtered to remove 13 targets with less than five total ChExMix peaks (e.g., Pol I targets having only two binding location that are annotated in the reference yeast genome, despite the rDNA locus being highly repetitive). This produced a symmetrical matrix of 371 samples (Fig. 1b and Supplmentary Data 3). The matrix was then used as the input into the UMAP algorithm (v0.3.7)44 using the following parameters: umap.UMAP(n_neighbors=5, min_dist=0.0, n_components=2, metric=‘correlation’, random_state=RS,).fit_transform(X). Kmeans clustering was performed on the resulting 2D projection at a variety of K (5, 10, 20, 25, 30, 35, 40, 100, 145). No new biologically distinct clusters appeared beyond K=40.
Reference features and intervals
Coordinates for 253 replication origins (ACS, reflecting Autonomously Replicating Sequences (ARS) Consensus Sequences) were obtained from Ref. 6. Note: ACS_6_32973 has a duplicate entry on the yeastepigenome.org website, resulting in 254 features. Coordinates for X-core elements (XCE), centromeres (CEN), RNA polymerase I (Pol I), TSS, Pol III TSS, NCR (SGD-defined noncoding RNA annotated as ncRNA_gene, snoRNA_gene, and snRNA_gene), and Ty transposon long terminal repeats (LTR) were obtained from Saccharomyces Genome Database (SGD) on March 3, 2017 (available on GitHub: SGD_features_170331.tab). RNA polymerase II (Pol II) transcript start sites (TSS) were obtained from Xu et al45. They were matched to each SGD coding feature through their systematic GeneID. These TSSs were based on microarrays and reported the most 5’-enriched sense-strand coordinate in the promoter. When no transcript was reported for an SGD feature, the TSS and TES were imputed from the SGD coordinates by moving 70 bp upstream of the start ATG (SGD start) for TSS and 70 bp downstream of the stop codon (SGD end) for TES. This imputation was based on the empirical observation that the median distance from the Xu-defined45 TSS and the start codon was 70 bp. “Dubious ORFs” were initially considered and then excluded from further analysis because we and others46 found no validating evidence. Noncoding RNAs (ncRNAs) were from SGD annotations, cryptic unstable transcripts (CUTs) and stable unannotated transcripts (SUTs) were from Xu et al45, and Xrn1-sensistive unstable transcripts (XUTs) from van Dijk et al47. Reference datasets are available atgithub.com/CEGRcode/2021-Rossi_Nature: SGD features (SGD_features_170331.tab), ORF TSS (Xu_2009_ORF-Ts_V64.gff3), CUT (Xu_2009_CUTs_V64.gff3), SUT (Xu_2009_SUTs_V64.gff3), and XUT (van_Dijk_2011_XUTs_V64.gff3).
Nucleosome maps at Pol II promoter regions
MNase H3 and H2B ChIP-seq paired-end reads were bioinformatically filtered to 100–160 bp fragment size, then nucleosome dyads (peaks) were called from the mapped midpoint location of Read_1 and Read_2 5’ ends using GeneTrack (v1) (parameters: s40e80F1)48. Peaks were required to overlap within a 75 bp window in at least 4 of 6 datasets (three H2B and three H3 MNase ChIP-seq, SampleID: 10951, 10952, 10967; 10947, 10948, 10966) to call a consensus nucleosome (N=6). The average location of overlapping peaks defined the dyad coordinate of a consensus nucleosome.
The +1 nucleosome was defined as the nucleosome dyad peak that was closest to a TSS in a window −60 to +140 bp. If no nucleosome was found, then an additional search was performed −80 to −61 bp relative to the TSS. If none was found, then the region was viewed in Integrated Genome Viewer version 2.5.2 (IGV)49, and manually assigned. If no nucleosomes could visually be assigned to a TSS in IGV, then a +1 nucleosome dyad coordinate was imputed as the SGD ATG start coordinate (which is the consensus location of +1 nucleosomes). This placed the TSS at the genome-wide canonical location relative to the imputed +1 dyad.
We previously defined consensus −1 nucleosome positions of all Pol II genes, regardless of whether a nucleosome had low occupancy or was even detectable50. However, here our intent was to define the region encompassing NFRs and NDRs, and so we chose to ignore nucleosome positions that were highly depleted of nucleosomes. Our goal was to manually determine the location of the most robust algorithmic nucleosome position (Upstream Stable Nucleosome or USN) that was located closest to a TSS and in a window −500 to −60 bp from the TSS, as long as that nucleosome wasn’t already called a +1 nucleosome. If one of the following criteria was met, then the nucleosome landscape was visualized in IGV, and the USN and/or +1 nucleosomes were manually (re)assigned (N=753): 1) either the USN or +1 was not present in the original algorithmically-defined set, 2) the USN-to-(+1) dyad-to-dyad distance was calculated to be smaller than 187 bp [the size of a nucleosome (147 bp) and two linkers (2×20 bp)], 3) a sequence-specific TF peak was a) located <600 bp upstream of the TSS and b) upstream (more 5’ to the nearest TSS) of a nucleosome call having an occupancy score that was in the bottom 5% of all nucleosomes (i.e., an algorithmically-called nucleosome that was in fact highly depleted in the vicinity of a TF). If no nucleosomes could visually be assigned, the USN nucleosome coordinate was imputed as 750 bp upstream of the +1 nucleosome dyad (99 percentile of calculated NDR/NFR lengths). The NDR/NFR length at these features was reported as “9999” in Supplementary Data 11S (N = 297).
In total, 59,002 nucleosomes were called across the S. cerevisiae genome. Nucleosome occupancy and fuzziness scores were calculated as previously described51. All nucleosome calls with their median occupancy and fuzziness scores are available on Github: https://github.com/CEGRcode/2021-Rossi_Nature/02_References_and_Features_Files/Nucleosome_calls_and_stats.xlsx).
ChExMix locations at filtered Pol II genes
The initial list of all compiled features totaled 11,112 (Supplementary Data 1). Numerous quality control metrics were calculated for each Pol II-transcribed feature to assess their validity and mappability. We used two general transcription factors (GTFs) [Sua7 (SampleID=11743) and Ssl2 (11747)] and the negative control (masterNoTag_20180928.bam) with total tags set to be equal across all three to assess the enrichment around each candidate coding and noncoding Pol II TSS (N=9,844; Feature class Level 1: 01–12,14,24,25 in Supplementary Data 11D), as described below.
A region of the genome was defined for each transcribed feature that included the transcribed sequence (TSS to TES) and the surrounding regulatory region. The upstream (promoter) regulatory region was defined as the inclusive interval between the dyad coordinate of the Upstream Stable Nucleosome (USN; see above) and the TSS. When no USN was called for a feature, then the upstream boundary was defined as 750 bp upstream (5’) of the TSS. The downstream regulatory region was defined as the inclusive interval from TES to 100 bp downstream (3’). This boundary was based on the consensus position of the termination machinery relative to TES. The genomic region from the USN dyad to 100 bp downstream of TES was defined as a “Pol II sector.”
ChExMix peaks for all datasets in this study were intersected with each Pol II sector using Bedtools. A protein was defined to be located within a feature if at least one ChExMix peak overlapped with any portion of the sector. If a ChExMix peak intersected two overlapping sectors (i.e., the peak exists in the promoter region of two genes in a head-to-head orientation), then that protein was located in both sectors. Consequently, the number of ChExMix peaks and the number of bound features (or sectors) is not equal.
Pol II sectors were excluded as “Hyper-variable” if any of the following conditions were met: 1) The TSS was in the highest 1% of masterNoTag_20180928 tag counts (negative control) in a 1,000 bp window centered over the TSS. 2) The TSS was in the highest 5% of masterNoTag_20180928 tag counts in a 200 bp window centered over the TSS and the ratio of both Sua7/NoTag and Ssl2/NoTag were <2. The rationale for these criteria was that if the signal in the negative control was too high, and the signal-to-noise of the robust GTFs were not well-above the high background, then we did not have confidence in locations called at these sites. The sector was retained if it overlapped with a peak call from any dataset in this study. It was assumed that the peak indicated enough dynamic range to have useable data in this region. Pol II sectors excluded by this metric: (N=75; 08_Hyper-variable in Supplementary Data 11D).
Pol II sectors were excluded for having “poor mappability” if any of the following conditions were met: 1) The TSS was in the lowest 1% of MasterNoTag_20180928 tag counts in a 1,000 bp window centered over the TSS. 2) The TSS was in the lowest 5% of masterNoTag_20180928 tag counts in a 200 bp window centered over the TSS and the ratio of both Sua7/NoTag and Ssl2/NoTag was <2. Visual inspection of heatmaps confirmed that these segments of the genome were not uniquely mappable, and thus had low intrinsic tag counts. Pol II sectors excluded by this metric: (N=116; 24_Hyper-variable_noncoding in Supplementary Data 11D).
Pol II sectors were excluded as “Quiescent-NoPIC” if the ratio of both Sua7/NoTag and Ssl2/NoTag were <1. The sector was retained if it overlapped with a peak call from any dataset in this study. The rationale here was that if there were no peaks in the sector vicinity and no enrichment of GTFs, then this feature was relatively quiescent. Thus, it was uninformative to analyze them further. We do not exclude the possibility that these features had low sub-threshold activity. Pol II sectors excluded by this metric: (N=251; 05_NoPIC in Supplementary Data 11D).
Pol II sectors were excluded as “tRNA proximal” if peaks from Tfc3 (11835), a component of the RNA polymerase III transcription initiation factor complex, overlapped with the region between the +1 nucleosome dyad and USN dyad of the sector. tRNA genes produced high levels of background due to strong crosslinking of the Pol III machinery, to which lambda exonuclease digestion then focuses into high background peaks. While this background is present in all samples, it is most problematic or evident where target foreground signal is close to background. Pol II sectors excluded by this metric: (N=135; 06_tRNAprox in Supplementary Data 11D).
Pol II sectors were excluded as “ChExMix extreme” if they overlapped with an unusually high number of peaks. These features contained dozens of peaks in the gene body for TFs which across the rest of the genome were bound primarily in promoter regions. Further analysis revealed that the density of tags across the gene body in the masterNoTag_20180928 negative control was abnormally high or low, relative to the rest of the genome, thereby creating statistical anomalies of bound locations. ChExMix produced many false positive peak calls in unrelated datasets at these extreme regions where the background model appears to breakdown. The peak calls at these extreme features are still included in the ChExMix peak files. The number of Pol II sectors given this label was empirically capped at (N=25; 07_ChExMix_extreme in Supplementary Data 11D). The value of this filter is that it decreased the number of potentially artifactual locations occurring in noncanonical places, particularly for TFs that bind to few genes. However, we do not exclude the possibility of noncanonical extreme behavior occurring at these genes that is biological. For example, large condensates might behave in this way.
Our analysis of the noncoding RNA (ncRNA) features reported in Xu et al45 and van Dijk et al47 found that many of these calls were not supported by evidence of transcription machinery (Sua7) binding in the TSS vicinity, suggesting that many were false positives. Noncoding Pol II sectors were excluded if no Sua7 peak was found within 80 bp of the TSS. ncRNA Pol II sectors excluded by this metric: (N= 2,161; 25_excluded_ncRNA in Supplementary Data 11D).
Pol II promoter classes
Our unsupervised approach to chromatin organization genome-wide produced meta-assemblages that reflect predominant architectural themes. Meta-assemblages are computed ensembles of many genome-wide locations, and thus do not necessarily correspond to biochemically stable complexes. There are cases where a meta-assemblage like ORC, would appear to have a corresponding biochemical entity at replication origins. This makes meta-assemblages and real assemblages, seemingly the same. However, as expected, there was no single promoter architecture that emerged from our unsupervised approach. Instead, meta-assemblages reflected predominant architectural themes that ranged along a compositional spectrum from relatively heterogeneous (TFs/MED/SAGA/TUP) to relatively homogeneous (PIC). Meta-assemblages could be merged or subdivided to achieve levels of granularity, but also levels of uncertainty. They permeated promoters to varying extents.
The variation in actual assemblages at promoters (i.e., within and among the classes) gives them their unique regulatory properties, but also makes promoter classification fluid. Classification depends on input criteria that reflect on subjective concepts. Thus, prior work created SAGA-dominated and TFIID-dominated gene groups based on functional criteria (relative sensitivity to SAGA and TFIID mutants)28. This helped produce a genome-wide concept of inducible versus constitutive genes, but could not address other concepts like insulation, or that some themes may not be manifested through SAGA and TFIID, or that there may be more granularity to each of those classes. Here, we attempt to provide more granularity, but recognizing that simplifying over-arching concepts are best served with fewer groups. To this end, we created promoter classes that arose in part from our unsupervised learning approach. However, we also injected additional a priori knowledge. This knowledge considers the functionality of each factor that contributes to distinctive regulatory archetypes.
The 137 RP promoters (defined by SGD) encode subunits of the ribosome. They comprise the largest known set of genes that are thought to be co-regulated under all conditions. This may be due to the fact that they are predominantly regulated by the TF Rap1. They are highly expressed and well-studied by ChIP-exo as a group23, and so form a distinct gene set.
SAGA, Mediator and Tup1 (“STM”) are major cofactor complexes that, along with other TFs and cofactors (listed in Supplementary Data 21K), co-occur at highly expressed genes and formed major UMAP clusters. We therefore defined a set of non-RP “STM” promoters (using Bedtools intersect) if the region between the +1 nucleosome and USN dyads had at least one SAGA, Mediator, or Tup1 ChExMix call (Supplementary Data 210A) in YPD at 25˚C or a SAGA call upon acute heat shock36 (6 min. 37˚C) (N = 984 “STM” group, see Supplementary Data 11E). Most STM promoter regions (N=854 or 87%) also bound at least one of 78 TFs site-specifically (Supplementary Data 210C). The majority of these TF peaks positionally overlapped with STM cofactor peaks. Applicable to Fig. 5b, we labeled each TF-bound motif as a “consolidated TF motif”, if it overlapped with a STM peak. This motif was considered the organizing center of that promoter. When a TF motif was absent, the TF peak call was used in instead. When multiple TFs were bound to the same promoter, the TF closest to the STM peak was used (Supplementary Data 11Y–AI).
Of the remaining genes, a subset of promoters had TF ChExMix calls (whether site-specifically bound or not) or other cofactors in the region between the +1 nucleosome and USN. This list of TFs and cofactors did not include the core transcription machinery (initiation, elongation, or termination), which nevertheless were present. We therefore defined these as “TFO” (N = 1,783). About one-quarter of TFO promoters had a bound TF that was more associated with STM promoters, and thus presumably capable of recruiting cofactors (Supplementary Data 28). These TFO promoters may have been algorithmically misclassified, perhaps being environmentally condition-specific. Those non-RP, non-STM, non-TFO promoters, that remained constituted 2,474 promoters whose promoter regions lacked evidence of a binding event beyond a PIC or nucleosome, and thus formed the largest of all groups, the “unbound” (“UNB”). These classifications are indicated in Fig. 1a, along with their relationship to TFIIDdom and SAGAdom gene classes. Relative PIC occupancy (green dot count) is based on average TFIIB (Sua7) occupancy (Supplementary Data 11AJ) but confirmed with nascent and steady-state transcription.
Stringent Pol II promoter classes
These classifications were more stringent than those above and relate to Fig. 5b, c, and Extended Data Fig. 9b,c. “SAGA-bound” classification required a promoter to have a ChExMix call (“1” in Supplementary Data 23) for two or more of the following targets: Spt7, Ada2, Sgf11, Sgf73. “STM-bound” classification required a promoter to have all three of the following labels: SAGA-bound, TUP-bound, Mediator/SWI-SNF-bound, as follows. “TUP-bound” classification required a promoter to have a ChExMix call (“1”) for two or more of the following targets: Tup1, Cyc8, Sok2, Cin5. “Mediator/SWI-SNF-bound” classification required a promoter to have a ChExMix call (“1”) for two or more of the following targets: Swi1, Med2, Snf6, Swi3. “RSTM-bound” classification required a promoter to have all two of the following labels: STM-bound and RPD-bound. RPD-bound classification required a promoter to have a ChExMix call (“1”) for two or more of the following targets: Rpd3, Rxt1/Cti6, Rxt2, Rxt3, Nrm1, Ume6.
Heatmaps and composite plots
Analysis was performed on the GUI ScriptManager v.012, which is available for download at: https://github.com/CEGRcode/scriptmanager. ScriptManager provides a simple user-friendly interface for ChIP-exo analysis, and includes simple installation instructions. Heatmaps and composite plots were generated using Tag Pileup script. For ChIP-exo data, the following settings were used: Read_1 5’ end; Separate strands, 0 bp tag shift, 1 bp bin size, sliding window (moving average) 11. For MNase ChIP-seq data the following settings were used: (paired-end) Read Midpoint; Combined strands, 0 bp tag shift, 1 bp bin size, sliding window 21. All data are oriented by TSS or reference point strand.
For graphical display of composite plots, output data (Read_1 5’ ends; and H3 MN dyads) were uploaded into Excel. Underlying patterns and datapoints are available at yeastepigenome.org and github.com/CEGRcode/2021-Rossi_Nature (see Excel_Composite_Data_Processed.xlsx). An additional moving average of 20 bp (30 bp for Pol II elongation and Yrr1 composites) was performed for the purpose of improving visual clarity. Without this, the high bp resolution of ChIP-exo resulted in peaks that were quite narrow in the 1 kb visualization window, such that their fill patterns were less visually obvious. For gene body targets (Fig. 3c and Extended Data Fig. 5), smoothed strand-separated data were shifted 50 bp in the 3’ direction before combining strands. The rationale for this is that when we examined each strand separately, we noticed that patterns on the transcribed strand showed some mirroring on the nontranscribed strand. But this pattern was shifted in the 3’ direction relative to transcribed strand (i.e., more downstream of the TSS). We surmise that this “double-vision” effect was caused by efficient crosslinking such that the 5’−3’ lambda exonuclease is generally stopped at the backend of the Pol II entourage on the transcribed strand and stopped at the front-end of the entourage on the nontranscribed strand. Shifting data on both strands by 50 bp in their respective 3’ directions, partially corrected this double vision and reflects the middle of the complex. In the absence of a strand-specific 3’ shift for gene body targets, patterns near the TSS reflect the backend of the Pol II entourage, and patterns near the TES represents its front end. The data in Fig. 5b and Extended Data Fig. 9b were not strand-shifted prior to removing strand information.
Composite plots have the Y-axis labeled “Occupancy (a.u.)” (arbitrary units), reflecting Y-axis scaling that was adjusted to highlight the patterning of the data. Within a single figure (including any extended data figure counterparts), occupancy levels can be compared across multiple panels only for the same dataset. Occupancy levels of different datasets in the same or different panel cannot be directly compared. Only the peak positions are comparable. For Fig. 2, the MEME motif obtained and shown for Orc6 starts at position 2 of the ACS. For Cbf1, the MEME motif starts at position 1 of CEN. Schematics reflect subjective interpretation of peak locations, are nonlinear with respect to the diagrammed DNA linearity, and do not reflect protein molecular weights. For Fig. 3, terms include Upstream Control Element (UCE) at Pol I promoters. A, B box elements at Pol III promoters.
Nascent RNA (CRAC) analysis
This analysis relates to Fig. 4d. CRAC datasets were downloaded from GEO using accession code GSE97913. Raw sequencing data was trimmed of adapters and aligned to the sacCer3 genome using recommended parameters in associated publication26. The 5’ ends of reads (corresponding to the 3’ end of sequenced nascent RNA) were counted in a window from the TSS (Xu 2009) to 300 bp downstream (more 3’ on the “sense” strand). Only reads mapping to the sense strand relative to the gene body were retained. Datasets were normalized such that the total tag counts were equal. However, since all analysis was internal to each dataset, this had no effect on final output.
TFIIB (Sua7) occupancy data (Read_1 5’ end) were counted in a 100 bp window centered on each promoter TSS. The list of all coding genes was filtered to be only head-to-head such that each gene possessed a promoter region overlapping/adjacent to another gene’s promoter (Supplementary Data 11AZ–BG). Promoters regions were then separated into three groups: RP+STM, TFO, and UNB. Additionally, a separate Reb1-bound group was created. A Pearson correlation was calculated for CRAC signals for one promoter side compared to the other side, within each dataset.
TF classification.
We used GO classifications and the JASPAR motif database to identify candidate TFs. Here we define a TF as a target having at least four ChExMix peaks in the total set of promoter regions, and an enriched motif that is not more enriched with another TF. As of October 2019, the JASPAR database reported 175 nonredundant TF motifs for Saccharomyces cerevisiae, which are based on experimental assays including in vitro protein binding microarrays with purified protein52. Of those, 78 corresponded to TFs, in which we confirmed their site specificity in vivo by ChIP-exo. Since ChIP-exo can define site-specificity within a few bp, this represents a remarkable degree of concordance between in vivo and in vitro binding. Because of co-occurrence of motifs in the genome, additional nearby motifs were also enriched for these TFs. If multiple targets had a match with essentially the same JASPAR motif, then we used GO descriptions and the literature to identify those that were most likely to be direct binders (TFs). The rest were labeled as cofactors. For example, Nrg1 and Nrg2 bind the same motif, although JASPAR assigns this motif to Nrg1. We labelled both as TFs. Another equivalent example was Met4, Met31, and Met32. Both Yox1 and Mcm1 have distinct motifs reported in JASPAR, and both biochemically interact. However, ChIP-exo reported the Mcm1 motif for both, with Mcm1 being much stronger. We therefore classified Yox1 as a cofactor in YPD at 25˚C instead of a TF. Eight targets had GO annotations indicative of a TF and yielded robust motifs by ChIP-exo with a robust ChIP-exo pattern, but five of them had no motif in JASPAR, and three had a different motif in JASPAR. These eight were also labeled as TFs. This resulted in 78 TFs that ChIP-exo/ChExMix detected as bound to a motif in YPD at 25˚C. The remaining candidate targets that had JASPAR motifs were not labelled as TFs for the following reasons: 1) One (Yox1) appeared site-specific but was classified as a cofactor. 2) One is a GTF (TBP/Spt15). 3) 16 produced ChExMix binding locations but were deemed to be cofactors in YPD at 25˚C (i.e., had bound locations, but not bound site-specifically). Their site-specificity could be condition-specific. 4) 37 were not epitope-tagged (possibly due to lethality or technical difficulty in tagging) and thus went untested. See Supplementary Data 2 for the complete list of candidate factors, JASPAR/cis-bp motif, and MacIsaac et al53 match.
TF circuitry
The set of 78 TF-encoding genes (defined in YPD) were analyzed, along with the TFs that bound their promoter regions site-specifically (Supplementary Data 21K). A circuit-like diagram was then constructed by connecting TFs to the TF-encoding genes to which they bound. The total number of genes (TF and nonTF) that a TF was bound to was reported, separated into site-specifically bound versus those for which binding was reported but a cognate motif was not reported.
Website: yeastepigenome.org design
The backend of yeastepigenome.org is composed of two internal modules: a nodejs REST application and MongoDB database (v4.2.8). MongoDB stores sample-specific meta information and assets URL in a JSON/BSON structure. The frontend of yeastepigenome.org is composed of a React application, bootstrapped using the create-react-app tool. A target page is sub-divided into sections containing heatmaps, composite plots and other analyses and visualizations. The frontend retrieves sample information by making an API request to the backend application. The frontend is designed to support a cart system for downloading target datasets, has UCSC trackhub integrations, an integrated target lookup on SGD website, and comes with an FAQ with detailed explanation of all the plots and visualizations.
Website: yeastepigenome.org – target locations
ChExMix called binding events using a stringent statistical test of highly localized tags that was optimized to minimize false positives41. As a consequence, ChExMix did not call bound locations where tag distributions were diffuse and marginally above background (e.g., chromatin remodelers). To potentially capture these events having marginal significance, we divided each sector into five “subsectors” and determined for each dataset whether there was enrichment over the negative control (MasterNoTag_20180928) across each subsector. We defined the subsectors as follows: 1) Promoter region (−350 to −75 bp relative to TSS), 2) TSS region (−75 to +150 bp relative to TSS), 3) gene body 5’-end (+150 to +450 bp relative to TSS), 4) gene body 3’-end (−400 to −100 bp relative to TES), and 5) TES region (−100 to +100 bp relative to TES).
The tag count ratio (test/control) in a subsector (or the selected region) was calculated after the test and the negative control samples were normalized using the NCIS (Normalization of ChIP-seq) method54. The following steps were taken to calculate the significance of tag enrichment in a subsector: 1) Test/control tag ratios for subsectors were calculated, then converted to a log2 scale. 2) A Gaussian model, which represents the background tag ratio distribution, was fit to the tag ratio distribution. 3) A significance value was calculated with respect to the Gaussian model. 4) P-values were adjusted with the Benjamini and Hochberg correction42 (p-value = 0.05). The subsector analysis of each dataset is presented as a separate tab at yeastepigenome.org. These subsectors were not used for any other analyses in this study.
Website: yeastepigenome.org – motif discovery
De novo motif discovery presented at yeastepigenome.org was achieved through MEME suite55 as follows: ChExMix peak .bed file was intersected with a curated bed file consisting of all Gene Sectors (This reference dataset is available on github.com/CEGRcode/2021-Rossi_Nature: Merged_sectors_for_MEME_924.bed), with overlapping regions merged into a single region. The intersected output bed file was sorted based on the score reported by ChExMix for each peak. After sorting, the top 200 peak locations were bidirectionally expanded to 60 bp and the underlying DNA sequence was extracted in FASTA format. These sequences were used as the input for MEME55. Default parameters were used with the following exceptions: the minimum and maximum motif widths (mememinw and mememaxw) were set as 6 and 18, respectively.
Website: yeastepigenome.org - data visualization
To generate heatmaps, the ‘TagPileUpFrequency’ tool was used with no tagshifts, single basepair bins, and tags set to equal with combined strands. The tool takes in an input of bed file containing regions that have at least one overlapping ChExMix peak and the target Experiment BAM file. The tool outputs a matrix containing tag frequencies, with each row representing the region of interest and each column a single base pair bin. This output file was fed into a heatmap script that uses Java TreeView’s algorithm and matplotlib to generate the required heatmap. Bed files were pre-sorted based on the criteria indicated in each figure before running TagPileUpFrequency to generate desired heatmaps. All heatmaps were set to the same contrast threshold, which is calculated from the tag pileup frequency matrix of BoundGenes and determining a 95th percentile cutoff from this frequency distribution.
To generate Composites, ‘TagPileUpFrequency’ tool was used with no tagshifts, single basepair bins, tags set to equal with combined strands. One of the inputs to this tool is a bed file containing regions that have at least one overlapping ChExMix peak and the other is a BAM file. The tool was run on Experiment and Control BAM file individually to generate two datafiles that were fed into a composite generation script. The script uses matplotlib, a python plotting library to generate a combined composite plot.
Reporting summary
Further information on research design is available in the Nature Research Reporting Summary linked to this paper.
Data availability
See Supplementary Data 4, for a listing where to find available data and code online. In essence, all raw sequencing data and peak files from this study are available at NCBI Gene Expression Omnibus (https://www.ncbi.nlm.nih.gov/geo/) under accession number GSE147927. Processed data is available at https://doi.org/10.26208/rykf-6050. Additional analyses and data are at yeastepigenome.org. Warning: single-replicate datafiles are not likely to have meaningful data and should not be used without further replication. All underlying data to generate composite plots, coordinate files, and script parameters used to generate the figures for this paper can be downloaded from: https://github.com/CEGRcode/2021-Rossi_Nature. Final composite plot values can be found in Supplementary Data 5.
Code availability
Available at https://github.com/CEGRcode/scriptmanager.
Extended Data
Extended Data Fig. 1 |. ChIP-exo targets within meta-assemblages.
a, Simplified view of transcriptional regulation. A TF (e.g., Gal4) binds to its cognate motif (UAS) within promoters in competition with chromatin/nucleosomes (red line). The TF recruits cofactors (e.g., SAGA and Mediator) that assist in PIC (TBP, TFIIB, etc.) and Pol II assembly (green arrow) at the transcript start site (TSS) of genes. Pol II then traverses the gene to the transcript end site (TES). b, Schematic of the ChIP-exo assay. Proteins are crosslinked to DNA, which is then fragmented. Specific proteins are captured through an engineered TAP tag that is captured by the common Fc region of any IgG. Near-bp resolution is achieved via strand-specific lambda exonuclease. c, Pie chart of assayed targets separated by broad GO-based classifications (inner), or by UMAP clustering labels of genome-wide binding locations (outer). The list reports the common names of ChIP-exo targets that generated significantly enriched locations, grouped by their UMAP/Kmeans-derived meta-assemblage abbreviations (along with membership count), which are further grouped by simplified Gene Ontology categories (also shown as a pie chart). See also Supplementary Data 22H.
Extended Data Fig. 2 |. Yeastepigenome.org data visualization and discovery.
Shown is an example web browser view at yeastepigenome.org of ChIP-exo occupancy patterns for all targets (e.g., Reb1) around pre-defined genomic features. Rows are sorted by gene or promoter (NFR/NDR) length, or by distance from the indicated reference feature (where x = 0). Promoter classes include (from top to bottom) RP, STM, TFO, UNB, and others. See Supplementary Data 11G,J,C for respective row feature ID, coordinates, and sort order of features that are constant in all target display windows. Lower right (when present) provides strand-separated tag 5’ ends distributed around the protein’s cognate DNA motif, with the motif opposite strand (red) inverted in the composite plot. Corresponding color-coded nucleotide sequences are shown. All images, underlying data values, and datasets can be downloaded through embedded “META DATA” target-specific links at yeastepigenome.org. Each dataset download includes a ReadMe file describing the contents of the download. Warning: Targets with only a single replicate did not pass our significance threshold. See Supplementary Data 11C Internal ID for sort orders that are not provided in the download.
Extended Data Fig. 3 |. UMAP granularity.
UMAP projection from Fig. 1c, along with zoomed-in inserts. Labels are 40 Kmeans-based abbreviations (Supplementary Data 21J). For coordinate values for individual targets see Supplementary Data 21C,D.
Extended Data Fig. 4 |. Example of data variance among members of a feature class.
Left, Plots report the ChIP-exo patterns for Orc6 and Mcm5. The bold line represents the mean and the dashed lines represent the 5% to 95% Confidence Interval (CI). The CI was calculated for each base pair in the 1 kb window across all ACSs (n=253). Right, heatmaps of Orc6 and Mcm5. Blue indicates ChIP-exo data on the ACS motif strand, and red indicates data on the opposite strand.
Extended Data Fig. 5 |. Architecture at classes of Pol II-transcribed regions.
Shown are the top 200 coding (middle), or the top 200 noncoding (bottom) genes (based on Sua7 occupancy). See also Fig. 3c legend. Note that the RP panels are identical to Fig. 3c.
Extended Data Fig. 6 |. Architecture at LTRs.
Shown are heatmaps of PIC occupancy for Pol III (TFIIIB – Bdp1 and TBP) and Pol II (TFIIB and TBP) at the five Ty LTR classes, along with the nucleotide composition (−/+100 bp from the LTR start; from yeastepignome.org). Nucleotide sequence: GATC are yellow, red, green, and blue, respectively. All rows are linked and sorted by LTR class, then length.
Extended Data Fig. 7 |. Properties of inducible (STM), insulated (TFO), and constitutive (UNB) Pol II promoters.
a, NDRs are nucleosomal in vitro, while NFRs are nucleosome-free. Heat map of in vitro reconstituted MNase H3 nucleosomes (right) aligned by in vivo +1 nucleosome dyads and sorted by distance between the in vivo +1 nucleosome dyad and the first upstream stable nucleosome dyad (in vivo, left). b, Insulator TFs uncouple divergent PIC assembly and transcription. PIC (Sua7) occupancy (100 bp window centered on TSS). Data are presented as mean values +/− SD, from N=6 biologically independent experiments, using two-tailed T-test, no multiple comparisons. RP and STM promoters were merged. c, Insulation at tandem genes. Shown are composite plots of PIC occupancy (green, TFIIB/Sua7 ChIP-exo) for promoter regions sharing an upstream termination region (i.e., tandem genes). Pcf11 as a representative termination factor is shown in light brown, along with TFs (cyan), either collectively (“TF”, top two panels) or individually, as indicated. STM, TFO, and UNB composites are shown. Top 10 insulators are based on the number of genes bound.
Extended Data Fig. 8 |. ChIP-exo patterning reveals distinct local TF environments.
a, Shown are strand-separated composite plots of 78 TFs bound at their cognate sites, and grouped by their meta-assemblage label (colored borders). Plots are oriented and centered by motif, and extend from −100 to +100 bp. Patterns were highly penetrant across individual sites for each TF (e.g., see lower right in Extended Data Fig. 2 for Reb1 and yeastepigenome.org for other TFs). b, ChIP-exo composite profiles of individual subunits of the Mediator complex at TF Yrr1 motifs (from −500 to +500), showing consistency of patterning across Mediator subunits.
Extended Data Fig. 9 |.
a, Venn diagram of promoters having overlapping locations of STM cofactors (>0 ChExMix calls in dataset SampleIDs listed in Supplementary Data 210A). Z scores for pair-wise overlaps are shown. b, Representative architecture of STM cofactors or PIC components at a consolidated set of TF motifs at 984 STM promoters (not strand-separated; see Methods and Supplementary Data 11AI), and oriented by TSS. c, Frequency distribution of promoters having the indicated GTF/TFIID ratio. Shown are individual GTFs that were averaged in Fig. 5c.
Extended Data Fig. 10 |. TF/cofactor interaction “circuits”.
TF genes are indicated with capitalized gene names and are connected to their encoded TFs (spheres). Arrows connect TFs to other TF-encoding genes to which they are bound via their cognate motif. TFs that bound to their own genes or created a loop used blue arrows (light blue where a motif was not detected for TFs binding their own gene). TFs are color-coded based on their meta-assemblage membership (see key). Those TFs that are also particularly enriched with cofactors have colored halos. Short diagonal arrows point to the total number of all ~6,000 coding genes that are bound by that TF to its cognate motif (first number) or where no motif was detected (second number). Average relative PIC (TFIIB/Sua7) occupancy levels for those sets of genes is indicated by (•) count.
Extended Data Fig. 11 |. Isolated “circuits”.
a, Colors demarcate series paths. b, Colors emphasize different meta-assemblages as defined in Extended Data Fig. 10.
Supplementary Material
Acknowledgements.
This work was supported by National Institutes of Health grants ES013768, GM059055, and HG004160 to B.F.P., National Science Foundation ABI INNOVATION grant 1564466 to S.M., grants from the Pennsylvania State University Institute for Computational and Data Sciences to B.F.P. and W.K.M.L., and computation from Advanced CyberInfrastructure (ROAR) at the Pennsylvania State University. We thank Danying Shao as lead software engineer for the PEGR platform and her support through the ICDS RISE Team. We thank Olivia Lang for operating EpitopeID.
Footnotes
Competing Interests. The authors declare the following competing interests: B.F.P. has a financial interest in Peconic, LLC, which offers the ChIP-exo technology (US Patent 20100323361A1) implemented in this study as a commercial service and could potentially benefit from the outcomes of this research. The remaining authors declare no competing interests.
Additional information
Supplementary information is available for this paper at https://doi.org/10.1038/s41586-021-03314-8
References
- 1.Rossi MJ, Lai WKM & Pugh BF Simplified ChIP-exo assays. Nat Commun 9, 2842 (2018). [DOI] [PMC free article] [PubMed] [Google Scholar]
- 2.Rhee HS & Pugh BF Comprehensive genome-wide protein-DNA interactions detected at single-nucleotide resolution. Cell 147, 1408–1419 (2011). [DOI] [PMC free article] [PubMed] [Google Scholar]
- 3.Hahn S & Young ET Transcriptional regulation in Saccharomyces cerevisiae: transcription factor regulation and function, mechanisms of initiation, and roles of activators and coactivators. Genetics 189, 705–736 (2011). [DOI] [PMC free article] [PubMed] [Google Scholar]
- 4.Levine M, Cattoglio C & Tjian R Looping back to leap forward: transcription enters a new era. Cell 157, 13–25 (2014). [DOI] [PMC free article] [PubMed] [Google Scholar]
- 5.Cramer P Organization and regulation of gene transcription. Nature 573, 45–54 (2019). [DOI] [PubMed] [Google Scholar]
- 6.Eaton ML, Galani K, Kang S, Bell SP & MacAlpine DM Conserved nucleosome positioning defines replication origins. Genes Dev 24, 748–753 (2010). [DOI] [PMC free article] [PubMed] [Google Scholar]
- 7.Li N et al. Structure of the origin recognition complex bound to DNA replication origin. Nature 559, 217–222 (2018). [DOI] [PubMed] [Google Scholar]
- 8.Wellinger RJ & Zakian VA Everything you ever wanted to know about Saccharomyces cerevisiae telomeres: beginning to end. Genetics 191, 1073–1105 (2012). [DOI] [PMC free article] [PubMed] [Google Scholar]
- 9.Biggins S The composition, functions, and regulation of the budding yeast kinetochore. Genetics 194, 817–846 (2013). [DOI] [PMC free article] [PubMed] [Google Scholar]
- 10.Camahort R et al. Cse4 is part of an octameric nucleosome in budding yeast. Mol Cell 35, 794–805 (2009). [DOI] [PMC free article] [PubMed] [Google Scholar]
- 11.Henikoff S et al. The budding yeast Centromere DNA Element II wraps a stable Cse4 hemisome in either orientation in vivo. Elife 3, e01861 (2014). [DOI] [PMC free article] [PubMed] [Google Scholar]
- 12.Rhee HS, Bataille AR, Zhang L & Pugh BF Subnucleosomal structures and nucleosome asymmetry across a genome. Cell 159, 1377–1388 (2014). [DOI] [PMC free article] [PubMed] [Google Scholar]
- 13.Furuyama S & Biggins S Centromere identity is specified by a single centromeric nucleosome in budding yeast. Proc Natl Acad Sci U S A 104, 14706–14711 (2007). [DOI] [PMC free article] [PubMed] [Google Scholar]
- 14.Yan K et al. Structure of the inner kinetochore CCAN complex assembled onto a centromeric nucleosome. Nature 574, 278–282 (2019). [DOI] [PMC free article] [PubMed] [Google Scholar]
- 15.Han Y, Yan C, Fishbain S, Ivanov I & He Y Structural visualization of RNA polymerase III transcription machineries. Cell Discov 4, 40 (2018). [DOI] [PMC free article] [PubMed] [Google Scholar]
- 16.Mayer A et al. Uniform transitions of the general RNA polymerase II transcription complex. Nat Struct Mol Biol 17, 1272–1278 (2010). [DOI] [PubMed] [Google Scholar]
- 17.Petrenko N, Jin Y, Wong KH & Struhl K Evidence that Mediator is essential for Pol II transcription, but is not a required component of the preinitiation complex in vivo. Elife 6 (2017). [DOI] [PMC free article] [PubMed] [Google Scholar]
- 18.Jeronimo C et al. Tail and Kinase Modules Differently Regulate Core Mediator Recruitment and Function In Vivo. Mol Cell 64, 455–466 (2016). [DOI] [PMC free article] [PubMed] [Google Scholar]
- 19.Andrau JC et al. Genome-wide location of the coactivator mediator: Binding without activation and transient Cdk8 interaction on DNA. Mol Cell 22, 179–192 (2006). [DOI] [PubMed] [Google Scholar]
- 20.Paul E, Zhu ZI, Landsman D & Morse RH Genome-wide association of mediator and RNA polymerase II in wild-type and mediator mutant yeast. Mol Cell Biol 35, 331–342 (2015). [DOI] [PMC free article] [PubMed] [Google Scholar]
- 21.Zhu X et al. Genome-wide occupancy profile of mediator and the Srb8–11 module reveals interactions with coding regions. Mol Cell 22, 169–178 (2006). [DOI] [PubMed] [Google Scholar]
- 22.Krastanova O, Hadzhitodorov M & Pesheva M Ty Elements of the Yeast Saccharomyces Cerevisiae. Biotechnology & Biotechnological Equipment 19, 19–26 (2005). [Google Scholar]
- 23.Reja R, Vinayachandran V, Ghosh S & Pugh BF Molecular mechanisms of ribosomal protein gene coregulation. Genes Dev 29, 1942–1954 (2015). [DOI] [PMC free article] [PubMed] [Google Scholar]
- 24.Krietenstein N et al. Genomic Nucleosome Organization Reconstituted with Pure Proteins. Cell 167, 709–721 e712 (2016). [DOI] [PMC free article] [PubMed] [Google Scholar]
- 25.Chereji RV, Ocampo J & Clark DJ MNase-Sensitive Complexes in Yeast: Nucleosomes and Non-histone Barriers. Mol Cell 65, 565–577 e563 (2017). [DOI] [PMC free article] [PubMed] [Google Scholar]
- 26.Candelli T et al. High-resolution transcription maps reveal the widespread impact of roadblock termination in yeast. EMBO J 37 (2018). [DOI] [PMC free article] [PubMed] [Google Scholar]
- 27.Brzovic PS et al. The acidic transcription activator Gcn4 binds the mediator subunit Gal11/Med15 using a simple protein interface forming a fuzzy complex. Mol Cell 44, 942–953 (2011). [DOI] [PMC free article] [PubMed] [Google Scholar]
- 28.Huisinga KL & Pugh BF A genome-wide housekeeping role for TFIID and a highly regulated stress-related role for SAGA in Saccharomyces cerevisiae. Mol Cell 13, 573–585 (2004). [DOI] [PubMed] [Google Scholar]
- 29.Dudley AM, Rougeulle C & Winston F The Spt components of SAGA facilitate TBP binding to a promoter at a post-activator-binding step in vivo. Genes Dev 13, 2940–2945 (1999). [DOI] [PMC free article] [PubMed] [Google Scholar]
- 30.Moqtaderi Z, Bai Y, Poon D, Weil PA & Struhl K TBP-associated factors are not generally required for transcriptional activation in yeast. Nature 383, 188–191 (1996). [DOI] [PubMed] [Google Scholar]
- 31.Baptista T et al. SAGA Is a General Cofactor for RNA Polymerase II Transcription. Mol Cell 68, 130–143 e135 (2017). [DOI] [PMC free article] [PubMed] [Google Scholar]
- 32.Mittal C, Rossi MJ & Pugh BF High similarity among ChEC-seq datasets. Preprint at. bioRxiv, https//:doi.org/-in process (2021). [Google Scholar]
- 33.Harbison CT et al. Transcriptional regulatory code of a eukaryotic genome. Nature 431, 99–104 (2004). [DOI] [PMC free article] [PubMed] [Google Scholar]
- 34.Boija A et al. Transcription Factors Activate Genes through the Phase-Separation Capacity of Their Activation Domains. Cell 175, 1842–1855 e1816 (2018). [DOI] [PMC free article] [PubMed] [Google Scholar]
- 35.Badjatia N et al. Acute stress drives global repression through two independent RNA polymerase II stalling events in Saccharomyces. Cell Rep in press (2021). [DOI] [PMC free article] [PubMed] [Google Scholar]
- 36.Vinayachandran V et al. Widespread and precise reprogramming of yeast protein-genome interactions in response to heat shock. Genome Res (2018). [DOI] [PMC free article] [PubMed] [Google Scholar]
- 37.Wal M & Pugh BF Genome-wide mapping of nucleosome positions in yeast using high-resolution MNase ChIP-Seq. Methods Enzymol 513, 233–250 (2012). [DOI] [PMC free article] [PubMed] [Google Scholar]
- 38.Shao D, Kellogg GD, Lai WKM, Mahony S & Pugh BF in Practice and Experience in Advanced Research Computing 285–292 (Association for Computing Machinery, Portland, OR, USA, 2020). [DOI] [PMC free article] [PubMed] [Google Scholar]
- 39.Toolkit Picard, <{http://broadinstitute.github.io/picard/> (2019).
- 40.Li H et al. The Sequence Alignment/Map format and SAMtools. Bioinformatics 25, 2078–2079 (2009). [DOI] [PMC free article] [PubMed] [Google Scholar]
- 41.Yamada N, Lai WKM, Farrell N, Pugh BF & Mahony S Characterizing protein-DNA binding event subtypes in ChIP-exo data. Bioinformatics 35, 903–913 (2019). [DOI] [PMC free article] [PubMed] [Google Scholar]
- 42.Benjamini Y & Hochberg Y Controlling the False Discovery Rate: a Practical and Powerful Approach to Multiple Testing. Journal of the Royal Statisical Society 57, 289–300 (1995). [Google Scholar]
- 43.de Hoon MJ, Imoto S, Nolan J & Miyano S Open source clustering software. Bioinformatics 20, 1453–1454 (2004). [DOI] [PubMed] [Google Scholar]
- 44.Becht E et al. Dimensionality reduction for visualizing single-cell data using UMAP. Nat Biotechnol (2018). [DOI] [PubMed] [Google Scholar]
- 45.Xu Z et al. Bidirectional promoters generate pervasive transcription in yeast. Nature 457, 1033–1037 (2009). [DOI] [PMC free article] [PubMed] [Google Scholar]
- 46.Rhee HS & Pugh BF Genome-wide structure and organization of eukaryotic preinitiation complexes. Nature 483, 295–301 (2012). [DOI] [PMC free article] [PubMed] [Google Scholar]
- 47.van Dijk EL et al. XUTs are a class of Xrn1-sensitive antisense regulatory non-coding RNA in yeast. Nature 475, 114–117 (2011). [DOI] [PubMed] [Google Scholar]
- 48.Albert I, Wachi S, Jiang C & Pugh BF GeneTrack--a genomic data processing and visualization framework. Bioinformatics 24, 1305–1306 (2008). [DOI] [PMC free article] [PubMed] [Google Scholar]
- 49.Robinson JT et al. Integrative genomics viewer. Nat Biotechnol 29, 24–26 (2011). [DOI] [PMC free article] [PubMed] [Google Scholar]
- 50.Jiang C & Pugh BF A compiled and systematic reference map of nucleosome positions across the Saccharomyces cerevisiae genome. Genome Biol 10, R109 (2009). [DOI] [PMC free article] [PubMed] [Google Scholar]
- 51.Yen K, Vinayachandran V, Batta K, Koerber RT & Pugh BF Genome-wide nucleosome specificity and directionality of chromatin remodelers. Cell 149, 1461–1473 (2012). [DOI] [PMC free article] [PubMed] [Google Scholar]
- 52.Badis G et al. A library of yeast transcription factor motifs reveals a widespread function for Rsc3 in targeting nucleosome exclusion at promoters. Mol Cell 32, 878–887 (2008). [DOI] [PMC free article] [PubMed] [Google Scholar]
- 53.MacIsaac KD et al. An improved map of conserved regulatory sites for Saccharomyces cerevisiae. BMC Bioinformatics 7, 113 (2006). [DOI] [PMC free article] [PubMed] [Google Scholar]
- 54.Liang K & Keles S Normalization of ChIP-seq data with control. BMC Bioinformatics 13, 199 (2012). [DOI] [PMC free article] [PubMed] [Google Scholar]
- 55.Bailey TL & Elkan C Fitting a mixture model by expectation maximization to discover motifs in biopolymers. Proc Int Conf Intell Syst Mol Biol 2, 28–36 (1994). [PubMed] [Google Scholar]
Associated Data
This section collects any data citations, data availability statements, or supplementary materials included in this article.
Supplementary Materials
Data Availability Statement
See Supplementary Data 4, for a listing where to find available data and code online. In essence, all raw sequencing data and peak files from this study are available at NCBI Gene Expression Omnibus (https://www.ncbi.nlm.nih.gov/geo/) under accession number GSE147927. Processed data is available at https://doi.org/10.26208/rykf-6050. Additional analyses and data are at yeastepigenome.org. Warning: single-replicate datafiles are not likely to have meaningful data and should not be used without further replication. All underlying data to generate composite plots, coordinate files, and script parameters used to generate the figures for this paper can be downloaded from: https://github.com/CEGRcode/2021-Rossi_Nature. Final composite plot values can be found in Supplementary Data 5.


