

Summary
The frontal cortex, especially the anterior cingulate cortex area (ACA), is essential for exerting cognitive control after errors, but the mechanisms that enable the modulation of attention to improve performance after errors are poorly understood. Here, we demonstrate that during a mouse visual attention task, ACA neurons projecting to the visual cortex (VIS; ACAVIS) are recruited selectively by recent errors. Optogenetic manipulations of this pathway collectively support that rhythmic modulation of ACAVIS projection neurons in anticipation of visual stimuli is crucial for adjusting performance following errors. 30Hz optogenetic stimulation of ACAVIS in anesthetized mice recapitulates the increased gamma and reduced theta VIS oscillatory changes that are associated with endogenous post-error performance during behavior, and subsequently increased visual-evoked spiking, a hallmark feature of visual attention. This frontal-sensory neural circuit links error monitoring with implementing adjustments of attention to guide behavioral adaptation, pointing to a circuit-based mechanism for promoting cognitive control.
Keywords: cognitive control, error monitoring, attention, frontal cortex, visual cortex, top-down, frontal-sensory cortical projection
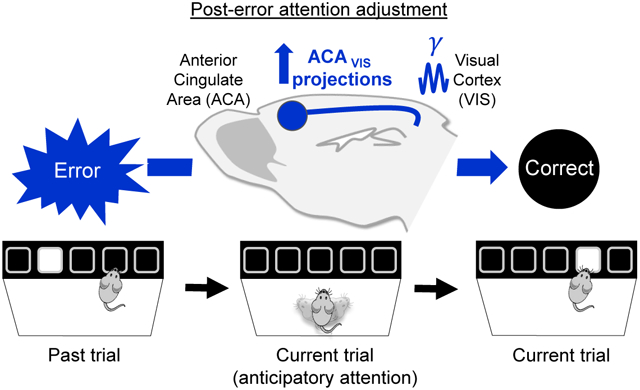
Graphical Abstract
eTOC blurb:
Norman et. al found that behavioral errors recruit frontal-sensory projections in mice. 30 Hz optogenetic stimulation of this pathway modulates performance following errors in behaving mice, and recapitulates neurophysiological hallmarks of attention in anesthetized mice. Frontal-sensory projections thereby link error monitoring with attention adjustments for behavioral adaptation.
Introduction
Adaptive goal-directed behavior requires cognitive control, systems that monitor contextually relevant internal states and external events and implement strategic adjustments in information processing, learning, and behavior after errors are made (Botvinick et al., 2004; Ullsperger et al., 2014). In people, non-human primates, and rodents, the medial frontal cortex is essential for cognitive control (Ridderinkhof et al., 2004; Shenhav et al., 2016). Notably, distinct populations of neurons in medial frontal cortex monitor specific internal and external conditions ranging from the history of positive (e.g. rewards) and negative (e.g. error, failure) outcomes, conflicts, and uncertainty (Matsumoto et al., 2007; Ridderinkhof et al., 2004; Rushworth and Behrens, 2008). Although the neural mechanisms of performance monitoring are well characterized, the circuit mechanisms that implement subsequent cognitive control are unclear. Cognitive control is aided by attentional processes that enhance our ability to detect relevant sensory stimuli. These highly dynamic processes must be deployed efficiently and flexibly to improve performance (Fiebelkorn and Kastner, 2020). The circuit mechanisms that link cognitive control with attention following errors are poorly understood.
One key circuit conserved across species for brain-wide attention are direct top-down cortico-cortical projections from the frontal cortex to sensory cortical areas (Knudsen, 2007; Moore and Zirnsak, 2017). Frontal projections to visual areas are important for attention modulation of visual processing in primates (Moore and Zirnsak, 2017). In mice, frontal-sensory projection neurons from the anterior cingulate area (ACA) to the visual cortex (ACAVIS) regulate the ability to detect visual features—a hallmark feature of visual attention (Zhang et al., 2014). However, recent studies report mixed contributions of frontal-sensory circuits to attention (Fiebelkorn and Kastner, 2020; Krauzlis et al., 2013), suggesting that ACAVIS neurons may be recruited only under particular conditions to mediate attention (Fiebelkorn and Kastner, 2020). We tested this hypothesis by selectively monitoring and manipulating neural activity in ACAVIS neurons projecting to the visual cortex in mice performing an attention task. The 5-Choice Serial Reaction Time Task (Carli et al., 1983) (5CSRTT, Fig.S1A) requires mice to sustain and divide their attention across five response windows in anticipation of a random presentation of a brief stimulus at one of the five locations. This self-paced, free-moving, attention-demanding task provides a holistic evaluation of a dynamic range of factors that underlie attention in rodents (Dalley et al., 2004; Koike et al., 2016; Lustig et al., 2013; Mar et al., 2013).
Results
ACAVIS neurons are recruited following errors
We first characterized the time course and circumstances of ACAVIS neuron recruitment during performance on the 5CSRTT. The 5CSRTT assays were conducted in automated, standardized touch-screen operant chambers that required mice to maintain divided attention among five areas. A brief, solid white square visual stimulus was presented randomly in one of the five locations on a black flat touchscreen and a nose-poke to that location was rewarded (Bari et al., 2008). The number of trials with touches to the screen that flashed, compared to missed and incorrect touches was the primary operational definition of attention. Together with these primary measures, other 5CSRTT behavioral measures assessed relatively independent indices of cognition, including but not limited to reward collect latency, premature, and preservative response (Fig. S1) (Robbins, 2002). After mice completed four out of five daily training sessions with ≥80% accuracy, ≤20% omissions, and at least 50 trials with a 2s stimulus duration (Fig. S1), the activity of ACAVIS neurons expressing the calcium indicator GCaMP6f was assessed using fiber photometry as mice performed the 5CSRTT (Fig.1A-C, S2A).
Figure 1. ACAVIS neurons are selectively recruited following a recent history of error trials.

A) Intersectional viral strategy: To selectively express GCaMP6f calcium indicator in ACAVIS neurons, Cre-dependent GCaMP6f and retrograde-Cre encoding AAVs were injected bilaterally into the ACA and visual cortex (VIS), respectively. An optic fiber was implanted at the ACA for calcium dependent recordings of ACAVIS neurons using fiber photometry. B) Representative images of GCaMP6f (green)-expressing ACAVIS neurons, DAPI (blue) and optic fiber in frontal cortex (left, Scale bar = 200 μm) and axon terminals in the visual cortex (right, Scale bar = 100 μm). C) Mice (n=8 mice) were first trained on the 5CSRTT, before viral injection. After allowing three weeks for maximal viral expression, fiber photometry recordings of ACAVIS neurons were conducted while mice performed two days of 5CSRTT (8 mice; 1,024 total trials) testing with a fixed 5s intertrial interval (ITI) and pseudorandomized stimulus duration (2.0, 1.5, 1.0, or 0.8s). D) During 5CSRTT testing, there was no difference in averaged ACAVIS activity between correct and error trials (two-way RM ANOVA, F1,7 =3.592, P=0.0999, n=8 mice) during ITI (−5:0 s) or during the stimulus period (0:2s). E) Trials following an error showed greater ACAVIS activity than trials following correct responses (two-way RM ANOVA, F1,7 =2.561, *P=0.0244, Sidak multiple comparisons at ITI and stimulus period, ****P<0.0001, ****P<0.0001, n=8 mice). F) Left) Four possible trial types based on previous and current trial result. Right) There was a significant difference between trial types (two-way RM ANOVA, F3,21 =7.632, **P=0.0026, n=8 mice, Tukey’s multiple comparisons, ITI: EC vs EE, P=0.7282, EC vs EE, P=0.09326, EC vs CE, **P=0.0095, CC vs CE, P=0.0515, EE vs CE, P=0.0592, Stimulus: EC vs EE, P=0.6333, EC vs CC, P=0.2368, EC vs CE, *P=0.0374, CC vs EE, P=0.9626, CC vs CE, P=0.2602, EE vs CE, P=0.0753). Error bars indicate mean ± s.e.m., n.s. = non significant. * indicates P<0.05, ** indicates P<0.01, **** indicates P<0.0001. See also Figure S2.
We found that ACAVIS neuron activity within single trials did not differ between correct choices, when attention was properly allocated, and errors (incorrect choice or omission) (Fig.1D, S2B). Rather, ACAVIS neuron activity depended on the outcome of the previous trial, showing elevated activity during both the intertrial interval (ITI) and stimulus presentation on the trials immediately following an error compared to a correct response (Fig.1E). This result suggests that ACAVIS activity provides an error monitoring signal that is engaged after an error occurs. Investigating other behavioral factors that could, in principle, recruit ACAVIS neurons, revealed no differences in ACAVIS neuron activity between correct or incorrect trials based on response latency or reward collection latency (Fig.S2C-E), demonstrating that ACAVIS neurons were not differentially recruited by operations that vary with processing speed, motor preparation, or motivation.
To determine if overall ACAVIS activity correlated with improved performance after an error was made, we classified trials into four groups based on the combined outcome of the previous and current trials (Fig. 1F). While trial combinations differed significantly overall, activity in correct trials after an error (EC) did not differ from activity in consecutive error trials (EE) during either the ITI or the stimulus presentation (Fig.1F). Furthermore, ACAVIS neurons responded to the visual stimulus presentation during EC, EE, and CC trials, but not during CE trials (Fig. S2F) suggesting that ACAVIS neuron activity reflects the complex combination of response to past error and ongoing level of anticipatory attention. Therefore, increased ACAVIS activity upon visual stimulation presentation was not always correlated with performance during the current trial. Collectively, the data show a graded recruitment of ACAVIS projection neurons during the visual attention task that was greatest directly after an error.
Rhythmic optogenetic stimulation of ACAVIS neurons restores task performance after errors
Fiber photometry measures summed neural activity and cannot detect finer temporal patterns of activity, such as oscillations, that may be crucial for error correction signals from the ACAVIS. We therefore used optogenetic stimulation methods to investigate the extent to which specific temporal patterns of activity contribute to post-error performance. Previous studies report that PFC oscillatory activity at low gamma frequencies (30-40 Hz) increase during the ITI of correct trials, whereas lower frequencies (5-10 Hz) accompany omissions. Moreover, optogenetic stimulation of PFC parvalbumin (PV) interneurons at these frequencies alters attention task performance in mice (Kim et al., 2016). Because PV interneurons connect extensively with and modulate the activity of pyramidal neurons, these findings led us to compare the effects of delivering 5Hz and 30Hz optical stimulation to channelrhodopsin (ChR2)-expressing ACAVIS neurons in mice performing the 5CSRTT (Fig.2A-C).
Figure 2. Optogenetic modulation of ACAVIS neurons selectively improves post-error performance.

A) Intersectional viral strategy: To selectively express light-gated sodium channel ChR2 in ACAVIS neurons, Cre-dependent ChR2 and retrograde-Cre encoding AAVs were injected bilaterally into the ACA and VIS, respectively. An optic fiber was implanted at the ACA to optically modulate the activity of ACAVIS neurons with temporal precision during the 5CSRTT. B) Representative images of ChR2 (green)-expressing ACAVIS neurons and DAPI (blue) in frontal cortex (left, Scale bar = 200 μm) and axon terminals in the visual cortex (right, Scale bar = 100 μm). C) Experimental timeline: Mice were first trained on the 5CSRTT, before viral injection. After allowing three weeks for maximal viral expression, mice underwent 5CSRTT testing. During 5CSRTT testing, with a fixed 5s ITI and pseudorandomized stimulus duration (2.0 or 1.0s), 470nm LED was stimulated at either 5 or 30Hz during the 5 s ITI or period of stimulus presentation of 50% of trials (7 mice; 3,337 total trials). One timing and frequency was tested per day. The effect of optogenetic stimulation on behavioral performance was compared following correct trials (C+1) and following error trials (E+1) at each frequency tested. D) 30Hz blue light illumination during the ITI significantly increased correct trials (%) after an error, but not after a correct response However, 5Hz stimulation during the ITI had no effect on correct trials (%) after an error or after a correct (general linear mixed model, effect of treatment (light on vs. off): P=0.6467, effect of frequency (5 vs. 30Hz): P = 0.0016, planned Tukey post hoc tests: 5Hz:C+1 light off vs on: P=1.000, E+1 light off vs on: P=0.1963, 30Hz: C+1 light off vs on: P=1.000, E+1 light off vs on: *P=0.01410). There was a difference in the baseline performance as mice performed worse (see also Figure S3) following errors compared to following correct trials. 30Hz C+1 light off vs E+1 light off: P=0.0012. E) Change in correct trials (%light on – light off) during ITI stimulation was significantly different from zero only in 30 Hz:E+1 group (Wilcoxon signed-rank test; 5Hz:C+1: P=1.000, 5Hz:E+1: P=0.3750, 30Hz:C+1: P=0.8125, 30Hz:E+1: *P=0.0313). F) Stimulation during the period of stimulus presentation at either 30Hz or 5Hz had no effect on correct trials (%) after an error or after a correct response (general linear mixed model, effect of treatment (light on vs. off): P = 0.5546, effect of frequency (5 vs. 30Hz): P = 0.1779. G) Change in correct trials (%light on – light off) during stimulus period was not difference from zero in any group (Wilcoxon signed-rank test; 5Hz:C+1: P=0.8125, 5Hz:E+1: P=0.8125, 30Hz:C+1: P=0.3750, 30Hz:E+1: P=0.2969). Error bars indicate mean ± s.e.m., n.s. = non significant. * indicates P<0.05. See also Figure S3-4.
While adult mice typically performed worse in the 5CSRTT after error trials (Fig. S3), delivering 30Hz blue light illumination to ACAVIS neurons prior to stimulus presentation significantly improved the performance after error trials by increasing accuracy and reducing omissions, both well-established indicators of improved attention (Fig.2D-E, S4A-E). If the previous trial was correct, however, 30Hz blue light illumination did not affect performance (Fig.2D-E). The post-error behavioral improvement with optogenetic modulation was specific to 30Hz frequency of illumination: 5Hz stimulation had no significant effect on performance following either error or correct trials (Fig.2D-E). Blue light illumination of ACA at either 5Hz or 30Hz delivered during stimulus presentation elicited no discernable effect on 5CSRTT performance (Fig.2F-G,S4J-L), indicating that frequency-specific ACAVIS activity is critical for error corrections in the period before, rather than during visual stimulus presentation. Notably, neither stimulation frequency altered reward collection latency, correct response latency, premature responses, or perseverative responses. Moreover, 30 Hz blue light illumination of ACAVIS did not affect motivation in a progressive ratio task or motor activity in open field test (Fig.S4M-N). Omission rate is sensitive to both attention and motivation, and every operant response depends to some degree on both. If optical stimulation of ACAVIS altered 5CSRTT performance by affecting motivation, then it should also alter reward collection latency and the breakpoint of responses during progressive ratio testing. The results show, however, that ACAVIS stimulation that selectively improved accuracy and reduced omissions did not alter established measures of motivation. Rather, 30 Hz stimulation delivered after error trials increased well-established measures of attention in the 5CSRTT, not measures of motivation, motor preparation, impulsivity, or compulsivity (Fig.S4F-I).
To gain insight into the neural mechanisms engaged by optogenetic stimulation that modulated post-error performance, we examined the differential impact of optogenetic stimulation on visual cortical neuron spiking and local field potentials (LFPs) in anesthetized mice. We analyzed in vivo single unit and LFP activity in VIS associated with 5 or 30Hz blue light illumination of ACAVIS neurons expressing ChR2 in anesthetized mice (Fig. 3A). Both 5Hz and 30 Hz blue light stimulation induced an immediate and robust increase in spiking activity (Fig. 3B-E). The moderate increase in evoked-spike probability during 30 Hz light stimulation was not accompanied by either depolarization block or artificially high spike rates, consistent with previous studies (Bitzenhofer et al., 2017; Cardin et al., 2009). LFPs recorded from VIS during 30Hz blue light illumination of ACAVIS neurons both increased low gamma (25-50 Hz) power, and reduced theta (4-8 Hz) power (Fig. 3F-H). In contrast, 5 Hz stimulation increased power across a broad frequency range (Fig. 3F-H).
Figure 3. 30Hz optogenetic stimulation of ACAVIS neurons in anesthetized mice recapitulates neural correlates of post-error performance during behavior.

(A-H) VIS spike and LFP analysis of optogenetic stimulation of ACAVIS neurons in anesthetized mice. A) To selectively express ChR2 in ACAVIS neurons, Cre-dependent ChR2 and retrograde-Cre encoding AAVs were injected bilaterally into the ACA and VIS, respectively. An optic fiber was placed at the ACA to illuminate blue light at 30 or 5 Hz, and sixteen-channel silicon probe was placed in VIS to record neuronal spiking activity (B-E) and LFP (F-H) in anesthetized mice. (B-C) Representative traces (top) of multi-unit spike activity (MUA) in VIS and averaged firing rate of VIS MUA before and during (B) 5Hz (n=272 units from 3 mice), or (C) 30Hz (n=368 units from 3 mice) blue light stimulation (bottom). Scales: x:1s, y: 100uV. MUAs are defined with a 4SD cutoff. One-way RM ANOVA: ****P<0.0001, ***P=0.0002. D) MUA during blue light illumination quantified with Spike Modulation Index calculated as (ON firing rate (0:5s) - Pre firing rate (−2:0s)) / (ON firing rate (5s) + Pre firing rate (2s)). Wilcoxon Signed Rank Test, ****P<0.0001, n=272 units (5Hz), 368 units (30Hz) from 3 mice. E) Probability of blue light pulse-induced MUA in VIS. n= 272 units (5Hz), 368 units (30Hz) from 3 mice (unpaired t-test, t638=14.50, ****P<0.0001). (F-H) VIS LFP analysis during optogenetic stimulation of ACAVIS by 5Hz and 30 Hz blue light illumination. F-G) Representative LFP waveforms recorded in VIS (top) and filtered in 4-8 Hz (theta), and 25-50 Hz (gamma) bands (bottom) before and during 5Hz (F) or 30 Hz (G) blue light stimulation. H) Quantification of LFP power modulation during blue light illumination by modulation index calculated as ((ON LFP power (0:3s) - Pre LFP power (−2:0s)) / ((ON LFP power (0:3s) + Pre LFP power (−2:0s)). Two-way RM ANOVA F1,34= 55.59, ****P<0.0001, n=15 (5Hz), 21 (30Hz) recording sites from 3 mice. (I-K) EEG recording from VIS during 5CSRTT. I) Mice (n=6) were trained on the 5CSRTT before being implanted with brain surface skull screw for EEG recording of VIS. J) (Left) Spectrogram showing EEG power modulation index calculated as (EC-EE)/(EC+EE) (355 EC trials, 464 EE trials). (right) T-tests were calculated per time-frequency bin and compared powers between EC and EE trials. (right) Statistically significant modulation shown as blue (EC<EE), black (non-significant), and red (EC>EE). K) Quantification of EEG power modulation associated with post-error performance calculated as (EC-μEE)/(σEE) (for each EC trial, the mean power for all EE trials was subtracted and then divided by the standard deviation of all EE trials) at theta (4-8 Hz) and gamma (25-50 Hz) frequency. Wilcoxon Signed Rank Test, **P=0.003 (5 Hz), **P=0.001 (30 Hz), 355 EC trials & 464 EE trials from 6 mice. * indicates P<0.05, ** indicates P<0.01, **** indicates P<0.0001. See also Figure S5.
To gain further insight into the physiological significance of these LFP changes recorded in anesthetized mice, we recorded electroencephalogram (EEG) signals from visual cortex while mice performed the 5CSRTT. We compared the changes between EC and EE trials during the ITI, when 30 Hz light illumination improved post-error performance. We found that post-error changes of task performance were associated with increased low gamma and decreased theta LFP power (Fig. 3I-K, Fig S5). These data suggest that optogenetic modulation of ACAVIS by 30Hz light illumination may recapitulate physiological changes in VIS LFP power associated with improved post-error performance.
Optogenetic suppression of ACAVIS neuron activity disrupts post-error performance
To determine when ACAVIS signals to VIS are required for error correction, independent of projection to other areas through collaterals, we selectively suppressed ACAVIS axon terminal activity in visual cortex at key time points during 5CSRTT (Fig.4A-C,S6A-B). ACAVIS projection terminals expressing the inhibitory opsin halorhodopsin eNpHR3.0 were illuminated by a light over the visual cortex during behavior testing. Inhibiting the ACAVIS projection during the 3s immediately before stimulus presentation (−3:0s) impaired performance, reducing accuracy and increasing omissions in trials that followed error but not correct trials (Fig.4F-G, Fig. S6C-F). Disrupting performance required precisely timed inhibition of ACAVIS activity. Shifting the illumination time by either 2 seconds earlier in the ITI (−5:−2s) or immediately after the ITI during stimulus presentation (0:1s) spared post-error performance (Fig.4D-E,H-I). At neither time point did ACAVIS terminal inhibition affect performance in trials that followed correct trials (Fig. 4D-I). ACAVIS terminal inhibition had no effect on reward collection latency, premature responses, or perseverative responses (Fig.S6G,I,J), and it had no effect on motivation during a progressive ratio task or motor activity during open field testing (Fig.S6K-L). While ACAVIS terminal inhibition during visual stimulus presentation reduced correct response latency (Fig.S6H), it had no effect on task performance, likely reflecting a complex neural mechanisms of speed-accuracy tradeoff (Heitz and Schall, 2012). Delivering light to GFP-expressing control mice induced no behavioral effects during 5CSRTT (Fig.S7). Taken together, ACAVIS projections are causally important for improving task performance in the period just before stimulus presentation following an error.
Figure 4. Optogenetic suppression of ACAVIS projection terminals in visual cortex disrupts post-error performance.

(A-I) Optogenetic suppression of ACAVIS projection terminals during 5CSRTT. A) Viral strategy: To express light-gated chloride channel eNpHR3.0 in excitatory ACA neurons, eNpHR3.0 encoding AAV under the CaMK2 promoter was injected in the ACA. An optic fiber was implanted at the VIS to optically suppress ACAVIS projection terminals with temporal precision during the 5CSRTT. B) Representative images of eNpHR3.0 (green)-expressing ACA neurons and DAPI (blue) in frontal cortex (left, Scale bar = 200 μm) and axon terminals in the visual cortex (right, Scale bar = 100 μm). C) Experimental timeline: Mice were first trained on the 5CSRTT, before viral injection. After allowing three weeks for maximal viral expression, mice underwent 5CSRTT testing. During 5CSRTT testing, with a fixed 5s ITI and pseudorandomized stimulus duration (2.0 or 1.0s), 470nm LED was illuminated during early ITI (−5:−2s), late ITI (−3:0s), or during period of stimulus presentation (0:1s) during 50% of trials (8 mice; 3,525 total trials). One timing was tested per day. The effect of optogenetic suppression during early ITI, late ITI, or stimulus period on behavioral performance (correct trial (%) for 1 s stimulus) was compared following correct trials (C+1) and following error trials (E+1) at each light timing tested. D) Continuous 470nm illumination during ITI −5:−2s had no effect on correct trial (%) after either a correct or error trial (general linear mixed model, effect of treatment (light on vs. off): P = 0.8802). E) Change in correct trial (%light on – light off) during −5:−2s period was not different from zero in any group (Wilcoxon signed-rank test; C+1: P=0.3750, E+1: P=0.8125). F) Continuous 470nm illumination during ITI −3:0s had no effect on correct trial (%) after a correct trial but decreased performance after error trials (general linear mixed model, effect of treatment (light on vs. off): P = 0.0032, planned Tukey post hoc tests: C+1 light off vs on: P=0.8976, E+1 light off vs on: **P=0.0054). G) Change in correct trial (%light on – light off) during ITI −3:0s stimulation was significantly different from zero only in the E+1 group (Wilcoxon signed-rank test, C+1: P=0.2969, E+1: *P=0.0234). H) Continuous 470nm illumination during the stimulus period 0:1s had no effect on correct trial (%) after either a correct or error trial (general linear mixed model, effect of treatment (light on vs. off): P = 0.7054). I) Change in correct (%light on – light off) during visual stimulus period was not significantly different from zero in any group (Wilcoxon signed-rank test; C+1: P=0.2500, E+1: P=0.0547). Error bars indicate mean ± s.e.m. n.s. = non significant. * indicates P<0.05, ** indicates P<0.01. See also Figure S6-7.
30Hz optogenetic stimulation of ACAVIS terminals promotes visual processing and post-error performance
To further elucidate how ACAVIS neurons modulate VIS activity and task performance after errors, we characterized the behavioral effects of optogenetically activating ACAVIS neuron terminals by illuminating the VIS with 30Hz blue light on 5CSRTT performance in behaving mice. We assessed the neural correlates of optical stimulation by recording activity in the visual cortex of anesthetized mice. Here, we used Chronos, a ChR2 variant that produces reliable spiking when terminals are stimulated at high frequencies (Klapoetke et al., 2014). ACAVIS projection terminals virally expressing Chronos were illuminated by a blue light at 5Hz or 30Hz over the visual cortex during the last 3s of the ITI (Fig. 5A-B, S8A) when ACAVIS neuron activity is necessary for post-error performance (Fig. 4). Stimulating ACAVIS terminals with 30Hz, but not 5Hz blue light, improved post-error performance (Fig. 5C-D, S8B-E), but had no effect on reward collection latency, correct response latency, premature responses, or perseverative responses. The selective effects on 5CSRTT performance are consistent with enhanced attention rather than altered motivation, motor preparation, impulsivity, or compulsivity (FiG.S8F-I). The behavioral results were similar to the effects of stimulating ACAVIS “soma” in ACA using ChR2: Chronos stimulation with 30 Hz, not 5 Hz blue light stimulation, improved post-error performance, verifying that ACAVIS projections play a key role in post-error task performance.
Figure 5. 30Hz optogenetic stimulation of ACAVIS projection terminals in visual cortex promotes visual processing and post-error performance.

(A-D) Optogenetic ACAVIS terminal stimulation during 5CSRTT. A) Viral strategy: To express light-gated channel Chronos in ACA neurons, Chronos encoding AAV was injected in the ACA. An optic fiber was implanted at the VIS to optically modulate ACAVIS projection terminals. B) Experimental design: 470nm light was illuminated at 5 or 30Hz during the last 3s of the ITI (−3:0s) on 50% of trials (7 mice; 1,929 total trials). C) 30Hz stimulation during the ITI showed significant increase in correct trials (%) after an error, but not after a correct response. However, 5Hz stimulation during the ITI had no effect on correct trials (%) after an error or after a correct (general linear mixed model, effect of treatment (light on vs. off) P=0.6013, effect of frequency (5 vs. 30Hz) P = 0.0659, effect of trial type (C+1 vs E+1) P <0.0001, planned Tukey post hoc tests: 5Hz:C+1 light off vs on: P=1.000, E+1 light off vs on: P=0.4026, 30Hz: C+1 light off vs on: P=1.000, E+1 light off vs on: *P=0.0289). D) Change in correct trials (%light on – light off) during ITI stimulation was significantly different from zero only in 30 Hz:E+1 group (Wilcoxon signed-rank test; 5Hz:C+1: P=0.5625, 5Hz:E+1: P=0.1563, 30Hz:C+1: P=0.8125, 30Hz:E+1: *P=0.0156). (E-G) Visually evoked spike activity in visual cortex following optogenetic modulation of ACAVIS terminals in anesthetized mice. E) Experimental design: In vivo extracellular single unit recordings of VIS neurons of anesthetized mice during and immediately after the blue 470nm light illumination at 5Hz or 30Hz over VIS to optogenetically activate ACAVIS projection terminals in mice virally expressing Chronos in ACA neurons. F) Representative spike activity of VIS neurons upon 5Hz (top) or 30 Hz (bottom) blue light illumination shown as raster plot, and their firing rate (FR) before during (ON:−3:0s) and after (Post: 0:2s). G) Quantification of VIS FR after blue light illumination at 5 Hz or 30Hz (unpaired t-test, t738=3.945, ****P<0.0001, n= 402 cells (5Hz), 338 cells (30Hz) from 5 mice). n.s. = nonsignificant. * indicates P<0.05, **** indicates P<0.0001. See also Figure S8-9.
Finally, in anesthetized mice, we used the same optogenetic stimulation parameters that improved behavioral performance to investigate their neurophysiological effects. Increased visually evoked spike firing rate is a key neural correlate of attention (Noudoost et al., 2010). We therefore examined the extent to which activating ACAVIS projections differentially affected spiking activity evoked by visual stimuli presented after the termination of blue light illumination. We confirmed that in anesthetized mice (Fig. 5E), VIS spiking activity and characteristic LFP power changes accompanied 5Hz and 30 Hz blue light illumination of ACAVIS terminals expressing Chronos (Fig. S9) that were similar to the effects of ChR2-based ACAVIS soma stimulation (Fig. 3). We then analyzed the firing rate of VIS single units in response to a brief visual stimulus presentation (white square in black background) immediately following the termination of blue light delivery in anesthetized mice. We found that visually-evoked spiking in VIS was higher after 30 Hz than after 5Hz stimulation (Fig. 5E-G). Collectively, these findings suggest that 30 Hz optogenetic stimulation of ACAVIS projections in anesthetized mice promotes subsequent VIS excitability in response to visual stimulation, a physiological effect that could contribute to improved attentional processing after errors in the 5CSRTT.
Discussion
Here we showed that errors are a key internal condition for recruiting top-down signals from the frontal to the visual cortex that support performance on an attention-guided task. Task errors trigger many behavioral adaptations, including enhanced sensory tuning to task-relevant information that improve future outcomes (Shen et al., 2015; Totah et al., 2009; Ullsperger et al., 2014). The circuit mechanisms that link error monitoring with attention have been less clear. Our findings in mice dovetail with previous human imaging studies showing post-error activation of both frontal cortex and task-relevant visual areas (Danielmeier et al., 2011; King et al., 2010). Beyond similar activation patterns, however, our study demonstrates that direct and specific frontal-sensory projections are key pathways for linking past errors to cognitive control mechanisms that promote attention. Though other frontal circuits, e.g. mPFC PV interneurons, have been shown to modulate attention, these mechanisms are not modulated by outcome history (Kim et al., 2016). In contrast, ACAVIS projections provide a unique mechanism by which past behavioral errors engage frontal-sensory cortical projections that support task performance. The selective engagement of these mechanisms by errors is important. Optogenetic ACAVIS modulation alters task performance only after error trials, not after correct trials, highlighting the functional specificity of the ACAVIS pathway in cognitive control-related mechanisms of attention. The selective recruitment of these top-down projections may be especially important for overcoming non-specific autonomic physiological consequences that otherwise impair performance after errors (Wessel, 2018). The ACAVIS pathway is not engaged after correct trials, when action correction is unnecessary and cognitive control of visual attention is unimportant for task performance.
Our optogenetic studies suggest that specific temporal patterns of activity in the ACAVIS pathway are critical components of post-error attention mechanisms. Thus, 30 Hz optogenetic stimulation of ACAVIS improved attention after errors, but 5 Hz stimulation did not. In vivo recordings in VIS of anesthetized mice further showed that 30 Hz optogenetic ACAVIS stimulation increased the power of gamma frequency LFP oscillations in visual cortex and reduced theta power. In contrast, 5 Hz optical stimulation induced a non-selective increase in LFP power across wide-ranging frequencies. While these recordings were performed in anesthetized mice, the oscillation patterns are consistent with physiological neural correlates of improved behavioral performance and support a model that temporally coordinated activity is crucial for the brain mechanisms of post-error improvement of attention. Following errors, EEG recorded during the anticipatory period showed higher gamma power in VIS just before an animal made a correct choice compared to an error. Our findings from anesthetized mice that ACAVIS stimulation modulated LFPs in VIS corroborate previous studies showing LFPs in mPFC correlate with attention performance, although prior studies did not report history-dependent effects. As mice performed a 3 choice SRTT, 30-40 Hz gamma power increased in the mPFC during the last 2s of the ITI of correct trials, whereas 5-10 Hz power increased in omission trials (Kim et al., 2016). Moreover, 30 Hz optogenetic stimulation of mPFC PV interneurons reduced total errors and improved attention performance (Kim et al., 2016). As rats performed a similar attention task, 13-30Hz LFP power in the ACA increased during stimulus anticipation in correct compared to incorrect trials (Totah et al., 2013). Together with previous findings, our study suggests that the temporal organization needed for effective ACAVIS circuit activity may constrain when optogenetic stimulation does or does not improve performance. The converging methods used in this study (i.e. optogenetic manipulation during behavior, EEG during behavior, and optogenetics in anesthetized mice) support a model that specific patterns of activity in the ACAVIS pathway on visual cortex activity are critical components of post-error attention mechanisms. The current study is limited, however, because we assessed the effects of optogenetic stimulation on spike and LFP activity in anesthetized, rather than behaving mice. To better establish a direct link between ACAVIS projections, network activity, and behavior, when technological innovations allow such work, future studies should incorporate both single unit recordings and optogenetics simultaneously as animals perform attention tasks.
Our study also provided mechanistic insights into how optogenetic stimulation prior to visual stimulus presentation can influence visual attention. In vivo recordings in anesthetized mice showed that 30Hz optogenetic stimulation of ACAVIS terminals increased spiking in VIS in response to subsequent visual stimulus presentation, a key hallmark neural correlate of attention (Noudoost et al., 2010). Our results are consistent with the increased probability of spiking that accompanies gamma oscillations (Buzsaki and Watson, 2012; Salinas and Sejnowski, 2000, 2001). The oscillatory activity established by optical stimulation immediately prior to the onset of visual stimuli may promote subsequent resonance, temporally coordinated oscillations in the dendrites of local circuits that reduce the threshold for stimulus detection upon stimulus presentation without interference. Our findings support a model that optogenetic stimulation of ACAVIS neurons by 30 Hz light illumination evokes a selective increase in gamma oscillations, which in turn may improve subsequent visual processing after an error to facilitate task performance. Future studies are warranted to directly test this model by incorporating both single unit recordings and optogenetics simultaneously as animals perform attention tasks.
Of note, optogenetic stimulation during visual stimulus presentation did not improve task performance regardless of prior trial outcomes, while ACAVIS neuron activity increased during both the ITI and during stimulus presentation after error (Fig. 1E). A previous study also showed that activating ACAVIS terminals during stimulus presentation increased firing rates in a subset of orientation sensitive neurons (Zhang et al., 2014). In the present experiment, stimulation during the presentation of visual stimuli did not improve behavioral performance, perhaps because the exogenous optogenetic stimulation interfered with the endogenous timing of activity patterns needed for processing large field visual stimulus (e.g. (Knudsen and Wallis, 2020). The non-constrained experimental setting of 5CSRTT, which engage additional behavioral mechanisms such as head orientation to adjust behavioral performance, may have also contributed to masking the beneficial effect of optogenetic stimulation on task performance.
Deficits in error monitoring (Kerns et al., 2005; van Veen and Carter, 2006) and attention network function (Mazaheri et al., 2010; Roiser et al., 2013) are common to many psychiatric disorders, including ADHD, schizophrenia, and autism spectrum disorder. The link between these cognitive deficits and distinct neural circuits remains unclear. Our study suggests that modulating activity in specific cortical pathways could provide a means for improving post-error attention in psychiatric disorders (Michelini et al., 2016).
STAR Methods
RESOURCE AVAILABILITY
Lead Contact
Further information and requests for resources and reagents should be directed to and will be fulfilled by the Lead Contact, Hirofumi Morishita (hirofumi.morishita@mssm.edu).
Materials Availability
This study did not generate unique reagents.
Data and Code Availability
The datasets and the code that support the findings of this study are available from the Lead Contact upon reasonable request.
EXPERIMENTAL MODEL AND SUBJECT DETAILS
Adult, male C57Bl/6 mice (Charles River Laboratories, MA) were group-housed under a standard 12 hour light/dark cycle in a temperature- and humidity-controlled vivarium. Training was initiated when mice were 9–10 weeks old. Mice were allowed access to water for 2 hours each day and maintained approximately 85-90% of their ad libitum weight during behavioral training. Food was mavailable ad libitum throughout the experiment. All animal protocols were approved by the Institutional Animal Care and Use Committee at Icahn School of Medicine at Mount Sinai.
METHODS DETAILS
Viral Strategies and Stereotaxic Procedures:
Following procedures previously described in (Nabel et al., 2020), mice were anesthetized with 2% isoflurane and head-fixed in a mouse stereotaxic apparatus (Narishige, East Meadow, NY). Bilateral ACA injection sites relative to Bregma area are: AP +0.7mm, ML ±0.2mm, DV −0.7mm; AP +0.2mm, ML ±0.2mm, DV −0.7mm; AP −0.3mm, ML ±0.2mm, DV −0.7mm. Bilateral VIS injection sites relative to lambda are: AP +0.0mm, ML ±3.0mm, DV −0.4mm; AP +0.1mm, ML ±2.85mm, DV −0.4mm; AP +0.1mm, ML ±3.15mm, DV −0.4mm. For circuit-specific in vivo imaging of ACAVIS neurons, AAV1-Syn-FLEX-GCaMP6f (Addgene) was injected to the ACA and concurrently, retroAAV2-Cre was injected into VIS, unilaterally. A 1.2 mm length fiber optic ferrule was a 0.48 numerical aperture and a 400 μm core diameter (Doric Lenses, Quebec, Canada) was implanted at the center of ACA injection sites and cemented to the skull using dental cement (C&B Metabond, Parkell, Edgewood, NY; Jet Acrylic, Lang Dental, Wheeling, IL). To optogenetically activate ACAVIS projection neurons at ACA soma, AAV1-EF1a-DIO-hChR2-H134R-eYFP (Addgene) and RetroAAV2-Cre (Boston Children’s Hospital Viral Core) were injected bilaterally into the ACA and VIS, respectively. Bilateral LEDs (Amuza, San Diego, CA) of 500 μm diameter that delivered 470nm light were implanted at the ACA at the center of injection sites. To optogenetically suppress ACAVIS neurons at terminals in the VIS, AAV2-CamKII-eNphR3.0-eYFP (UNC Viral Vector Core, Chapel Hill, NC) was injected bilaterally into the ACA. AAV2-CamKII-GFP (UNC Viral Vector Core, Chapel Hill, NC) was injected bilaterally into the ACA as static fluorophore control. To optogenetically modulate ACAVIS neurons at terminals in the VIS, AAV8-Syn-Chronos-tdTomato (Addgene) was injected bilaterally into the ACA. For eNpHR3.0 and Chronos experiments, bilateral LEDs (Amuza, San Diego, CA) of 500 μm diameter that delivered 470nm light were implanted at the VIS. Each infusion (500 nl) was made at 150 nl/min using a microinjector set (Nanoject III) and glass pulled syringe. The syringe was left in place for 1min following the injection to reduce backflow of virus. Behavioral testing occurred at least three weeks after viral injection to allow for maximal viral expression.
Behavior:
5-Choice Serial Reaction Time Task (5CSRTT):
Apparatus:
5CSRTT (See also Fig. S1) was conducted in eight Bussey–Saksida operant chambers with a touchscreen system (Lafayette Instruments, Lafayette, IL) following procedures previously described in (Nabel et al., 2020). Dimensions are as follows: a black plastic trapezoid (walls 20 cm high × 18 cm wide (at screen-magazine) × 24 cm wide (at screen) × 6 cm wide (at magazine)). Stimuli were displayed on a touch-sensitive screen (12.1 inch, screen resolution 600 × 800) divided into five response windows by a black plastic mask (4.0 × 4.0 cm, positioned centrally with windows spaced 1.0 cm apart, 1.5 cm above the floor) fitted in front of the touchscreen. Schedules were designed and data were collected and analyzed using ABET II Touch software (v18.04.17, Lafayette Instrument). The inputs and outputs of the multiple chambers were controlled by WhiskerServer software (v4.7.7, Lafayette Instrument).
Habituation:
Before 5CSRTT training, mice were first acclimated to the operant chamber and milk reward. The food magazine was illuminated and diluted (30%) sweetened condensed milk (Eagle Brand, Borden, Richfield, OH) was dispensed every 40s after mice entered the food magazine. Mice needed to enter the reward tray 20 times during two consecutive 30min sessions before advancing to the next stage. Mice were then trained to touch the illuminated response window. During this phase a white square stimulus was presented randomly at one response window until it was touched. If the mouse touched the stimulus, the milk reward was delivered in conjunction with a tone and magazine light. Touches to nonstimuli had no consequence. After reaching criterion on this phase (20 stimulus touches in 30 min for 2 consecutive days), mice advanced to the 5CSRTT training phase.
Training:
Mice were tested 5 days a week, 100 trials a day (or up to 30min). Each trial began with the illumination of the magazine light. After mice exited the food magazine, there was an intertrial interval (ITI) period of 5s before a stimulus was presented at one response window. If a mouse touched the screen during the ITI period, the response was recorded as premature and the mouse was punished with a 5s time-out (house light on). After the time-out period, the magazine light illumination and house light switch off signaled onset of the next trial. After the ITI period, a stimulus appeared randomly in one of the five response windows for a set stimulus duration (this varied from 32 to 2s, depending on stage of training). A limited-hold period followed by the stimulus duration was 5s, during which the stimulus was absent but the mouse was still able to respond to the location. Responses during stimulus presence and limited holding period could be recorded either as correct (touching the stimulus window) or incorrect (touching any other windows). A correct response was rewarded with a tone, and milk delivery, indicated by the illumination of the magazine light. Failure to respond to any window over the stimulus and limited-hold period was counted as an omission. Incorrect responses and omissions were punished with a 5-s time-out. In addition, repeated screen touches after a correct or incorrect response were counted as perseverative responses. Animals started at stimulus duration of 32s. With a goal to baseline mice at a stimulus duration of 2s, the stimulus duration was sequentially reduced from 32, 16, 8, 4, to 2s. Animals had to reach a criterion (>50 trials, >80% accuracy, <20% omissions) over 2 consecutive days to pass from one stage to the next. After reaching baseline criterion with the 2s stimulus duration for 4 out of 5 days, mice began 5CSRTT testing.
5CSRTT Testing:
During 5CSRTT testing, attention demand was increased by reducing and pseudo-randomly shuffling the stimulus duration to 2.0, 1.5, 1.0, and 0.8s for 4 out of 5 days. Following 5CSRTT testing, mice underwent stereotaxic viral surgery and then were reestablished to baseline criterion before fiber photometry imaging (2.0, 1.5, 1.0, and 0.8s stimulus duration), or optogenetics (2.0 and 1.0s simulus duration) experiments. Between experimental testing days, mice were subjected to 2s stimulus duration training to confirm that the mice maintain stable baseline criterion. Attention and response control were assessed by measuring the following performance: correct percentage ((100 x (correct responses)/(correct responses + incorrect responses + omissions)), percentage accuracy (100 × correct responses/(correct responses + incorrect responses)), percentage omission (100 × omissions/(omissions + correct responses + incorrect responses)), percentage of premature responses, percentage of perseverative responses, latency to correct response (s), and latency to reward collection (s) after correct choices. A premature response is a response given during the ITI before a stimulus appears. It is a measure of impulsive behavior. A perseverative response is when a response to any screen continues to be given after the correct or incorrect screen has been poked and before retrieval of the reward. It is a measure of compulsive behavior. Correct response latency (CRL) is the difference between the time of stimulus onset and the time of the correct response. It is a measure of attention and processing speed. Reward collection latency (RCL), is the difference between the time of a correct response and the time of reward collection and reflects motivation.
Progressive ratio task:
Following 5CSRTT testing, mice began training for a progressive ratio task following procedures previously described in (Nabel et al., 2020). Training and testing were performed in the Bussey–Saksida chamber as described above. Mice were water-restricted similar to during 5CSRTT. First, mice were subjected to fixed ratio (FR) training in which the center response window was illuminated and needed to be touched for a fixed number of times, depending on schedule, in order for a milk reward to be dispensed. Mice were trained on FR1, followed by FR2, FR3, and FR5 schedules. Criterion was defined as completion of 30 trials in a single session. After passed the criterion on FR5 phase for three consecutive days, mice were subjected to the progressive ratio (PR) phase where the reward response requirement was incremented on a linear +4 basis (i.e. 1, 5, 9, 13 etc.). Once mice showed stable performances, defined as less than 10% breakpoint variability across two sessions, mice underwent four days of testing. For excitatory optogenetics experiments, LEDs were stimulated at 30Hz, 1.66ms pulse, 5% duty cycle) for 5s prior to presentation of illumination of the center response window for each trial of the session. For inhibitory optogenetics experiments, LED was turned on for 3s continuously prior to presentation of illumination of the center response window for each trial of the session. The order of LED ON vs OFF daily sessions were counterbalanced across mice. Progressive ratio testing was used to measure motivation.
Open field test:
Locomotor activity was measured for 30min in a square apparatus (43 cm × 43 cm ×33 cm) equipped with a panel of infrared beams (16 beams) located in the horizontal direction along the sides of each square apparatus. Data were collected with Fusion v4 software (Omnitech Electronics, Columbus, OH, USA). Mice were given ad libitum access to water for at least one week prior to open field testing. For excitatory optogenetics experiments, mice underwent two days of open field testing. During tested LED was either turned on at 30Hz (5s on, 5 s off) for 5min followed by 5min of Light OFF for a total of 30min, order was counterbalanced between mice. Total distance moved (cm) was compared between Light ON and Light OFF 5min epochs.
In vivo Fiber Photometry:
Experiments were done at least three weeks after viral injection to allow for sufficient viral expression. A mono-fiber optic cannula (MFC 400/430-0.48 1.2 MF2.5 FLT, Doric Lenses) was stereotaxically implanted above the ACA. During recording, a matching fiber optic patch cord (Doric Lenses, MFP_400/430/0.48_1.3) was attached to the implanted fiber optic cannula with cubic zirconia sheathes following procedures previously described in (Bicks et al., 2020). The fiber optic cable was coupled to two excitation LEDs (Thorlabs, Newton, NJ): 470nm to stimulate GCaMP6f fluorescence in a Ca2+-dependent manner and 405nm which serves as an isosbestic wavelength for GCaMP6f, for ratiometric measurements of GCaMP6f activity, correcting for bleaching and signal artifacts. 470nm excitation was sinusoidally-modulated at 210 Hz and 405nm excitation was modulated at 330 Hz. Light then passed through a GFP (490) or violet (405) excitation filter (Thor labs) and dichroic mirrors before passing through the fiber optic cannula into the brain. GFP excitations emissions passed through the fiber optic cable is passed through the dichroic mirror and emission filters, and through a 0.50 N.A. microscope lens (62-561, Edmund Optics, Barrington, NJ) and then focused and projected onto a photodetector (Model 2151 Femtowatt Photoreceiver, Newport Corporation, Irvine, CA). A digital fiber photometry processor (RZ5P, Tucker-Davis Technologies, Alachua, FL) was used to demodulate the signal from each LED. Signal was then pre-processed using the Synapse Software Suite (Tucker-Davis Technologies) and collected at a sampling frequency of 1018 Hz. The power at the fiber-optic tip was approximately 10 mW. 405 nm signal was used to detrend 470 nm based on signal bleaching. The ⊿F/F was then calculated as: (470 nm signals – median 470 nm signals) / (median 470 nm signals) based on each individual 30min 5CSRTT session. Fiber photometry signal data was divided into bins to assess differences in ACAVIS recruitment depending on overall performance (correct, incorrect, or omission), CRL, incorrect response latency (IRL), and RCL. Correct and error trials were plotted to show differences in activity based on overall performance. IRL, CRL, and RCL trials divided into slow and fast responses on a within-mouse basis. Each mouse performed two days of testing. Both days of testing were combined, and then data was split into slow and fast behavior bins based on the median CRL, IRL, and RCL value.
EEG Recordings:
Mice were implanted with skull screws located at VIS (relative to lambda: AP +0.0mm, ML ±3.0mm) to record cortical EEG (Pinnacle, USA). Mice were then allowed 7 days to recover before initiating retraining. Skull screws were implanted at the left and right cerebellum to serve as ground and common reference for recording EEG. EEG signals were captured via a tethered system (Pinnacle, USA) and acquired using Sirenia Acquisition software. Data were acquired at 2 kHz using a Pinnacle preamplifier with a high (0.5 Hz)- and low-pass (200 Hz) filters. Signals were segmented into single trial epochs aligned to stimulus-onset. For time-frequency analyses, signals were padded with a time-reversed copy of themselves to prevent wrap-around effects due to convolution in the frequency domain and wavelet transformed using Morlet wavelets between 4-50hz (Guise and Shapiro, 2017). The wavelet factor (i.e., the parameter controlling the tradeoff between frequency and time resolution) linearly scaled between 14 and 24. For analyzing targeted frequency bands theta (4-8hz) and gamma (25-50hz), signals were Butterworth filtered and Hilbert transformed to generate the analytic signal from which power was extracted. All analyses used custom-written Matlab routines.
Optogenetics:
TTL signals were to a signal generator (Rigol Technologies, Beijing, China) that drove the light at specific pulse frequencies (5Hz- 10ms pulses, 30Hz- 1.66ms pulses; 5% duty cycle) during the 5s ITI or stimulus presentation pseudo randomly during 50% of trials for ChR2 experiment or during the last 3s of the ITI for Chronos experiments. One frequency was tested per testing day in a counterbalanced manner. For in vivo optogenetic inactivation of ACAVIS neuron projections during 5CSRTT, continuous 470nm light was delivered bilaterally via LED optic fiber implanted at the VIS pseudo randomly at specific time points throughout a trial during 50% of trials. In our study, we chose to use 470nm LED to suppress eNpHR3.0-expressing ACA neurons, because previous studies found that red-shifted light frequencies resulted in off-target effects in control mice that reduced 5CSRTT performance (White et al., 2018). During separate test sessions, LEDs were stimulated during either −5:−2s of ITI, −3:0s of ITI or during the length of the stimulus presentation. One timing of stimulus duration was used per test day in a counterbalanced manner. During optogenetics testing, stimulus duration was pseudo randomly shuffled between 2.0 and 1.0 s.
In vivo electrophysiology:
Three weeks after virus injection, electrophysiological experiments with optogenetic stimulation were performed following procedures previously described in (Nabel et al., 2020). For recordings from mice expressing ChR2 in ACAVIS neurons, recordings were performed under 0.8–1% isoflurane anesthesia. For recordings from mice expressing Chronos in ACA neurons, preparatory surgery leading to, and recording itself was performed initially under Nembutal/chlorprothixene anesthesia and then maintained with isoflurane (Sadahiro et al., 2020). Sixteen-channel silicon probes with 177 μm2 recording sites (NeuroNexus Technologies, Ann Arbor, MI) spaced 50 μm apart were used to record neuronal activity in the visual cortex (AP +0.0mm, ML +2.80~+3.2 mm, DV −1.0 mm). The signal detected from the probe was amplified and thresholded, and unit-sorted using an OmniPlex Neural Recording Data Acquisition System A (Plexon). Sorting of single units was carried out using principal component analysis in an offline sorter v. 3.2.2 (Plexon). Spike signals were filtered at a bandpass of 300 Hz to 8 kHz, and LFPs were filtered at a bandpass of 200 Hz. A template online sorting method was used to capture spikes as units. The waveforms of recorded units were further examined using Offline Sorter (Plexon). Blue light illumination (wavelength 473 nm, 5 Hz (10 ms pulses) or 30 Hz (1.66 ms pulses)) was delivered using an optic fiber (diameter 105 μm) and oriented immediately above the ACA (AP −0.3 mm, 0.0 mm, +0.3 mm, +0.6 mm, ML ±0.25 mm) for ChR2 characterization, or the VIS (AP +0.0mm, ML +2.80~+3.2mm) cortical surface for Chronos characterization. The power at the fiber-optic tip was approximately 10 mW. For ChR2-related experiments, each recording consists of 5s of blue light illumination at either 5Hz or 30Hz pulses with more than 1 min intervals between illuminations repeated 10 times. For Chronos-related experiments, 3s of blue light illumination at 5Hz or 30Hz pulses immediately followed by a presentation of visual stimulus (50% contrast white square (1400pix X 1400pix) in black background (2048pix X 1536pix) with CRT monitor 40.8cm x 30.6cm) programed by Psychopy3 v2020.1.3 was repeated 10 times with 20s interval. A monitor was presented 15 cm in front of the subject. To assess if laser pulses influence spiking activity, spike modulation indices and probabilities were calculated for each unit. Modulation indices measured the extent to which spiking activity changed during optogenetic stimulation, compared to the 3 seconds prior to optogenetic stimulation: (ON-pre)/(ON+pre). Light-induced spike probability expresses the ratio between spikes fired and the number of pulses during laser ON. For LFP analysis, signals were first segmented into single trial epochs aligned to light-offset, and then padded with a time-reversed copy of themselves to prevent wrap-around effects due to convolution in the frequency domain and wavelet transformed using Morlet wavelets between 4-50hz (Guise and Shapiro, 2017). The wavelet factor (i.e., the parameter controlling the tradeoff between frequency and time resolution) linearly scaled between 14 and 24. For analyzing targeted frequency bands theta (4-8hz) and gamma (25-50hz), signals were Butterworth filtered and Hilbert transformed to generate the analytic signal from which power was extracted. All analyses used custom-written Matlab routines.
Slice electrophysiology:
Following procedures previously described in (Bicks et al., 2020), animals were decapitated under isofluorane anesthesia. Brains were quickly removed and transferred into ice-cold artificial cerebrospinal fluid (ACSF) of the following composition (in mM): 210.3 sucrose, 11 glucose, 2.5 KCl, 1 NaH2PO4, 26.2 NaHCO3, 0.5 CaCl2, and 4 MgCl2. Acute coronal slices of ACA (300 μm) contained both hemispheres. Slices were allowed to recover for 40 min at room temperature in the same solution, but with reduced sucrose (105.2 mM) and addition of NaCl (59.5 mM). Following recovery, slices were maintained at room temperature in standard ACSF composed of the following (in mM): 119 NaCl, 2.5 KCl, 1 NaH2PO4, 26.2 NaHCO3, 11 glucose, 2 CaCl2, and 2 MgCl2. Slices were visualized under upright differential interference contrast microscope equipped with high power LED-coupled light source used for the identification of fluorescently-labeled cells and optogenetic stimulation (Prizmatix). Patch clamp recordings were made from fluorescently labeled ACA neurons. Borosilicate glass electrodes (5–7 MΩ) were filled with the internal solution containing (in mM): 127.5 K-methanesulfonate, 10 HEPES, 5 KCl, 5 Na-phosphocreatine, 2 MgCl2, 2 Mg-ATP, 0.6 EGTA, and 0.3 Na-GTP (pH 7.25, 295 mOsm). Signals were low-pass filtered at 3 kHz and sampled at 20 kHz. Data were low-pass filtered at 3 kHz and acquired at 10 kHz using Multiclamp 700B (Axon Instruments) and pClamp 10 v. 10.6.2.2 (Molecular Devices). Neurons were included in the analysis if input resistance, series resistance and membrane potential did not change more than 10% during the course of recordings. To validate modulation of ACA neurons with eNpHR3.0, whole-cell recordings in gap-free mode were obtained with borosilicate glass electrodes (5-8 mΩ resistance) filled with a current clamp internal solution. Cells were held at −55mV. Frequency of spikes induced by current injection in neurons expressing eNpHR3.0 were compared before, during, and after blue light stimulation using TTL-pulsed microscope-coupled LED (470 nm, Prizmatix, Holon, Israel).
Immunohistochemistry:
After mice completed behavior training and testing, they were anesthetized with isofluorane and underwent transcardial perfusion with phosphate-buffered saline (PBS) followed by 4% paraformaldehyde (PFA) in PBS, with overnight postfixation. Brains were coronally sectioned on a Leica CM3050 S cryostat (Leica Microsystems, Buffalo Grove, IL) at 30 μm for immunohistochemistry. Slices were placed in a blocking solution of 1% Bovine Serum Albumin (BSA) with 0.1% TritonX-100 in PBS on a rotating shaker for 1 hour at room temperature (RT). The slices were incubated overnight on a rotating shaker at RT in primary antibody rabbit anti-GFP (Invitrogen, 1:1000). After the overnight incubation, slices were washed three times in blocking solution then incubated for 2.5 hours at RT in secondary antibody 488 donkey anti-rabbit (Invitrogen, 1:400). The slices were subsequently washed three times, twice in blocking solution and finally in PBS. Slices were mounted on microscope slides (Brain Research Laboratories, Waban, MA) using DAPI Fluoromount-G mounting medium (Southern Biotech) and coverslipped. Using the Allen Brain Atlas, slices were collected at nine specific Bregma areas (0.14, −0.34, −0.82) to analyze the anterior-posterior spread of virally infected cells. Visual cortex slices were selected at seven Bregma areas (−3.58, −3.98, −4.38).
Imaging and analysis:
Images to validate the cannula location and viral spread of the GCaMP, ChR2, eNpHR3.0, GFP, and Chronos groups were acquired using an EVOS FL Imaging System (Thermo Fisher Scientific, Waltham, MA). Slices were imaged using a 10x lens for GFP and DAPI. To ensure consistency across imaging sessions, to image GFP signal, power was set at 90% and to image DAPI, power was set at 20-30%. Representative images were acquired using an Inverted DMi8 Widefield Microscope (Leica, Microsystems). Slices were imaged using a 20x lens for GFP and DAPI. To ensure consistency across imaging sessions, to image GFP signal, power was set at 70% and exposure time for 500 ms, and to image DAPI, power was set at 50% and exposure time for 250 ms. Images were analyzed using ImageJ software (National Institutes of Health). Mice were excluded if no expression levels were seen or if expression was not present in the dorsal ACA.
Optic Fiber location analysis:
The location of the cannula was mapped onto blank coronal slice templates taken from Paxinos and Franklin mouse brain atlas. The bottom most edge of the oval indicates how deep into the tissue the cannula was placed. Mice were excluded if cannula location implant was inaccurate.
QUANTIFICATION AND STATISTICAL ANALYSIS
Statistical analyses were performed using Prism (Graphpad, San Diego, CA) and in R v. 3.5.3. Analyses were conducted using general linear mixed models, ANOVA, Wilcoxon signed-rank tests, or t-tests as indicated. Bar graphs and photometry averaged traces are represented as the mean and error bars represent standard error of the mean (s.e.m.)
Supplementary Material
KEY RESOURCES TABLE
| REAGENT or RESOURCE | SOURCE | IDENTIFIER |
|---|---|---|
| Antibodies | ||
| rabbit anti-GFP antibody | Invitrogen | A-11122 (RRID:AB_221569) |
| Alexa 488-conjugated goat anti-rabbit IgG | Invitrogen | A-11034 (RRID:AB_2576217) |
| Bacterial and Virus Strains | ||
| AAV1-Syn-FLEX-GCaMP6f-WPRE-SV40 | (Chen et al., 2013) | Addgene viral prep # 100833-AAV1 |
| AAV1-EF1a-doublefloxed-hChR2(H134R)-eYFP-WPRE | A gift from Karl Deisseroth | Addgene viral prep # 20298-AAV1 |
| AAV2-CamKII-eNphR3.0-eYFP-WPRE-PA | UNC vector core | N/A |
| AAV2-CamKII-GFP | UNC vector core | N/A |
| AAV8-Syn-Chronos-tdTomato | (Klapoetke et al., 2014) | Addgene viral prep # 62726-AAV8 |
| rAAV2-CAG-CRE-WPRE | Boston Children’s Hospital vector core | N/A |
| Experimental Models: Organisms/Strains | ||
| Mouse:C57BL/6 | Charles River Laboratories | N/A |
| Software and Algorithms | ||
| MATLAB | Mathworks | https://www.mathworks.com/products/matlab.html |
| Sirenia Acquisition software | Pinnacle Technologies | https://www.pinnaclet.com/sirenia-download.html |
| ImageJ | NIH | https://imagej.nih.gov/ij/index.html, RRID:SCR_003070 |
| Prism8 | GraphPad | Graphpad.com |
| Synapse | Tucker-Davis Technologies | N/A |
| R | https://www.r-project.org/ | |
| pClamp 10 v. 10.6.2.2 | Molecular Devices | N/A |
| Other | ||
| Nanoinjector | World Precision Instruments | Cat# Nanoliter 2000 |
| Superfrost Plus slides | Fisher Scientific | Cat# 22-037-246 |
| Touch screen chambers for electrophysiology | Lafayette Instruments | Model 80614E |
| Teleopto wireless optogenetics | Amuza | N/A |
| digital fiber photometry processor | Tucker-Davis Technologies | RZ5P |
| OmniPlex Neural Recording Data Acquisition System A | Plexon | N/A |
| Multiclamp 700B | Axon Instruments | N/A |
Highlights.
Top-down frontosensory projections are selectively recruited after error trials.
30Hz optogenetic stimulation of top-down neurons promotes post-error performance.
Post-error performance adjustment requires anticipatory top-down activity.
30Hz optogenetic top-down stimulation promotes a hallmark feature of attention.
Acknowledgments
This work was funded by NIH F31MH121010 to KJN, NIH F30MH111143, Seaver Foundation to ENF, R01MH073689 to MLS, and NIH R21NS105119, R21MH106919, R01EY024918, R01MH119523 to HM. We thank Dr. Erin Rich, Nick Upright, and members of the Morishita lab for helpful feedback and the NVIDIA corporation.
Footnotes
Publisher's Disclaimer: This is a PDF file of an unedited manuscript that has been accepted for publication. As a service to our customers we are providing this early version of the manuscript. The manuscript will undergo copyediting, typesetting, and review of the resulting proof before it is published in its final form. Please note that during the production process errors may be discovered which could affect the content, and all legal disclaimers that apply to the journal pertain.
Declaration of Interests
Authors declare no competing financial interests or conflict of interest.
Inclusion and Diversity
One or more of the authors of this paper self-identifies as an underrepresented ethnic minority in science. One or more of the authors of this paper self-identifies as a member of the LGBTQ+ community. One or more of the authors of this paper self-identifies as living with a disability. While citing references scientifically relevant for this work, we also actively worked to promote gender balance in our reference list. The author list of this paper includes contributors from the location where the research was conducted who participated in the data collection, design, analysis, and/or interpretation of the work.
References
- Bari A, Dalley JW, and Robbins TW (2008). The application of the 5-choice serial reaction time task for the assessment of visual attentional processes and impulse control in rats. Nat Protoc 3, 759–767. [DOI] [PubMed] [Google Scholar]
- Bicks LK, Yamamuro K, Flanigan ME, Kim JM, Kato D, Lucas EK, Koike H, Peng MS, Brady DM, Chandrasekaran S, et al. (2020). Prefrontal parvalbumin interneurons require juvenile social experience to establish adult social behavior. Nat Commun 11, 1003. [DOI] [PMC free article] [PubMed] [Google Scholar]
- Bitzenhofer SH, Ahlbeck J, Wolff A, Wiegert JS, Gee CE, Oertner TG, and Hanganu-Opatz IL (2017). Layer-specific optogenetic activation of pyramidal neurons causes beta-gamma entrainment of neonatal networks. Nat Commun 8, 14563. [DOI] [PMC free article] [PubMed] [Google Scholar]
- Botvinick MM, Cohen JD, and Carter CS (2004). Conflict monitoring and anterior cingulate cortex: an update. Trends Cogn Sci 8, 539–546. [DOI] [PubMed] [Google Scholar]
- Buzsaki G, and Watson BO (2012). Brain rhythms and neural syntax: implications for efficient coding of cognitive content and neuropsychiatric disease. Dialogues Clin Neurosci 14, 345–367. [DOI] [PMC free article] [PubMed] [Google Scholar]
- Cardin JA, Carlen M, Meletis K, Knoblich U, Zhang F, Deisseroth K, Tsai LH, and Moore CI (2009). Driving fast-spiking cells induces gamma rhythm and controls sensory responses. Nature 459, 663–667. [DOI] [PMC free article] [PubMed] [Google Scholar]
- Carli M, Robbins TW, Evenden JL, and Everitt BJ (1983). Effects of lesions to ascending noradrenergic neurones on performance of a 5-choice serial reaction task in rats; implications for theories of dorsal noradrenergic bundle function based on selective attention and arousal. Behav Brain Res 9, 361–380. [DOI] [PubMed] [Google Scholar]
- Chen TW, Wardill TJ, Sun Y, Pulver SR, Renninger SL, Baohan A, Schreiter ER, Kerr RA, Orger MB, Jayaraman V, et al. (2013). Ultrasensitive fluorescent proteins for imaging neuronal activity. Nature 499, 295–300. [DOI] [PMC free article] [PubMed] [Google Scholar]
- Dalley JW, Cardinal RN, and Robbins TW (2004). Prefrontal executive and cognitive functions in rodents: neural and neurochemical substrates. Neuroscience and biobehavioral reviews 28, 771–784. [DOI] [PubMed] [Google Scholar]
- Danielmeier C, Eichele T, Forstmann BU, Tittgemeyer M, and Ullsperger M (2011). Posterior medial frontal cortex activity predicts post-error adaptations in task-related visual and motor areas. J Neurosci 31, 1780–1789. [DOI] [PMC free article] [PubMed] [Google Scholar]
- Fiebelkorn IC, and Kastner S (2020). Functional Specialization in the Attention Network. Annu Rev Psychol 71, 221–249. [DOI] [PMC free article] [PubMed] [Google Scholar]
- Guise KG, and Shapiro ML (2017). Medial Prefrontal Cortex Reduces Memory Interference by Modifying Hippocampal Encoding. Neuron 94, 183–192 e188. [DOI] [PMC free article] [PubMed] [Google Scholar]
- Heitz RP, and Schall JD (2012). Neural mechanisms of speed-accuracy tradeoff. Neuron 76, 616–628. [DOI] [PMC free article] [PubMed] [Google Scholar]
- Kerns JG, Cohen JD, MacDonald AW 3rd, Johnson MK, Stenger VA, Aizenstein H, and Carter CS (2005). Decreased conflict- and error-related activity in the anterior cingulate cortex in subjects with schizophrenia. Am J Psychiatry 162, 1833–1839. [DOI] [PubMed] [Google Scholar]
- Kim H, Ahrlund-Richter S, Wang X, Deisseroth K, and Carlen M (2016). Prefrontal Parvalbumin Neurons in Control of Attention. Cell 164, 208–218. [DOI] [PMC free article] [PubMed] [Google Scholar]
- King JA, Korb FM, von Cramon DY, and Ullsperger M (2010). Post-error behavioral adjustments are facilitated by activation and suppression of task-relevant and task-irrelevant information processing. J Neurosci 30, 12759–12769. [DOI] [PMC free article] [PubMed] [Google Scholar]
- Klapoetke NC, Murata Y, Kim SS, Pulver SR, Birdsey-Benson A, Cho YK, Morimoto TK, Chuong AS, Carpenter EJ, Tian Z, et al. (2014). Independent optical excitation of distinct neural populations. Nat Methods 11, 338–346. [DOI] [PMC free article] [PubMed] [Google Scholar]
- Knudsen EB, and Wallis JD (2020). Closed-Loop Theta Stimulation in the Orbitofrontal Cortex Prevents Reward-Based Learning. Neuron 106, 537–547 e534. [DOI] [PMC free article] [PubMed] [Google Scholar]
- Knudsen EI (2007). Fundamental components of attention. Annu Rev Neurosci 30, 57–78. [DOI] [PubMed] [Google Scholar]
- Koike H, Demars MP, Short JA, Nabel EM, Akbarian S, Baxter MG, and Morishita H (2016). Chemogenetic Inactivation of Dorsal Anterior Cingulate Cortex Neurons Disrupts Attentional Behavior in Mouse. Neuropsychopharmacology 41, 1014–1023. [DOI] [PMC free article] [PubMed] [Google Scholar]
- Krauzlis RJ, Lovejoy LP, and Zenon A (2013). Superior colliculus and visual spatial attention. Annu Rev Neurosci 36, 165–182. [DOI] [PMC free article] [PubMed] [Google Scholar]
- Lustig C, Kozak R, Sarter M, Young JW, and Robbins TW (2013). CNTRICS final animal model task selection: control of attention. Neuroscience and biobehavioral reviews 37, 2099–2110. [DOI] [PMC free article] [PubMed] [Google Scholar]
- Mar AC, Horner AE, Nilsson SR, Alsio J, Kent BA, Kim CH, Holmes A, Saksida LM, and Bussey TJ (2013). The touchscreen operant platform for assessing executive function in rats and mice. Nat Protoc 8, 1985–2005. [DOI] [PMC free article] [PubMed] [Google Scholar]
- Matsumoto M, Matsumoto K, Abe H, and Tanaka K (2007). Medial prefrontal cell activity signaling prediction errors of action values. Nat Neurosci 10, 647–656. [DOI] [PubMed] [Google Scholar]
- Mazaheri A, Coffey-Corina S, Mangun GR, Bekker EM, Berry AS, and Corbett BA (2010). Functional disconnection of frontal cortex and visual cortex in attention-deficit/hyperactivity disorder. Biol Psychiatry 67, 617–623. [DOI] [PubMed] [Google Scholar]
- Michelini G, Kitsune GL, Cheung CH, Brandeis D, Banaschewski T, Asherson P, McLoughlin G, and Kuntsi J (2016). Attention-Deficit/Hyperactivity Disorder Remission Is Linked to Better Neurophysiological Error Detection and Attention-Vigilance Processes. Biol Psychiatry 80, 923–932. [DOI] [PMC free article] [PubMed] [Google Scholar]
- Moore T, and Zirnsak M (2017). Neural Mechanisms of Selective Visual Attention. Annu Rev Psychol 68, 47–72. [DOI] [PubMed] [Google Scholar]
- Nabel EM, Garkun Y, Koike H, Sadahiro M, Liang A, Norman KJ, Taccheri G, Demars M, Im S, Caro K, et al. (2020). Adolescent frontal top-down neurons receive heightened local drive to establish adult attentional behavior in mice. Nat Commun 11, 3983. [DOI] [PMC free article] [PubMed] [Google Scholar]
- Noudoost B, Chang MH, Steinmetz NA, and Moore T (2010). Top-down control of visual attention. Curr Opin Neurobiol 20, 183–190. [DOI] [PMC free article] [PubMed] [Google Scholar]
- Ridderinkhof KR, Ullsperger M, Crone EA, and Nieuwenhuis S (2004). The role of the medial frontal cortex in cognitive control. Science 306, 443–447. [DOI] [PubMed] [Google Scholar]
- Robbins TW (2002). The 5-choice serial reaction time task: behavioural pharmacology and functional neurochemistry. Psychopharmacology (Berl) 163, 362–380. [DOI] [PubMed] [Google Scholar]
- Roiser JP, Wigton R, Kilner JM, Mendez MA, Hon N, Friston KJ, and Joyce EM (2013). Dysconnectivity in the frontoparietal attention network in schizophrenia. Front Psychiatry 4, 176. [DOI] [PMC free article] [PubMed] [Google Scholar]
- Rushworth MF, and Behrens TE (2008). Choice, uncertainty and value in prefrontal and cingulate cortex. Nat Neurosci 11, 389–397. [DOI] [PubMed] [Google Scholar]
- Sadahiro M, Demars MP, Burman P, Yevoo P, Zimmer A, and Morishita H (2020). Activation of somatostatin interneurons by nicotinic modulator Lypd6 enhances plasticity and functional recovery in the adult mouse visual cortex. J Neurosci. [DOI] [PMC free article] [PubMed] [Google Scholar]
- Salinas E, and Sejnowski TJ (2000). Impact of correlated synaptic input on output firing rate and variability in simple neuronal models. J Neurosci 20, 6193–6209. [DOI] [PMC free article] [PubMed] [Google Scholar]
- Salinas E, and Sejnowski TJ (2001). Correlated neuronal activity and the flow of neural information. Nat Rev Neurosci 2, 539–550. [DOI] [PMC free article] [PubMed] [Google Scholar]
- Shen C, Ardid S, Kaping D, Westendorff S, Everling S, and Womelsdorf T (2015). Anterior Cingulate Cortex Cells Identify Process-Specific Errors of Attentional Control Prior to Transient Prefrontal-Cingulate Inhibition. Cereb Cortex 25, 2213–2228. [DOI] [PMC free article] [PubMed] [Google Scholar]
- Shenhav A, Cohen JD, and Botvinick MM (2016). Dorsal anterior cingulate cortex and the value of control. Nat Neurosci 19, 1286–1291. [DOI] [PubMed] [Google Scholar]
- Totah NK, Jackson ME, and Moghaddam B (2013). Preparatory attention relies on dynamic interactions between prelimbic cortex and anterior cingulate cortex. Cereb Cortex 23, 729–738. [DOI] [PMC free article] [PubMed] [Google Scholar]
- Totah NK, Kim YB, Homayoun H, and Moghaddam B (2009). Anterior cingulate neurons represent errors and preparatory attention within the same behavioral sequence. J Neurosci 29, 6418–6426. [DOI] [PMC free article] [PubMed] [Google Scholar]
- Ullsperger M, Danielmeier C, and Jocham G (2014). Neurophysiology of performance monitoring and adaptive behavior. Physiol Rev 94, 35–79. [DOI] [PubMed] [Google Scholar]
- van Veen V, and Carter CS (2006). Error detection, correction, and prevention in the brain: a brief review of data and theories. Clin EEG Neurosci 37, 330–335. [DOI] [PubMed] [Google Scholar]
- Wessel JR (2018). An adaptive orienting theory of error processing. Psychophysiology 55. [DOI] [PubMed] [Google Scholar]
- White MG, Panicker M, Mu C, Carter AM, Roberts BM, Dharmasri PA, and Mathur BN (2018). Anterior Cingulate Cortex Input to the Claustrum Is Required for Top-Down Action Control. Cell Rep 22, 84–95. [DOI] [PMC free article] [PubMed] [Google Scholar]
- Zhang S, Xu M, Kamigaki T, Hoang Do JP, Chang W-C, Jenvay S, Miyamichi K, Luo L, and Dan Y (2014). Long-range and local circuits for top-down modulation of visual cortex processing. Science 345, 660–665. [DOI] [PMC free article] [PubMed] [Google Scholar]
Associated Data
This section collects any data citations, data availability statements, or supplementary materials included in this article.
Supplementary Materials
Data Availability Statement
The datasets and the code that support the findings of this study are available from the Lead Contact upon reasonable request.