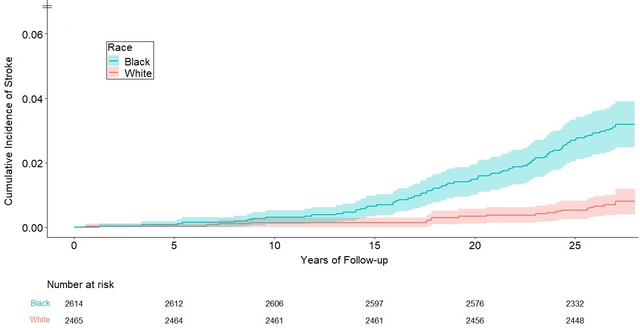
Figure 1.
Age- and sex-adjusted cumulative incidence curves for total stroke in black vs. white participants (n = 5,079 subjects; 100 stroke cases), with death treated as a competing event using the Fine and Gray method (P < 0.001 for the race comparison). Colored areas around the curves represent 95% confidence intervals.

