

Abstract
As the reliance on metabolic biomarkers within drug discovery and development increases, there is also an increased demand for global metabolomics methods to provide broad metabolome coverage and sensitivity towards differences in metabolite expression and reproducibility. A systematic approach is necessary for the development, and evaluation, of metabolomics methods using either conventional techniques or when establishing new methods that allow for additional gains in sensitivity and a reduction in requirements for amounts of a biological sample, such as those seen with methods based on microseparations. We developed a novel standard mixture and used a systematic approach for the development and optimization of optimal, ion-pair free, liquid chromatography-mass spectrometry (LC-MS) global profiling methods. These methods were scaled-down to microflow-based LC separations and compared with analytical flow ion-pairing reagent containing methods. Average peak volume improvements of 7- and 22-fold were observed in the positive and negative ionization mode microflow methods as compared to the ion-pairing reagent analytical flow methods, respectively. The linear range of the newly developed microflow methods showed up to a 10-fold increase in the lower limit of detection in the negative ionization mode. The developed microflow LC-MS methods were further evaluated using wild-type mouse plasma where up to a 9-fold increase in peak volume was observed.
Keywords: Metabolomics, Microflow LC, LC-MS, Metabolic profiling, Microbore columns, Increased sensitivity in metabolomics
1. Introduction
Metabolomics is the study of endogenous and exogenous small molecule metabolites in a biological system (tissue, cell, or biological fluid). Metabolites, the substrates and end products of multiple enzymatic reactions essential to cellular function, are responsive to both genetic and non-genetic factors making them arguably a better representation of overall health status than protein or gene expression [1]. They are also considered to be more representative of a disease phenotype allowing for the establishment of biomarkers indicative of physiological state [2–4]. Therefore, there is an increased reliance on metabolic biomarkers within drug discovery and development to monitor the disease, establish phenotypic screens, understand mechanisms of action for active compounds, and to monitor drug candidates in vivo and clinical studies [5–7].
Global, untargeted metabolomics experiments are hypothesis-free, where the aim is to detect and measure as many metabolites as possible within a biological sample. The types of metabolites being measured, however, are influenced by sample type (urine vs. plasma), extraction procedure, and analytical method. The analytical techniques commonly used for metabolomics-based methods are nuclear magnetic resonance (NMR) [8–10], and mass spectrometry (MS) coupled to either capillary electrophoresis (CE) [11], liquid chromatography (LC) [12], or gas chromatography (GC) [13, 14]. High resolution mass spectrometers, such as a quadrupole time-of fights and orbitraps, are increasingly being used for MS-based metabolomics studies [15, 16]. Attempts have been made to support metabolomics studies with the introduction of ion mobility separations [17, 18], but this is still considered an emerging technique [16, 19]. The majority of untargeted profiling methods are performed by reversed-phase LC-MS [12]. While reversed-phase LC (RPLC) separations cover a large part of the metabolome, they do not adequately retain very polar (or ionic) analytes such as organic acids, many amino acids, and carbohydrates. Polar molecules such as ATP and other nucleotides can also suffer from peak tailing when analyzed by RPLC methods. As these metabolites are involved in many important biological pathways, alternative separation mechanisms are often needed. Hydrophilic interaction liquid chromatography (HILIC) is one method being increasingly used for the targeted analysis of polar metabolites [20, 21] and for global metabolomic profiling [22]. Another commonly used technique is based on the use of mobile phase modifiers such as ion-pairing reagents. Ion pair chromatography is routinely used for the analysis of nucleotides [23, 24] as the amphiphilic amine group of the ion-pairing reagent will interact with the negative charge of the nucleotide allowing for increased retention and less peak tailing. The benefits of ion-pair chromatography have been shown in quantitative metabolomics studies of additional polar metabolites [25–27] but are becoming more common in untargeted metabolomic studies [28, 29]. While these reagents allow for increased retention of very polar analytes and improved peak shape, there are also significant disadvantages, including ion suppression, reduced electrospray ionization (ESI) sensitivity, and lingering instrument contamination [30–32].
Historically LC-MS-based metabolomics methods have been performed using conventional analytical flow conditions (column i.d. of 2.1 mm or greater and flow rates above 0.1 mL/min). However, the benefits of microflow liquid chromatography (column i.d. of 1 mm or lower and flow rates less than 50 μL/min) are broadly recognized and include reduced sample and solvent consumption, reduction in generated waste, increased sensitivity due to better ESI ionization and ion transfer efficiency, and reduced ionization suppression by the sample matrix [33–35]. With the continued advances in microflow LC (microLC) columns and instrumentation [36], more microflow-based separations are being applied for the analysis of small molecule metabolites [37–40]. In one example, Ma et al. [41] developed a microLC-MS-based metabolomics method using a 1 mm i.d. column to profile the polyphenol content in different varietals of red wine. To highlight the benefits of a microLC method, Christianson et al. [42] quantified methotrexate using both HPLC-MS/MS and microLC-MS/MS methods. The microflow method used 20x less solvent and demonstrated ESI signal-to-noise gains of 14x as compared to the analytical-scale HPLC method. Gray et al. [43] developed a microbore (1 mm i.d. column) LC-MS-based metabolic phenotyping method that resulted in a 2 – 3 fold increase in response as compared to a conventional 2.1 mm i.d. column. Nanoflow LC-MS methods, typically used for proteomics applications, have recently been applied for global metabolomics studies due to the sensitivity benefits seen with low flow LC-MS methods [29, 44, 45]. However, as nanoflow separations require longer run times, microLC is attractive as it allows one to gain the benefits of low flow without a significant run time penalty.
In this work, the benefits of microLC separations were tested for a global, untargeted metabolomic LC-MS method. Through the systematic testing and optimization of up to 42 column-mobile phase conditions, optimal ion-pair free global analytical flow profiling methods were developed in both the positive and negative ESI modes. The selected methods were successfully scaled down to a microflow LC separation using 0.3 mm i.d. columns and flow rates ranging from 6 to 8 μL/min. The newly developed and optimized analytical flow and microflow techniques were compared to ion-pairing methods, developed and successfully implemented in-house, in terms of metabolite coverage, sensitivity, and linear response. Method optimization and evaluation was carried out using a standard mixture, developed in-house, that includes analytes representing multiple classes of metabolites. Two microflow-based methods were developed to be used either with positive or negative ESI detection, respectively. The advantage of these methods as compared to the analytical flow ion-pair-based counterparts were demonstrated in terms of sensitivity and analyte coverage in both the standard mixture and a biological matrix, wild-type mouse plasma. The smaller injection volume required for the microflow-based separations allows for the potential reduction in sample size requirements for global metabolomics studies.
2. Materials and Methods
2.1. Chemicals
LC-MS grade water and LC-MS grade ammonium acetate were purchased from Fisher Scientific (Morris Plains, NJ). LC-MS grade acetonitrile was purchased from J.T. Baker (Phillipsburg, NJ). LC-MS grade formic acid and LC-MS grade ammonium fluoride were purchased from Honeywell Fluka (Sigma-Aldrich, St. Louis, MO). Analytical grade standards were purchased from various companies, as described in supplementary materials. A standard mixture containing 62 metabolites was prepared at a final concentration of 10 μg/mL in water. Individual aliquots of this mixture were stored at −20 °C and used in all experiments. All other analytical grade reagents, including ammonium formate, ammonium acetate, and acetic acid, were purchased from Sigma-Aldrich (St. Louis, MO).
2.2. Samples and Sample Preparation
Standard mixture: Aliquots of the standard mixture were diluted from the 10 μg/mL stock in water to the specified concentration levels. Plasma: Blood from WT mice was collected via retro-orbital bleed into K2EDTA tubes and centrifuged at 10,000 rpm for 10 minutes to separate the plasma. The plasma was then collected into fresh tubes and stored at −80 °C. Five individual plasma samples were pooled, aliquoted (50 μL), and stored at −20 °C. Aliquots of the pooled plasma sample (10 μL) were subjected to protein precipitation by mixing with methanol (5 μL) and water (110 μL) at room temperature and centrifugation (10,000 rpm, 5 min). The supernatant was subjected to sequential dilutions in water. Animals were cared for in an AAALAC-accredited facility in accordance with the guidelines established by the National Research Council. Animals had access to food and water ad libitum.
2.3. Column Selection for LC-MS Global Metabolomics Profiling
Eighteen RPLC columns (supplementary materials) were evaluated and compared under different mobile phase conditions on an Acquity UPLC (Waters Corporation, Milford, MA) hyphenated to an Exactive™ mass spectrometer (Thermo Fisher Scientific, San Jose, CA). The standard mixture was analyzed with each column using the following gradient: hold 0.1% B for 1 min, ramp to 99% B to 15 min, hold 99% B, then re-equilibrate at 0.1% B for a total run time of 20 min. A column temperature of 30 °C and a flow rate of 0.5 mL/min were used for all conditions. Samples were kept at 10 °C in the autosampler, and the injection volume was 10 μL. Mobile phases tested- 1: (A) 0.1% formic acid in water and (B) 0.1% formic acid in acetonitrile; 2: (A) 10 mM ammonium acetate in water, pH 5.8 and (B) acetonitrile; 3: (A) 10 mM ammonium formate in water, pH 9 and (B) acetonitrile; 4: (A) 0.1% formic acid in water and (B) 30 mM ammonium formate in 30:70 water:acetonitrile.
2.4. Method Optimization for LC-MS-Based Global Metabolomics Profiling
Further optimization of selected conditions was performed using an Acquity I-Class UPLC (Waters Corporation, Milford, MA) coupled to a Q Exactive™ mass spectrometer (Thermo Fisher Scientific, San Jose, CA). The standard mixture was analyzed using the above-described 20 min method as well as a longer, shallower gradient, 26 min method (hold 0.1% B for 1 min, ramp to 99% B to 21 min, hold 99% B, then re-equilibrate at 0.1% B). A flow rate of 0.5 mL/min was used for most conditions. The flow rate was lowered to either 0.4 or 0.45 mL/min for the Imtakt Scherzo columns due to the lower pressure limit, as specified by the vendor, for these columns (supplementary materials). Samples were kept at 10 °C in the autosampler, and the injection volume was 10 μL. Column temperature, mobile phase composition, and pH were altered as described in the supplementary materials.
2.5. Method Development for Microflow-LC-MS-Based Global Metabolomics Profiling
Microflow LC separation of selected conditions was performed on an Acquity M-Class UPLC (Waters Corporation, Milford, MA) hyphenated to a Q Exactive™ mass spectrometer. The LC columns (0.3 × 100 mm) chosen for LC development were the Waters HSS T3, Waters HSS SB C18, Phenomenex Luna Omega Polar C18, Imtakt Scherzo SS-C18, and Imtakt Scherzo SM-C18. The standard mixture was analyzed using a 30 min method (hold 0.1% B for 1 min, ramp to 99% B to 21 min, hold 99% B, then re-equilibrate at 0.1% B). Specific mobile phase compositions for each column tested can be found in the supplementary materials. For positive ESI mode experiments, a flow rate of 7 μL/min was used for the Imtakt Scherzo column, while a 10 μL/min flow rate was used for all other conditions. A 6 μL/min flow rate was used for all negative ESI mode experiments. Samples were kept at 10 °C in the autosampler, and the injection volume was 1 μL. A column temperature of 40 °C was used for all conditions.
2.6. MicroLC-MS-Based Global Metabolomics Profiling Studies- Optimized Method
Microflow LC separation was performed on an Acquity M-Class UPLC hyphenated to a Thermo Q Exactive™ mass spectrometer. Positive ion mode analysis was performed on a Waters HSS SB C18, 0.3 × 100 mm, 1.8 μm column with a flow rate of 8 μL/min. Mobile phases consisted of 0.1% formic acid in water (A) and 0.1% formic acid in acetonitrile (B). Negative ion mode analysis was performed on an Imtakt Scherzo SM-C18, 0.3 × 100 mm, 3.0 μm column with a flow rate of 6 μL/min. Mobile phases consisted of 10 mM ammonium acetate in water pH 5.8 (A) and acetonitrile (B). Separation in both modes was accomplished using a gradient as follows: hold 0.1% B for 1 min, ramp to 99% B to 15 min, hold 99% B, then re-equilibrate at 0.1% B for a final run time of 24 min. In both cases, samples were kept at 10 °C in the autosampler, the injection volume was 0.8 μL, and the column temperature was maintained at 40 °C.
2.7. Mass Spectrometry
Mass spectrometry for the LC column evaluation was performed on an Exactive™ mass spectrometer in full scan mode with an m/z range of 60 to 1,000 in both the positive and negative ESI modes at a resolution setting of 50,000 (m/z 200). All other studies were performed on a Q Exactive™ mass spectrometer in full scan mode with an m/z range of 67 to 1,000 in both the positive and negative ion modes at a resolution setting of 70,000 (m/z 200). All additional ESI source parameters are further described in the supplementary materials. Experiments were performed with a Thermo Scientific Ion Max source with a HESI-II probe (Thermo Fisher Scientific, San Jose, CA). A 32-gauge stainless steel needle was used for all analytical flow experiments, and a 34-gauge stainless steel needle was used for all microflow experiments.
2.8. Data Analysis
LC-MS data files from all analytical flow LC-MS optimization studies were processed by Compound Discoverer™ version 2.0 (Thermo Fisher Scientific, San Jose, MA) for peak alignment, detection, and integration (peak area). An in-house scoring system was developed to evaluate column performance based on analyte retention, isomer separation, peak area, and peak shape (additional details are provided in the supplementary materials). Peak alignment, detection, and integration (peak volume and height) for all microflow studies and final comparison studies were carried out using the GeneData Expressionist (GeneData, Lexington, MA) software package versions 11.0 to 13.0. All graphs were prepared in Prism 7 software (GraphPad Software, San Diego, CA). For all peak characteristic calculations, the profile of each extracted ion chromatogram for the representative analytes was exported from the Chromatogram Peak Edit node within Refiner MS (GeneData Expressionist) and processed using the Excel-based program Chromophoreasy [46]. Additional data processing was performed using an in-house developed R-script.
3. Results and Discussion
3.1. Column Selection and Standard Mixture Development
The metabolome is comprised of a diverse set of endogenous small molecules with a broad range of physicochemical properties. Because of this diversity, it is difficult to develop a single LC method with sufficient separation, retention, peak shape, detection limit, and linear range for every single metabolite within the metabolome. To establish a method that would be suitable for a wide range of analytes, eighteen columns from seven vendors were selected to screen for method development. These columns are commercially available and are of a similar dimension (2 × 100 mm). They are also packed with fully porous C18 silica-based beads with different surface chemistries. Where possible, columns were chosen with particle sizes sub-2 μm to ensure high peak capacity and improved separation efficiency for the complex sample matrices studied with metabolomics studies. Performance assessment of various columns is important as the choice of the stationary phase has a significant effect on selectivity and retention due to their different mechanisms of interaction [47–50]. For instance, stationary phases containing a phenyl group (such as the ACE Excel C18-AR column) provide π-π interactions with analytes containing electron-rich double bonds and are ideal for separating analytes with π electrons. Polar end-capped and polar-embedded C18 columns, on the other hand, have enhanced hydrogen bonding and are compatible with highly aqueous mobile phases. The Imtakt USA mixed-mode columns not only have ODS ligands but also anion and cation ligands to provide reversed-phase and ionexchange separation mechanisms. These columns have improved retention of polar compounds and enable separation of many polar analytes without the need for ion-pairing reagents.
To profile these columns, a standard mixture of metabolites was developed as no singular complex standard mixture is commercially available that can be used for the optimization of metabolomics methods. This mixture was comprised of 62 analytes representing different metabolite classes with a wide array of physicochemical properties. These compounds represent different metabolic pathways and have a broad LogP range (−6.69 – 6.09), which helps to ensure coverage of both hydrophilic and hydrophobic analytes. In addition to the retention of polar metabolites that our in-house ion-pair chromatography method provides, it also allows for the separation of some isomers of very hydrophilic metabolites, which we wished to maintain as often distinguishing between isomers is important. 3-Methylhistidine, for instance, originates from skeletal muscle and is used as a measure of muscle protein turnover [51, 52]. While 1-methylhistidine is not formed in humans but derived from the dipeptide anserine found in meats. As its source is dietary in nature, 1-methylhistidine is commonly used as a marker of meat consumption [53]. In order to test for the separation of such metabolites in the newly developed methods, two sets of positional isomers (leucine/isoleucine and 1-/3-methylhistidine) were included in the mixture.
The standard mixture was profiled on the eighteen reversed-phase LC columns under acidic (pH 2.8) and near-neutral (pH 5.7) conditions. Four columns (Waters CSH C18, Phenomenex Synergi Fusion- RP, Millipore Purospher STAR, and Thermo Scientific Hypersil Gold AQ) were further profiled under basic (pH 9) conditions in the negative ESI mode as the other stationary phases tested were not stable at high pH. The two Imtakt Scherzo columns were further tested using recommended eluent conditions where mobile phase A is acidic (formic acid, pH 2.8), and mobile phase B contains an ammonium salt (30 mM formate). ESI source parameters were optimized in both ionization modes and are reported in the supplementary materials. In all, a total of 38 and 42 conditions (different column and commonly used mobile phase pairings) were tested in both the positive and negative ionization modes, respectively. The average peak area for all detected analytes for each condition tested is shown in Figure S1. Different combinations of columns and mobile phase pairings were evaluated to identify those that would yield better peak shapes, analyte retention, and ionization efficiency. Due to the abundance of data, this profiling study generated, a two-step scoring system (see supplementary materials for more detail) was developed to identify the better-performing methods. The results of each condition tested were first scored based on analyte coverage, retention factor, peak area, and the ability to separate the positional isomers (leucine/isoleucine and 1-methylhistidine/3-methylhistidine). To further refine the selection of the better-performing columns, the peak shapes for individual analytes were visually examined for those conditions with a first-round score of 3 or higher. Peaks with sub-optimal shapes (significant tailing, splitting, broad elution range) were tallied, and the percent of analytes with an undesired shape was determined. Those columns with a final score of 4 or above were chosen for method optimization. Extracted ion chromatograms of a 500 ng/mL standard mixture are shown in Figure 1 for the selected positive and negative ion mode separations.
Figure 1.

Extracted ion chromatograms of all 62 analytes (10 ppm) present in a 500 ng/mL standard mixture analyzed using the conditions selected for further method optimization. A) Positive ESI mode detection - Top to bottom: column-mobile phase conditions: Waters HSS T3- FA, pH 2; Waters HSS SB C18- FA, pH 2; Phenomenex Luna Omega Polar C18- FA, pH 2; Imtakt Scherzo SS-C18-Mixed Mode. B) Negative ESI mode detection- Top to bottom: column-mobile phase conditions: Imtakt Scherzo SS-C18-AmAc, pH 5; Imtakt Scherzo SM-C18-AmAc, pH 5; Imtakt Scherzo SS-C18-Mixed Mode.
3.2. LC-MS Method Optimization
Further optimization of the selected conditions was performed to improve the separation performance through adjustments in gradient length, column temperature, mobile phase composition, and mobile phase pH. A change in the LC method to a shallower 21 min gradient, from the original 15 min gradient, yielded a modest improvement in peak resolution but otherwise did not improve the method performance significantly (data not shown). While adjusting the column temperature from 30 °C – 70 °C shifted peaks to earlier retention times, the higher temperatures did not provide any significant benefits to peak area in either ionization mode (Figure S2). Based on these studies, a column temperature of 40 °C was chosen for the optimized method as a slight decrease in peak area, and a reduced resolution between the peaks corresponding to isomers were observed at higher temperatures in some of the conditions tested.
Additional positive ESI mode method optimization was centered on the composition of mobile phase B in the Imtakt Scherzo SS-C18 mixed-mode method. As shown in Figure 2, the concentration of ammonium formate (AmF) was lowered to 20 mM and 10 mM, while the percentage of acetonitrile was raised to 90%. Being able to run the method to a higher percent organic (90% vs. 70%) extended the analyte coverage by allowing for some of the more hydrophobic analytes to elute from the column. Furthermore, reducing the salt content (30 mM to 20 mM) allowed for some reduction in ion suppression, as seen by an increase in peak area for a majority of the analytes measured. While further reducing the salt content to 10 mM provided better ionization efficiency for some analytes, for others, it reduced the ionization to such an extent where the analyte could no longer be detected. Based on these results, we chose a mobile phase B of 20 mM AmF in 90:10 acetonitrile:water to decrease the adverse effects of ion suppression and reduce the retention factors of more hydrophobic analytes.
Figure 2.

Effect of mobile phase B composition on the peak area of 39 standard compounds in the positive ESI mode. The standard mixture (100 ng/mL) was separated on an Imtakt Scherzo SS-C18 column with a column temperature of 40 °C and the 20 min LC method. Mobile phase A was 0.1 % formic acid in water for all conditions tested. The injection volume was 10 μL. Data points and error bars represent average peak area results and standard deviation for three replicate analyses. The scale of the X-axis is log 10.
In the negative ESI mode optimization studies, the ammonium salt concentration in mobile phase A was decreased, as shown in Figure 3. Under these conditions, reducing the ionic strength of mobile phase A from 10 mM to 5 mM ammonium acetate (AmAc) resulted in an improved analyte coverage but also lower peak areas. As previous studies [54–56] had reported up to a 10-fold improvement in signal intensity when ammonium fluoride (NH4F) was used as an eluent additive for LC-MS, a 1 mM NH4F solution (pH 5.4) was tested as an alternative mobile phase for negative ESI mode global metabolomics profiling. When compared to the analyte average peak areas obtained with the AmAc solutions (Figure 3), a noticeable increase in peak area was observed for most of the analytes with the largest differences seen with 17a-hydroxyprogesterone and cytosine. These two analytes had a 297.4-fold and a 9.0-fold improvement in peak area over the 10 mM AmAc mobile phase, respectively, when analyzed using the Imtakt Scherzo SM-C18 column. Another benefit previously observed when NH4F was used in the mobile phase is an improvement in the quality of LC separation [54]. As shown in Figure S3, an improvement in peak shape (less peak tailing) and peak intensity is seen for the NH4F mobile phase as compared with the 10 mM AmAc mobile phase.
Figure 3.
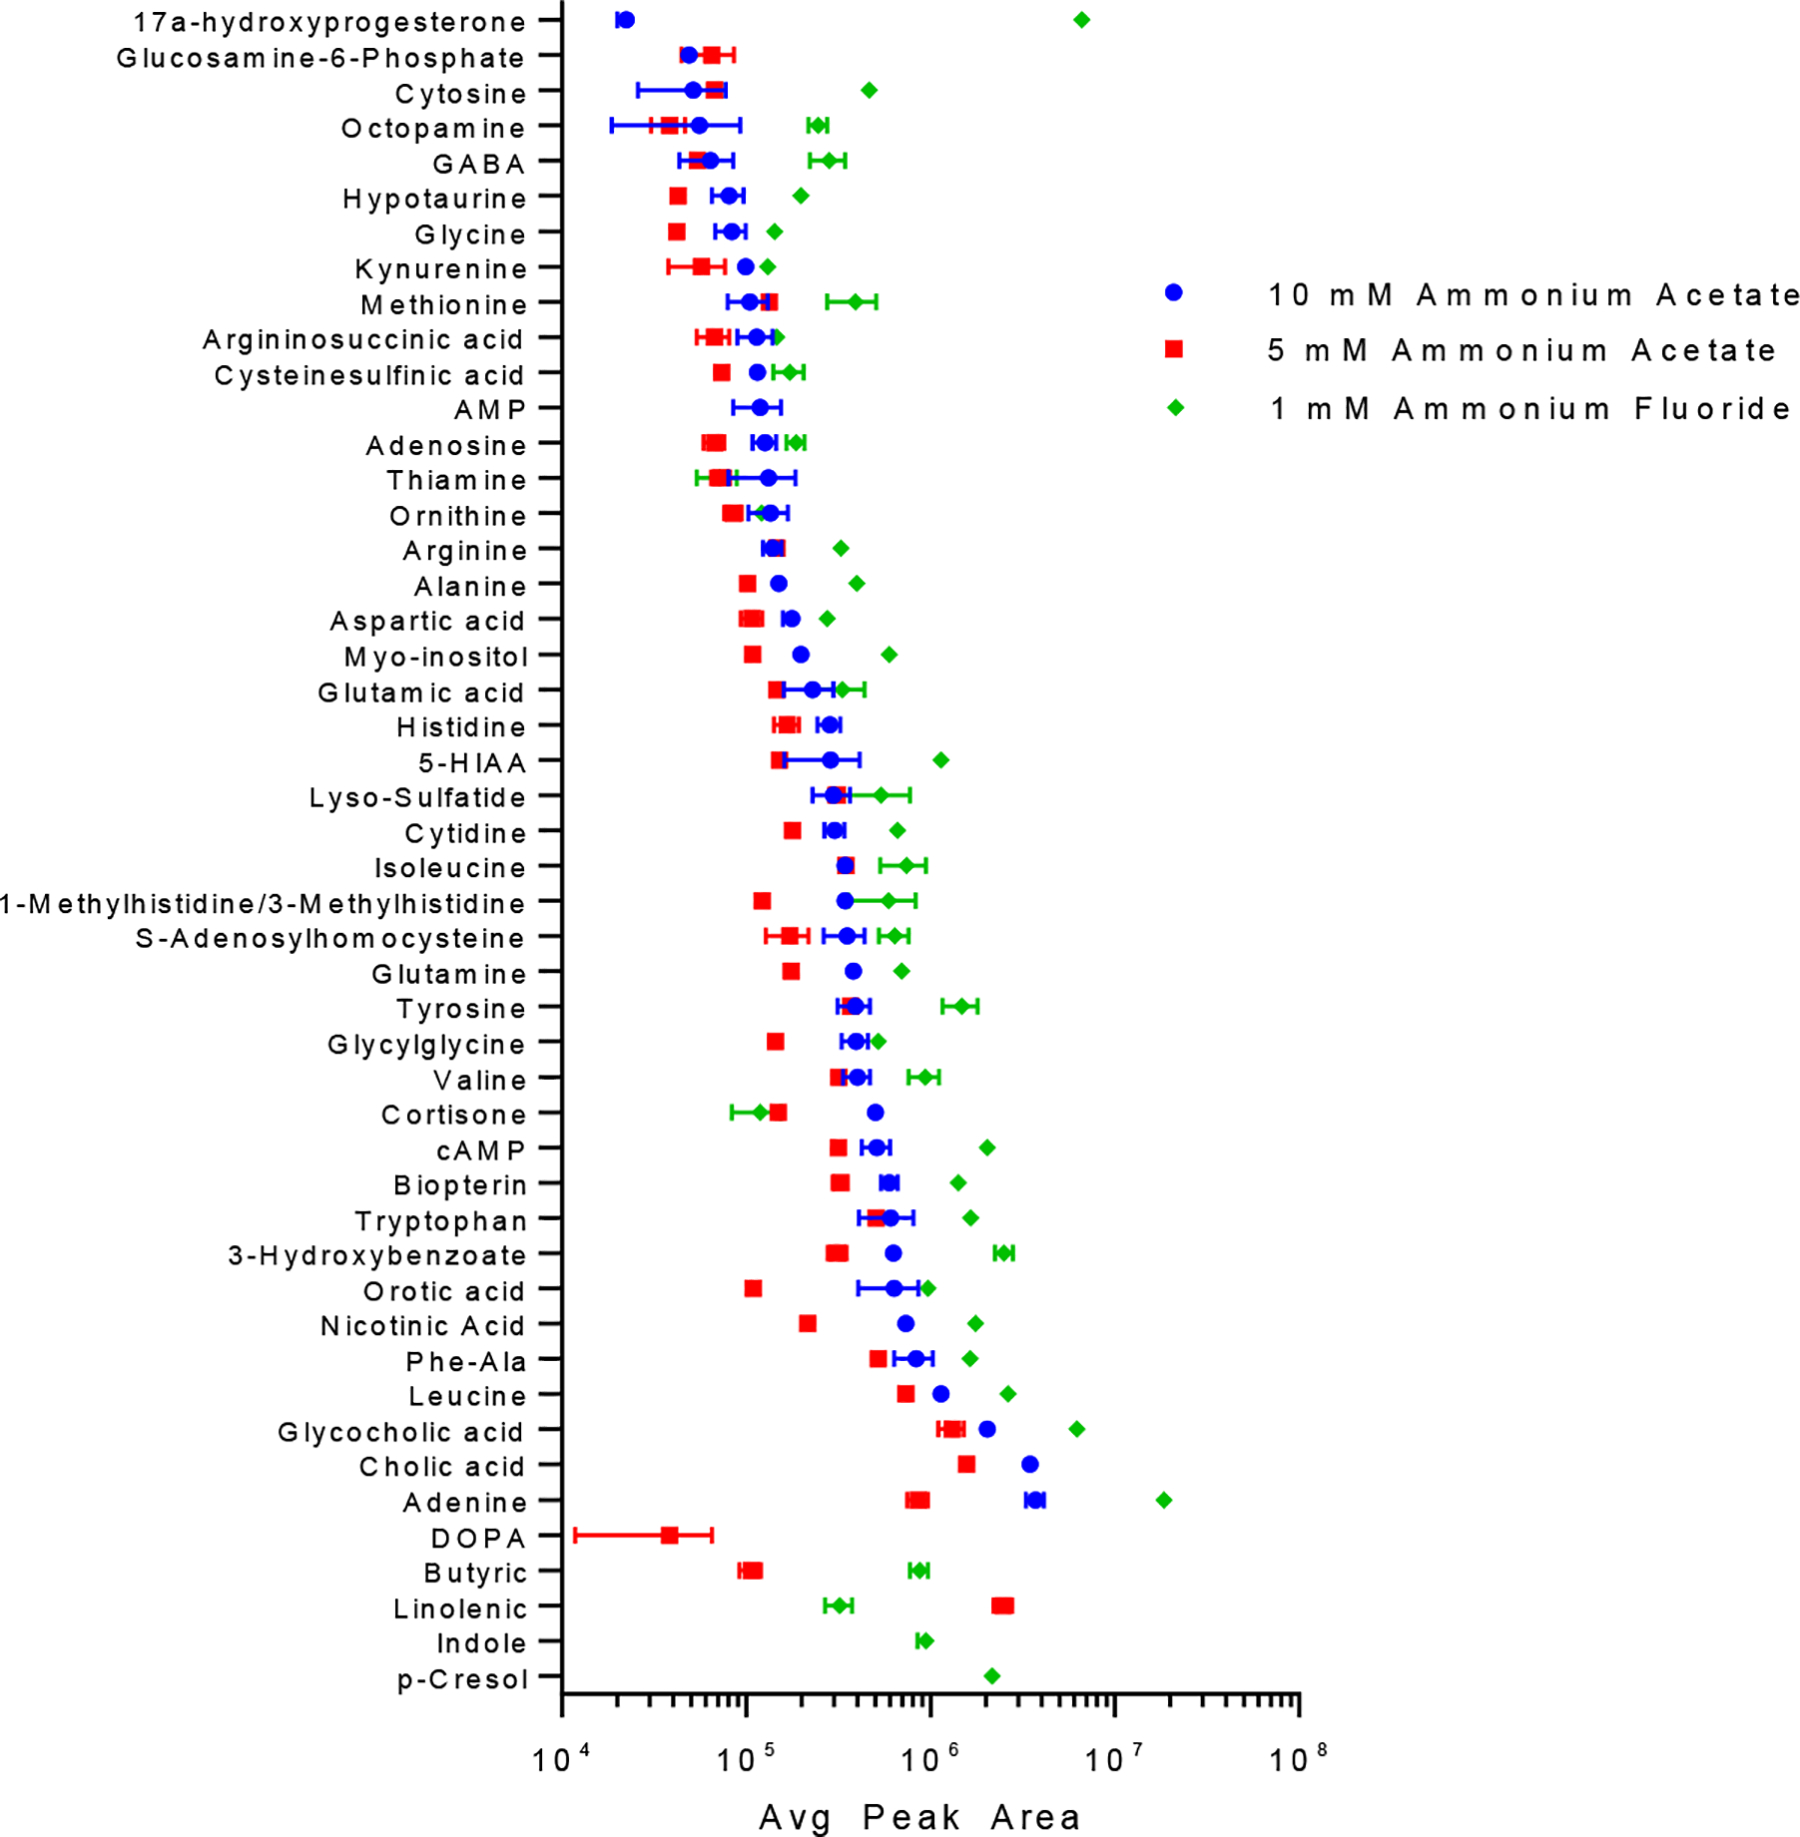
Effect of mobile phase A composition on the peak areas of 49 standard compounds in the negative ESI mode. The standard mixture (100 ng/mL) was separated on an Imtakt Scherzo SM-C18 column with a column temperature of 40 °C and the 26 min LC method. Mobile phase B was acetonitrile for all conditions tested. The injection volume was 10 μL. Data points and error bars represent average peak area results and standard deviation for three replicate analyses. The scale of the X-axis is log 10.
As a significant difference in the average peak area was not observed between those columns analyzed at pH 5.8 and those at pH 9.0 in the negative ESI mode (Figure S1–B), the effect of mobile phase pH on the AmAc and NH4F mobile phases was examined further (Figure S4). The average peak area for the measured analytes decreased as the pH increased with the NH4F mobile phase, while the peak areas in mobile phases containing AmAc were less affected. Similar data were obtained with the Imtakt Scherzo SS-C18 column (not shown). The effect of mobile phase pH was not examined in the positive ion mode due to the significant decrease in average peak area seen between the formic acid (FA) mobile phases (pH 2.8) and the AmAc mobile phases (pH 5.8) as shown in Figure S1–A. Based on the negative ESI mode LC-MS method optimization studies, both the 10 mM AmAc, pH 5.8, and 1 mM NH4F mobile phases were found promising and used in future experiments.
3.3. Microflow Method Selection
The optimized analytical flow methods (see supplementary materials) were scaled down to microflow LC-MS-based methods using 0.3 × 100 mm columns packed with identical stationary phases as in the optimized analytical-scale methods. For a comparison of equivalent conditions between columns with different internal diameters, we maintained the linear velocity constant unless the backpressure on microflow columns exceeded the limit specified by the vendor, in which case the flow rate and thus linear velocity were lowered. ESI source parameters were optimized for microflow analysis and are reported in the supplementary materials. Peak area, as was used for the analytical flow comparisons, is the parameter generally applied in the quantitative comparative analysis of metabolomics studies. However, the data processing software used for the microflow comparison studies quantifies the volumes of threedimensional peaks as plotted on a retention time vs. m/z vs. MS signal intensity. A more detailed description of the peak volume-based quantitative analysis is included in the supplementary information.
The average peak volume and average peak height results for all analytes detected in the positive and negative ESI mode analyses are reported in Figure 4 and Figure S5, respectively. As a similar improvement in analyte sensitivity has been reported when NH4F is used as the eluent additive in the positive ion mode [54, 55], this mobile phase combination was tested in both ionization modes. However, for both ionization modes, the sensitivity improvement was not as significant as was observed in the analytical flow method. Since our experiments did not show a significant benefit when using NH4Fcontaining mobile phases, and due to concerns on the detrimental effect that NH4F has on column performance when switching between mobile phase additives, as previously described [54] and observed in our experiments, we decided not to pursue it further.
Figure 4.

Comparison of the average peak volume from methods chosen for scale down to microflow-based LC separations in the A) positive ESI mode and B) negative ESI mode. The standard mixture (100 ng/mL) was separated on 0.3 × 100 mm columns with a column temperature of 40 °C using a 30 min LC method. The injection volume was 1 μL. Data points and error bars represent average peak volume results and standard deviation for three replicate analyses. The scale of the X-axis is log 10. FA: formic acid mobile phases; AmAc: ammonium acetate mobile phases; Mixed: mixed-mode methods; AmF: Ammonium formate; NH4F: Ammonium fluoride
To further evaluate the performance of the methods, a subset of representative analytes (see supplementary materials) was used to calculate peak characteristics such as USP tailing factor and half-height peak width. The total number of analytes in the subset (13 and 14 for the negative and positive ionization modes, respectively) was chosen because it covers at least 25% of the total number of analytes measured in each ionization mode. The specific analytes were chosen because they were present in a majority of the tested conditions and covered a wide retention window. To ensure the subset was truly representative, both analytes that typically demonstrated symmetrical Gaussian peak shapes and those with less ideal peak shapes (some tailing) were specifically chosen. The half-height width (w0.5), asymmetry factor (As), US Pharmacopeia tailing factor (Tf), and plate number (N) are summarized in Tables S1 and S2 for all column-mobile phase conditions tested. From comparisons using the abovelisted parameters, as well as analyte coverage (Tables S1 and S2) and average peak volume (Figure 4), we determined that the most promising positive and negative ESI mode methods for this application were the Waters HSS SB C18 column with formic acid mobile phases and the Imtakt Scherzo SM-C18 column with ammonium acetate mobile phases, respectively.
3.4. Microflow vs. Analytical Flow Method Comparisons
While gains in sensitivity are compound dependent, up to a 49-fold increase can be expected with lower flow rates and 0.3 mm i.d. columns as compared to a 2.1 mm column [57, 58]. This increase in sensitivity is due to the increased ionization efficiency, decreased ion suppression, and increased ion transmission into the mass spectrometer that can be achieved when a lower flow rate is used in the LC separation [59]. Initial comparisons between the RP analytical flow and microflow methods were performed where the LC gradient and mobile phase linear velocity was kept constant. While an average 4.0-fold and 2.1-fold improvement in peak volume was observed in the positive and negative ESI modes respectively (data not shown), further optimization using the standard mixture was carried out to improve the microflow method performance. Evaluated parameters included LC flow rate, LC gradient, extracolumn effects (i.e., pre-and post-column tubing diameter), and injection volumes for both ionization modes as is described in the supplementary materials.
To test the performance of the optimized microflow and RP analytical flow LC methods presented here, the standard mixture (100 ng/mL) was analyzed using both methods with a fixed injection volume (0.8 μL). This volume (0.8 μL) represents a 12.5-fold reduction in sample injection volume as compared to the analytical flow methods (10 μL). These results were also compared with ion-pair chromatography methods (supplementary materials), which were established in-house and optimized to detect changes in the regulation of a wide range of endogenous metabolites (very hydrophilic to moderately hydrophobic) in biological fluids and tissue extracts. The average peak volume values for all analytes detected in the positive and negative ESI mode analysis are shown in Figure 5. As the results shown in the plots demonstrate, the average peak volume for most analytes was significantly increased in the microflow LC methods in both ionization modes. Some analytes, however, were only detected using either the microflow or ion-pairing methods, as shown in Figures 5 and S6. Some of the analytes only detected with the microflow LC methods were glycocholic acid, linolenic acid, and lyso-sulfatide in the positive ESI mode and 17a-hydroxyprogesterone, glutathione, and NAD+ in the negative ESI mode. Two analytes, cysteine, and octopamine, were only detected with the microflow methods in both ionization modes. Three of the analytes only detected using the negative ESI mode ion-pairing method were ADP, ATP, and CDP. These analytes are challenging to analyze using most reversed-phase methods due to their highlycharged nature. Therefore, most LC-MS methods developed to analyze this metabolite class use ion-pairing reagents [24, 60], specialized LC columns, specialized sample preparation steps [61–63], or involve a HILIC-based separation [64, 65].
Figure 5.

Comparison of analyte peak volumes for the standard mixture (100 ng/mL) analyzed using the optimized microflow, RP analytical flow, and ion-pair reagent containing methods. A) Positive ESI mode results. B) Negative ESI mode results. The injection volume was 0.8 μL for all methods. Data points and error bars represent average peak volume results and standard deviation for three replicate analyses. The scale of the X-axis is log 10.
While all data from this comparison study are reported as peak volume, additional plots using peak height are provided in the supplementary materials to complement the illustration of the impact of the method optimization efforts. The average peak height values for all analytes detected in the standard mixture in both ESI modes are shown in Figure S7. As compared to the peak volume results shown in Figure 5, the average peak height for most analytes was not increased as significantly in the microflow LC methods in either ionization mode. The reasons for this discrepancy, as detailed in the supplementary materials, are due to the difference in longitudinal diffusion between the three methods as well as the mechanistic differences inherent to a reversed-phase LC method as compared to an ion-pairing method.
The log2-fold change was calculated based on the peak volume results for all analytes present in both respective sample sets (microflow vs. RP analytical flow and microflow vs. ion-pairing method). In the negative ESI mode, all analytes detected using the optimized microflow method showed an increase in peak volume as compared to the other two methods. The log2-fold change ranged from 1.07 to 11.23 for the microflow vs. RP analytical flow method comparison with leucine/isoleucine having the largest gain in sensitivity with the scale down to a microflow-based separation. The log2-fold change range observed with this comparison is consistent with fold increases of 2.10 – 2401.97. For the microflow vs ion-pairing method comparison, the log2-fold change ranged from 1.53 to 7.17, with linolenic acid having the largest gain in sensitivity with the microflow method. The log2-fold change range observed with the microflow vs. ion-pairing comparison is consistent with fold increases of 2.89 – 144.01. The average fold improvement from both these comparisons are summarized in Table 1.
Table 1.
Average fold improvement of standard mixture analytes observed in the optimized microflow method as compared to the RP analytical flow and ion-pairing reagent methods.
| Average Fold Increase | Microflow vs. RP Analytical Flow Method | Microflow vs. Ion Pairing Method | ||
|---|---|---|---|---|
| Positive Ion Mode | Negative Ion Mode | Positive Ion Mode | Negative Ion Mode | |
| 100 ng/mL Standard Mixture | 6.5 | 9.8 | 7.1 | 22.6 |
| Linear Range Lower Limit | 10.0 | 2.0 | 1.0 | 10.0 |
| 50x diluted WT Mouse Plasma | 4.1 | 7.8 | 4.2 | 9.2 |
While the majority of the analytes detected with both sample sets in the positive ESI mode showed an increase in peak volume, a few analytes provided negative log2-fold change values indicating that those analytes performed better with the analytical flow methods than in the microflow methods. For the comparison to the RP analytical flow method, the 3 analytes (out of a total of 39 detected analytes) that underperformed with the microflow method, with their respective log2-fold changes shown in parentheses, were CMP (−0.02), thiamine (−0.35), and biopterin (−2.09). Excluding these analytes, the increase in log2-fold change ranged from 0.75 to 7.00 for the microflow vs. RP analytical flow method comparison, with 17a-hydroxyprogesterone having the largest gain in sensitivity with the scale down to a microflow-based separation. Four, out of a total of 39 detected analytes, were found to have a negative log2-fold change when the microflow method was compared to the ion-pairing method. These analytes were cysteinesulfinic acid (−0.43), methionine (−0.75), 6-biopterin (−1.35), and thiamine (−2.35). When these analytes were excluded, the increase in log2-fold change ranged from 0.04 – 7.76, with cortisone having the largest gain in sensitivity with the microflow method. As with the negative ion mode results, the average fold improvement values are summarized in Table 1.
Studies performed using global metabolomics profiling are qualitative in nature. However, it is important to know the linear (semi-quantitative) range of the method to ensure the differences observed between sample groups are not masked due to oversaturation of the instrument or not accurately measured as they are below the sensitivity limit of the instrument. Therefore, a series of ten standards were prepared from the standard mixture to test the linearity of the optimized microflow, RP analytical flow, and ion-pairing reagent containing methods. The linear response of each analyte detected was determined by comparing the peak volumes for each neighboring standard concentration. An analyte was deemed to have a linear response if the theoretically expected ratio was consistent with the experimentally observed increase in signal. The overall semi-quantitative range of each method represents the concentration range where 25% or more of the detected analytes have a linear response as visualized in Figure S8 and reported in Table S3. The linear range for the positive ESI mode microflow method was determined to be 0.5 – 2,000 ng/mL, while the RP analytical flow method had a linear range from 5 – 2,000 ng/mL. This difference represents a 10-fold improvement in linear range lower limit gained by moving from a 2.1 mm i.d. column to a 0.3 mm column. A difference in the linear range, however, was not observed between the microflow method and the ion-pairing method. This is not unexpected as the linear range was determined based on the standard mixture analytes detected by each method, and some of these analytes have been shown to perform better in the ion-pairing method as compared to the microflow-based method. In the negative ESI mode, a 2-fold and a 10-fold improvement in the linear range lower limit was observed between the microflow method and the RP analytical flow and ion-pairing methods, respectively. These results are summarized in Table 1.
3.5. Comparative Performance in Analysis of Biological Samples
To compare the method performance in a complex biological matrix, WT mouse plasma was analyzed at three dilution levels (25x, 50x, and 100x) using the optimized microflow, RP analytical flow, and ion-pairing methods. The average peak volumes and average peak heights for those analytes present in the standard mixture, and detected in the 50x diluted plasma samples, are shown in Figure 6 and Figure S9. As with the standard mixture, the log2-fold change was calculated based on the peak volume results for all analytes present in both respective sample sets. In the negative ESI mode, all analytes detected (12 common analytes in all methods) using the optimized microflow method showed an increase in peak volume as compared to the other two methods. The log2-fold change ranged from 1.97 – 4.54 and 1.98 – 6.41 for the microflow vs. the RP analytical flow and ion-pairing method comparisons, respectively, which is consistent with fold increases of 3.9 – 23.3 and 3.9 – 85.0. The positive ESI mode, however, had a larger number of analytes with negative log2-fold change values, possibly due to the excellent retention and peak shape of very polar analytes in the ion-pairing method. In the microflow vs. RP analytical flow method comparison, 21% of the common analytes had negative log2-fold change values (−1.23 to −0.20), while 41% of the common analytes detected in both the microflow and ion-pairing methods had a negative log2-fold change (−2.46 to −0.13). Excluding the negative values, the increase in log2-fold change ranged from 0.28 – 5.16 and 0.71 – 4.60 for the microflow vs. RP analytical flow and ion-pairing method, respectively, which is consistent with fold increases of 1.2 – 35.8 and 1.6 – 24.3. The average fold improvement for both ionization modes is summarized in Table 1.
Figure 6.

Comparison of a 50x diluted WT mouse plasma sample analyzed using the optimized microflow, RP analytical flow, and ion-pair reagent containing methods. A) Positive ESI mode results. B) Negative ESI mode results. The injection volume was 0.8 μL for all methods. Data points and error bars represent average peak volume results and standard deviation for three replicate analyses. The scale of the X-axis is log 10.
As was observed with the standard mixture, some analytes measured in the 50x diluted WT plasma samples were only detected by one of the methods (microflow, RP analytical flow, and ion-pairing), as shown in Figures 6 and S10. Two of the analytes only detected by the positive ESI mode microflow method, glycocholic acid and linolenic acid, were similarly only detected in the standard mixture by the microflow method. The three nucleotides (ADP, ATP, and CDP) only detected in the standard mixture by the ion-pairing method were likewise only detected in the plasma samples by the ion-pairing method. For several of the analytes not detected in the microflow method, the retention time of the observed peak was significantly shifted from that observed with the standard mixture. Due to this retention time shift, an accurate identification could not be made for hypotaurine and thiamine in the positive ESI mode and aspartic acid, histidine, and methionine in the negative ESI mode at this time. As a positive identification could only be made based on accurate retention time, only those analytes present in the standard mixture were examined for this initial study. There is the potential, however, to enable deeper metabolite profiling once additional standards are analyzed, and an internal database is populated with accurate retention times.
4. Conclusions
The systematic testing of eighteen reversed-phase LC columns was performed under acidic, basic, and near-neutral pH conditions. These columns and mobile phases were initially profiled using a novel standard mixture, developed in this study, to identify LC-MS conditions that provide the best analyte coverage, retention, and response. The analytes in the standard mixture were chosen both for their diverse nature and for their ability to be measured (and separated) by in-house global profiling methods with mobile phases containing ion-pairing reagents. From these studies, an overall improvement in the method performance was observed by scaling down to microflow separations. The average fold improvement in peak volume for the standard mixture analyzed using the newly developed microflow method as compared to the ion-pairing reagent method was observed to be 7- and 22-fold in the positive and negative ESI mode, respectively. The lower limit of the linear range also improved by up to 10-fold. This improvement in the method performance allowed for the detection of additional analytes with the microflow-based separations that were not previously measured by the reversed-phase analytical flow methods or the ion-pairing methods. A small number of analytes, however, did not show an improvement with the microflow method because their peak characteristics and separation were moderately better with the ion-pairing method, as is expected based on the fundamental differences between a reversed-phase separation and ion-pair chromatography. The optimized methods were further applied to the analysis of wild type mouse plasma samples to examine the benefit in a complex biological matrix. Average peak volume fold increases of 4.2- and 9.2-fold were observed for those standard mixture analytes detected in the mouse plasma sample in the positive and negative ionization modes, respectively. The microflow-based global metabolomics methods developed in this work demonstrate an improvement over their analytical flow ion-pair counterparts in terms of analyte coverage and sensitivity in both the developed standard mixture and a biological matrix. Furthermore, the 12.5-fold reduction in sample injection volume required for the microflow-based separation shows the potential for enabling working with sample size limited matrices.
Supplementary Material
Highlights.
The systematic optimization of global profiling metabolomics methods was conducted
Development of microflow-based global profiling methods using 0.3 mm i.d. columns
Microflow methods showed increases in peak volume for a biological matrix
Reduced sample volume shows potential applicability to limited biomedical samples
Development of a standard mixture for evaluation of global metabolomics methods
Acknowledgments
We would like to thank Nelson S. Yew for providing the mouse plasma samples. ARI would like to acknowledge Thermo Fisher Scientific for their support through a Technology Alliance Partnership (TAP) program. Funding: This work was funded by Sanofi. Additional funding was received from the National Institutes of Health under award numbers R01GM120272 (ARI), R01CA218500 (ARI), and R35GM136421 (ARI).
Footnotes
Publisher's Disclaimer: This is a PDF file of an unedited manuscript that has been accepted for publication. As a service to our customers we are providing this early version of the manuscript. The manuscript will undergo copyediting, typesetting, and review of the resulting proof before it is published in its final form. Please note that during the production process errors may be discovered which could affect the content, and all legal disclaimers that apply to the journal pertain.
Declaration of Competing Interests
The authors declare that they have no known competing financial interests or personal relationships that could have appeared to influence the work reported in this paper.
References
- [1].Nicholson JK, Lindon JC, Systems biology: Metabonomics, Nature 455(7216) (2008) 1054–6. 10.1038/4551054a. [DOI] [PubMed] [Google Scholar]
- [2].Baker M, Metabolomics: from small molecules to big ideas, Nature Methods 8 (2011) 117. 10.1038/nmeth0211-117. [DOI] [Google Scholar]
- [3].Johnson CH, Ivanisevic J, Siuzdak G, Metabolomics: beyond biomarkers and towards mechanisms, Nature Reviews Molecular Cell Biology 17 (2016) 451. 10.1038/nrm.2016.25. [DOI] [PMC free article] [PubMed] [Google Scholar]
- [4].Patti GJ, Yanes O, Siuzdak G, Metabolomics: the apogee of the omics trilogy, Nature Reviews Molecular Cell Biology 13 (2012) 263. 10.1038/nrm3314. [DOI] [PMC free article] [PubMed] [Google Scholar]
- [5].Jacob M, Lopata AL, Dasouki M, Abdel Rahman AM, Metabolomics toward personalized medicine, Mass Spectrometry Reviews 38(3) (2019) 221–238. 10.1002/mas.21548. [DOI] [PubMed] [Google Scholar]
- [6].Wishart DS, Emerging applications of metabolomics in drug discovery and precision medicine, Nature Reviews Drug Discovery 15 (2016) 473. 10.1038/nrd.2016.32. [DOI] [PubMed] [Google Scholar]
- [7].Zhao X, Modur V, Carayannopoulos LN, Laterza OF, Biomarkers in Pharmaceutical Research, Clinical Chemistry 61(11) (2015) 1343–1353. 10.1373/clinchem.2014.231712. [DOI] [PubMed] [Google Scholar]
- [8].Brennan L, NMR-based metabolomics: From sample preparation to applications in nutrition research, Progress in Nuclear Magnetic Resonance Spectroscopy 83 (2014) 42–49. 10.1016/j.pnmrs.2014.09.001. [DOI] [PubMed] [Google Scholar]
- [9].Marchand J, Martineau E, Guitton Y, Dervilly-Pinel G, Giraudeau P, Multidimensional NMR approaches towards highly resolved, sensitive and high-throughput quantitative metabolomics, Current Opinion in Biotechnology 43 (2017) 49–55. 10.1016/j.copbio.2016.08.004. [DOI] [PubMed] [Google Scholar]
- [10].Smolinska A, Blanchet L, Buydens LMC, Wijmenga SS, NMR and pattern recognition methods in metabolomics: From data acquisition to biomarker discovery: A review, Analytica Chimica Acta 750 (2012) 82–97. 10.1016/j.aca.2012.05.049. [DOI] [PubMed] [Google Scholar]
- [11].Ramautar R, Capillary electrophoresis-mass spectrometry for metabolomics, Cambridge: : Royal Society of Chemistry, 2018. [Google Scholar]
- [12].Gika HG, Theodoridis GA, Plumb RS, Wilson ID, Current practice of liquid chromatography–mass spectrometry in metabolomics and metabonomics, Journal of Pharmaceutical and Biomedical Analysis 87 (2014) 12–25. 10.1016/j.jpba.2013.06.032. [DOI] [PubMed] [Google Scholar]
- [13].Garcia A, Barbas C, Gas Chromatography-Mass Spectrometry (GC-MS)-Based Metabolomics, in: Metz TO (Ed.), Metabolic Profiling: Methods and Protocols, Humana Press, Totowa, NJ, 2011, pp. 191–204. 10.1007/978-1-61737-985-7_11. [DOI] [PubMed] [Google Scholar]
- [14].Lubes G, Goodarzi M, GC–MS based metabolomics used for the identification of cancer volatile organic compounds as biomarkers, Journal of Pharmaceutical and Biomedical Analysis 147 (2018) 313–322. 10.1016/j.jpba.2017.07.013. [DOI] [PubMed] [Google Scholar]
- [15].Miggiels P, Wouters B, van Westen GJP, Dubbelman A-C, Hankemeier T, Novel technologies for metabolomics: More for less, TrAC Trends in Analytical Chemistry 120 (2019) 115323. 10.1016/j.trac.2018.11.021. [DOI] [Google Scholar]
- [16].Segers K, Declerck S, Mangelings D, Heyden YV, Eeckhaut AV, Analytical techniques for metabolomic studies: a review, Bioanalysis 11(24) (2019) 2297–2318. 10.4155/bio-2019-0014. [DOI] [PubMed] [Google Scholar]
- [17].Harry EL, Weston DJ, Bristow AWT, Wilson ID, Creaser CS, An approach to enhancing coverage of the urinary metabonome using liquid chromatography–ion mobility–mass spectrometry, Journal of Chromatography B 871(2) (2008) 357–361. 10.1016/j.jchromb.2008.04.043. [DOI] [PubMed] [Google Scholar]
- [18].Williams MD, Zhang X, Park J-J, Siems WF, Gang DR, Resar LMS, Reeves R, Hill HH, Characterizing metabolic changes in human colorectal cancer, Analytical and Bioanalytical Chemistry 407(16) (2015) 4581–4595. 10.1007/s00216-015-8662-x. [DOI] [PubMed] [Google Scholar]
- [19].Sinclair E, Hollywood KA, Yan C, Blankley R, Breitling R, Barran P, Mobilising ion mobility mass spectrometry for metabolomics, Analyst 143(19) (2018) 4783–4788. 10.1039/C8AN00902C. [DOI] [PubMed] [Google Scholar]
- [20].Danaceau JP, Chambers EE, Fountain KJ, Hydrophilic interaction chromatography (HILIC) for LC–MS/MS analysis of monoamine neurotransmitters, Bioanalysis 4(7) (2012) 783–794. 10.4155/bio.12.46. [DOI] [PubMed] [Google Scholar]
- [21].Virgiliou C, Gika HG, Theodoridis GA, HILIC-MS/MS Multi-Targeted Method for Metabolomics Applications, in: Theodoridis GA, Gika HG, Wilson ID (Eds.), Metabolic Profiling: Methods and Protocols, Springer; New York, New York, NY, 2018, pp. 65–81. 10.1007/978-1-4939-7643-0_5. [DOI] [Google Scholar]
- [22].Spagou K, Tsoukali H, Raikos N, Gika H, Wilson ID, Theodoridis G, Hydrophilic interaction chromatography coupled to MS for metabonomic/metabolomic studies, Journal of Separation Science 33(6‐7) (2010) 716–727. 10.1002/jssc.200900803. [DOI] [PubMed] [Google Scholar]
- [23].Huber CG, Oberacher H, Analysis of nucleic acids by on-line liquid chromatography–Mass spectrometry, Mass Spectrometry Reviews 20(5) (2001) 310–343. 10.1002/mas.10011. [DOI] [PubMed] [Google Scholar]
- [24].Luo B, Groenke K, Takors R, Wandrey C, Oldiges M, Simultaneous determination of multiple intracellular metabolites in glycolysis, pentose phosphate pathway and tricarboxylic acid cycle by liquid chromatography–mass spectrometry, Journal of Chromatography A 1147(2) (2007) 153–164. 10.1016/j.chroma.2007.02.034. [DOI] [PubMed] [Google Scholar]
- [25].Michopoulos F, Whalley N, Theodoridis G, Wilson ID, Dunkley TPJ, Critchlow SE, Targeted profiling of polar intracellular metabolites using ion-pair-high performance liquid chromatography and - ultra high performance liquid chromatography coupled to tandem mass spectrometry: Applications to serum, urine and tissue extracts, Journal of Chromatography A 1349 (2014) 60–68. 10.1016/j.chroma.2014.05.019. [DOI] [PubMed] [Google Scholar]
- [26].Buescher JM, Moco S, Sauer U, Zamboni N, Ultrahigh Performance Liquid Chromatography™Tandem Mass Spectrometry Method for Fast and Robust Quantification of Anionic and Aromatic Metabolites, Analytical Chemistry 82(11) (2010) 4403–4412. 10.1021/ac100101d. [DOI] [PubMed] [Google Scholar]
- [27].Büscher JM, Czernik D, Ewald JC, Sauer U, Zamboni N, Cross-Platform Comparison of Methods for Quantitative Metabolomics of Primary Metabolism, Analytical Chemistry 81(6) (2009) 2135–2143. 10.1021/ac8022857. [DOI] [PubMed] [Google Scholar]
- [28].Lu W, Clasquin MF, Melamud E, Amador-Noguez D, Caudy AA, Rabinowitz JD, Metabolomic Analysis via Reversed-Phase Ion-Pairing Liquid Chromatography Coupled to a Stand Alone Orbitrap Mass Spectrometer, Analytical Chemistry 82(8) (2010) 3212–3221. 10.1021/ac902837x. [DOI] [PMC free article] [PubMed] [Google Scholar]
- [29].Kiefer P, Delmotte N, Vorholt JA, Nanoscale Ion-Pair Reversed-Phase HPLC™MS for Sensitive Metabolome Analysis, Analytical Chemistry 83(3) (2011) 850–855. 10.1021/ac102445r. [DOI] [PubMed] [Google Scholar]
- [30].Dolan JW, Ion Pairing- Blessing or Curse?, LCGC Eur 21(5) (2008) 258–263. [Google Scholar]
- [31].Gustavsson SÅ, Samskog J, Markides KE, Långström B, Studies of signal suppression in liquid chromatography–electrospray ionization mass spectrometry using volatile ion-pairing reagents, Journal of Chromatography A 937(1) (2001) 41–47. 10.1016/S0021-9673(01)01328-0. [DOI] [PubMed] [Google Scholar]
- [32].Holčapek M, Volná K, Jandera P, Kolářová L, Lemr K, Exner M, Církva A, Effects of ion-pairing reagents on the electrospray signal suppression of sulphonated dyes and intermediates, Journal of Mass Spectrometry 39(1) (2004) 43–50. 10.1002/jms.551. [DOI] [PubMed] [Google Scholar]
- [33].Lin Y, Schiavo S, Orjala J, Vouros P, Kautz R, Microscale LC-MS-NMR Platform Applied to the Identification of Active Cyanobacterial Metabolites, Analytical Chemistry 80(21) (2008) 8045–8054. 10.1021/ac801049k. [DOI] [PMC free article] [PubMed] [Google Scholar]
- [34].Wang H, Bennett P, Performance assessment of microflow LC combined with high-resolution MS in bioanalysis, Bioanalysis 5(10) (2013) 1249–1267. 10.4155/bio.13.93. [DOI] [PubMed] [Google Scholar]
- [35].Abian J, Oosterkamp AJ, Gelpí E, Comparison of conventional, narrow-bore and capillary liquid chromatography/mass spectrometry for electrospray ionization mass spectrometry: practical considerations, Journal of Mass Spectrometry 34(4) (1999) 244–254. 10.1002/(sici)1096-9888(199904)34:4<244::Aid-jms775>3.0.Co;2-0. [DOI] [Google Scholar]
- [36].Blue LE, Franklin EG, Godinho JM, Grinias JP, Grinias KM, Lunn DB, Moore SM, Recent advances in capillary ultrahigh pressure liquid chromatography, J Chromatogr A 1523 (2017) 17–39. 10.1016/j.chroma.2017.05.039. [DOI] [PubMed] [Google Scholar]
- [37].Duan X, Weinstock-Guttman B, Wang H, Bang E, Li J, Ramanathan M, Qu J, Ultrasensitive Quantification of Serum Vitamin D Metabolites Using Selective Solid-Phase Extraction Coupled to Microflow Liquid Chromatography and Isotope-Dilution Mass Spectrometry, Analytical Chemistry 82(6) (2010) 2488–2497. 10.1021/ac902869y. [DOI] [PubMed] [Google Scholar]
- [38].Kirkwood JS, Broeckling CD, Donahue S, Prenni JE, A novel microflow LC-MS method for the quantitation of endocannabinoids in serum, J Chromatogr B Analyt Technol Biomed Life Sci 1033-1034 (2016) 271–277. 10.1016/j.jchromb.2016.08.035. [DOI] [PubMed] [Google Scholar]
- [39].Marta Z, Bobaly B, Fekete J, Magda B, Imre T, Meszaros KV, Balint M, Szabo PT, Simultaneous determination of thirteen different steroid hormones using micro UHPLC-MS/MS with on-line SPE system, J Pharm Biomed Anal 150 (2018) 258–267. 10.1016/j.jpba.2017.12.014. [DOI] [PubMed] [Google Scholar]
- [40].Steuer AE, Poetzsch M, Stock L, Eisenbeiss L, Schmid Y, Liechti ME, Kraemer T, Development and validation of an ultra-fast and sensitive microflow liquid chromatography-tandem mass spectrometry (MFLC-MS/MS) method for quantification of LSD and its metabolites in plasma and application to a controlled LSD administration study in humans, Drug Testing and Analysis 9(5) (2017) 788–797. 10.1002/dta.2042. [DOI] [PubMed] [Google Scholar]
- [41].Ma Y, Tanaka N, Vaniya A, Kind T, Fiehn O, Ultrafast Polyphenol Metabolomics of Red Wines Using MicroLC-MS/MS, J Agric Food Chem 64(2) (2016) 505–12. 10.1021/acs.jafc.5b04890. [DOI] [PMC free article] [PubMed] [Google Scholar]
- [42].Christianson CC, Johnson CJ, Needham SR, The advantages of microflow LC–MS/MS compared with conventional HPLC–MS/MS for the analysis of methotrexate from human plasma, Bioanalysis 5(11) (2013) 1387–1396. 10.4155/bio.13.73. [DOI] [PubMed] [Google Scholar]
- [43].Gray N, Lewis MR, Plumb RS, Wilson ID, Nicholson JK, High-Throughput Microbore UPLC–MS Metabolic Phenotyping of Urine for Large-Scale Epidemiology Studies, Journal of Proteome Research 14(6) (2015) 2714–2721. 10.1021/acs.jproteome.5b00203. [DOI] [PubMed] [Google Scholar]
- [44].Jones DR, Wu Z, Chauhan D, Anderson KC, Peng J, A Nano Ultra-Performance Liquid Chromatography–High Resolution Mass Spectrometry Approach for Global Metabolomic Profiling and Case Study on Drug-Resistant Multiple Myeloma, Analytical Chemistry 86(7) (2014) 3667–3675. 10.1021/ac500476a. [DOI] [PMC free article] [PubMed] [Google Scholar]
- [45].Chetwynd AJ, David A, A review of nanoscale LC-ESI for metabolomics and its potential to enhance the metabolome coverage, Talanta 182 (2018) 380–390. 10.1016/j.talanta.2018.01.084. [DOI] [PubMed] [Google Scholar]
- [46].Vaz FAS, Neves LNO, Marques R, Sato RT, Oliveira MAL, Chromophoreasy, an Excel-Based Program for Detection and Integration of Peaks from Chromatographic and Electromigration Techniques, Journal of the Brazilian Chemical Society 27 (2016) 1899–1911 [Google Scholar]
- [47].Bocian S, Buszewski B, Phenyl-bonded stationary phases—The influence of polar functional groups on retention and selectivity in reversed-phase liquid chromatography, Journal of Separation Science 37(23) (2014) 3435–3442. 10.1002/jssc.201400764. [DOI] [PubMed] [Google Scholar]
- [48].O’Sullivan GP, Scully NM, Glennon JD, Polar-Embedded and Polar-Endcapped Stationary Phases for LC, Analytical Letters 43(10–11) (2010) 1609–1629. 10.1080/00032711003653973. [DOI] [Google Scholar]
- [49].Snyder LR, Practical HPLC method development, 2nd ed. ed., New York: : John Wiley & Sons, New York, 1997. [Google Scholar]
- [50].Borges EM, Silica, Hybrid Silica, Hydride Silica and Non-Silica Stationary Phases for Liquid Chromatography, Journal of Chromatographic Science 53(4) (2014) 580–597. 10.1093/chromsci/bmu090. [DOI] [PubMed] [Google Scholar]
- [51].Aranibar N, Vassallo JD, Rathmacher J, Stryker S, Zhang Y, Dai J, Janovitz EB, Robertson D, Reily M, Lowe-Krentz L, Lehman-McKeeman L, Identification of 1- and 3-methylhistidine as biomarkers of skeletal muscle toxicity by nuclear magnetic resonance-based metabolic profiling, Analytical Biochemistry 410(1) (2011) 84–91. 10.1016/j.ab.2010.11.023. [DOI] [PubMed] [Google Scholar]
- [52].Prelack K, Yu YM, Dylewski M, Lydon M, Sheridan RL, Tompkins RG, The Contribution of Muscle to Whole-Body Protein Turnover Throughout the Course of Burn Injury in Children, Journal of Burn Care & Research 31(6) (2010) 942–948. 10.1097/BCR.0b013e3181f938e1. [DOI] [PMC free article] [PubMed] [Google Scholar]
- [53].Myint T, Fraser GE, Lindsted KD, Knutsen SF, Hubbard RW, Bennett HW, Urinary 1- Methylhistidine Is a Marker of Meat Consumption in Black and in White California Seventh-day Adventists, American Journal of Epidemiology 152(8) (2000) 752–755. 10.1093/aje/152.8.752. [DOI] [PubMed] [Google Scholar]
- [54].Pesek JJ, Matyska MT, Ammonium fluoride as a mobile phase additive in aqueous normal phase chromatography, J Chromatogr A 1401 (2015) 69–74. 10.1016/j.chroma.2015.05.010. [DOI] [PubMed] [Google Scholar]
- [55].Takkis K, Aro R, Korgvee LT, Varendi H, Lass J, Herodes K, Kipper K, Signal Enhancement in the HPLC-ESI-MS/MS analysis of spironolactone and its metabolites using HFIP and NH4F as eluent additives, Anal Bioanal Chem 409(12) (2017) 3145–3151. 10.1007/s00216-017-0255-4. [DOI] [PMC free article] [PubMed] [Google Scholar]
- [56].Yanes O, Tautenhahn R, Patti GJ, Siuzdak G, Expanding coverage of the metabolome for global metabolite profiling, Anal Chem 83(6) (2011) 2152–61. 10.1021/ac102981k. [DOI] [PMC free article] [PubMed] [Google Scholar]
- [57].Legido-Quigley C, Smith NW, Mallet D, Quantification of the sensitivity increase of a micro-highperformance liquid chromatography–electrospray ionization mass spectrometry system with decreasing column diameter, Journal of Chromatography A 976(1) (2002) 11–18. 10.1016/S0021-9673(02)01156-1. [DOI] [PubMed] [Google Scholar]
- [58].Zhang J, Shou W, Ogura T, Li S, Weller H, Optimization of microflow LC–MS/MS and its utility in quantitative discovery bioanalysis, Bioanalysis 11(11) (2019) 1117–1127. 10.4155/bio-2019-0076. [DOI] [PubMed] [Google Scholar]
- [59].Kebarle P, Tang L, From ions in solution to ions in the gas phase - the mechanism of electrospray mass spectrometry, Analytical Chemistry 65(22) (1993) 972A–986A. 10.1021/ac00070a001. [DOI] [Google Scholar]
- [60].Knee JM, Rzezniczak TZ, Barsch A, Guo KZ, Merritt TJS, A novel ion pairing LC/MS metabolomics protocol for study of a variety of biologically relevant polar metabolites, Journal of Chromatography B 936 (2013) 63–73. 10.1016/j.jchromb.2013.07.027. [DOI] [PubMed] [Google Scholar]
- [61].Cortese M, Delporte C, Dufour D, Noyon C, Chaumont M, De Becker B, Reye F, Rousseau A, Eker OF, Nève J, Piagnerelli M, Boudjeltia KZ, Robaye B, Van Antwerpen P, Validation of a LC/MSMS method for simultaneous quantification of 9 nucleotides in biological matrices, Talanta 193 (2019) 206–214. 10.1016/j.talanta.2018.10.003. [DOI] [PubMed] [Google Scholar]
- [62].He L, Wei X, Ma X, Yin X, Song M, Donninger H, Yaddanapudi K, McClain CJ, Zhang X, Simultaneous Quantification of Nucleosides and Nucleotides from Biological Samples, Journal of The American Society for Mass Spectrometry 30(6) (2019) 987–1000. 10.1007/s13361-019-02140-7. [DOI] [PMC free article] [PubMed] [Google Scholar]
- [63].Zhu B, Wei H, Wang Q, Li F, Dai J, Yan C, Cheng Y, A simultaneously quantitative method to profiling twenty endogenous nucleosides and nucleotides in cancer cells using UHPLC-MS/MS, Talanta 179 (2018) 615–623. 10.1016/j.talanta.2017.11.054. [DOI] [PubMed] [Google Scholar]
- [64].Johnsen E, Wilson SR, Odsbu I, Krapp A, Malerod H, Skarstad K, Lundanes E, Hydrophilic interaction chromatography of nucleoside triphosphates with temperature as a separation parameter, Journal of Chromatography A 1218(35) (2011) 5981–5986. 10.1016/j.chroma.2011.01.066. [DOI] [PubMed] [Google Scholar]
- [65].Zhao F, Qiu X, Ye N, Qian J, Wang D, Zhou P, Chen M, Hydrophilic interaction liquid chromatography coupled with quadrupole-orbitrap ultra high resolution mass spectrometry to quantitate nucleobases, nucleosides, and nucleotides during white tea withering process, Food Chemistry 266 (2018) 343–349. 10.1016/j.foodchem.2018.06.030. [DOI] [PubMed] [Google Scholar]
Associated Data
This section collects any data citations, data availability statements, or supplementary materials included in this article.