Abstract
Methyltransferase-like 3 (METTL3) and 14 (METTL14) are core subunits of the methyltransferase complex (MTC) that catalyzes mRNA N6-methyladenosine (m6A) modification. Despite the expanding list of m6A-dependent function of the MTC, m6A independent function of the METTL3 and METTL14 complex remains poorly understood. Here we show that genome-wide redistribution of METTL3 and METTL14 transcriptionally drives senescence-associated secretory phenotype (SASP) in a m6A-independent manner. METTL14 is redistributed to the enhancers, while METTL3 is localized to the pre-existing NF-κB sites within the promoters of SASP genes during senescence. METTL3 and METTL14 are necessary for SASP. However, SASP is not regulated by m6A mRNA modification. METTL3 and METTL14 are required for both the tumor-promoting and immune surveillance functions of senescent cells mediated by SASP in vivo in mouse models. In summary, our results report a m6A independent function of the METTL3 and METTL14 complex in transcriptionally promoting SASP during senescence.
Introduction
m6A modification plays an important role in dynamic responses to stresses1. m6A is generated by the recruitment of the m6A writer METTL3-METTL14 methyltransferase complex (MTC)2. In addition to core subunits METTL3 and METTL14, wilms tumor 1-associating protein (WTAP) binds to METTL3/14 and is necessary for the nuclear localization of the METTL3/14 core complex3. m6A modification is typically coupled with the recruitment of MTC. For example, m6A-mediated RNA degradation of heat-shock genes is mediated by localization of METTL3 to these gene loci4. In addition, an increase in m6A-modified RNA at the UV-induced DNA damage sites correlate with the recruitment of METTL3 and METTL145. Further, co-transcriptional m6A installation in human pluripotent stem cells is mediated by interaction between METTL3/METTL14 and transcription factors SMAD2/36. Likewise, m6A modification of transcription factor CEBPZ target genes in acute myeloid leukemia is mediated by the interaction between METTL3 and CEBPZ7. m6A modification of transcripts from lysine 36 trimethylated histone H3 (H3K36me3) marked chromatin is associated with the interaction between METTL14 and H3K36me38. Finally, METTL3 deposits m6A modifications on chromosome-associated regulatory RNAs (carRNAs) such as promoter-associated RNAs and enhancer RNAs to tune chromatin state and transcription9. However, the association of METTL3/METTL14 with these specific chromatin loci is inevitably associated with their m6A methyltransferase activity, which resulted in m6A installation on their target transcripts. Notably, m6A-independent function of the METTL3 and METTL14 complex remains poorly understood.
Cellular senescence is a stable growth arrest that can be induced by a number of stresses, including activation of oncogenes or chemotherapeutics10. Oncogene-induced senescence (OIS) and therapy-induced senescence (TIS) underscore the tumor suppressive role of senescence10, 11. Senescent cells also have non-cell autonomous activities exemplified by secretion of inflammatory cytokines and chemokines, which is termed the senescence-associated secretory phenotype (SASP)10. SASP plays a context dependent role in cancer12, 13. In addition to its detrimental tumor growth-promoting function14, SASP is critical for immune-modulating and surveillance of senescent cells induced by activated oncogenes in premalignant lesions12, 13. Given that METTL3 and METTL14 regulated m6A modification in stress response15 and cellular senescence is considered a stress response10, we explored potential role of the METTL3 and METTL14 complex during senescence.
Results
METTL3 and METTL14 regulate SASP
To explore the role of MTC during senescence, we knocked down the core MTC subunit METTL14 expression in primary embryonic lung fibroblasts IMR90 cells undergoing oncogenic RAS-induced senescence (Fig. 1a and Extended Data Fig. 1a). To limit the potential off-target effects and identify m6A dependent changes, we performed the rescue experiments in METTL14 knockdown cells by expressing wildtype METTL14 or a R298P mutant METTL14 that is defective in mediating RNA m6A modification16, 17. To compare and contrast METLL14-dependent and m6A-dependent changes in gene expression, we performed RNA-seq analysis in these cells. The results show that 93% of METTL14-dependent changes in gene expression rescued by wildtype METTL14 were also rescued by the R298P mutant (Fig. 1b–c). This result suggests that vast majority of METTL14-dependent changes in gene expression are m6A-independent. Pathway analysis for the genes whose expression are regulated by both wildtype and the mutant METTL14 revealed a significant enrichment of SASP-related pathways such as inflammatory cytokines, NFκB and p38 MAPK pathways (Extended Data Fig. 1b–c). Indeed, SASP genes were significantly enriched among the set of 246 rescued genes (9.9 fold, P < 10−13 by Fisher Exact Test) (Fig. 1d).
Figure 1: METTL3 and METTL14 regulate SASP.
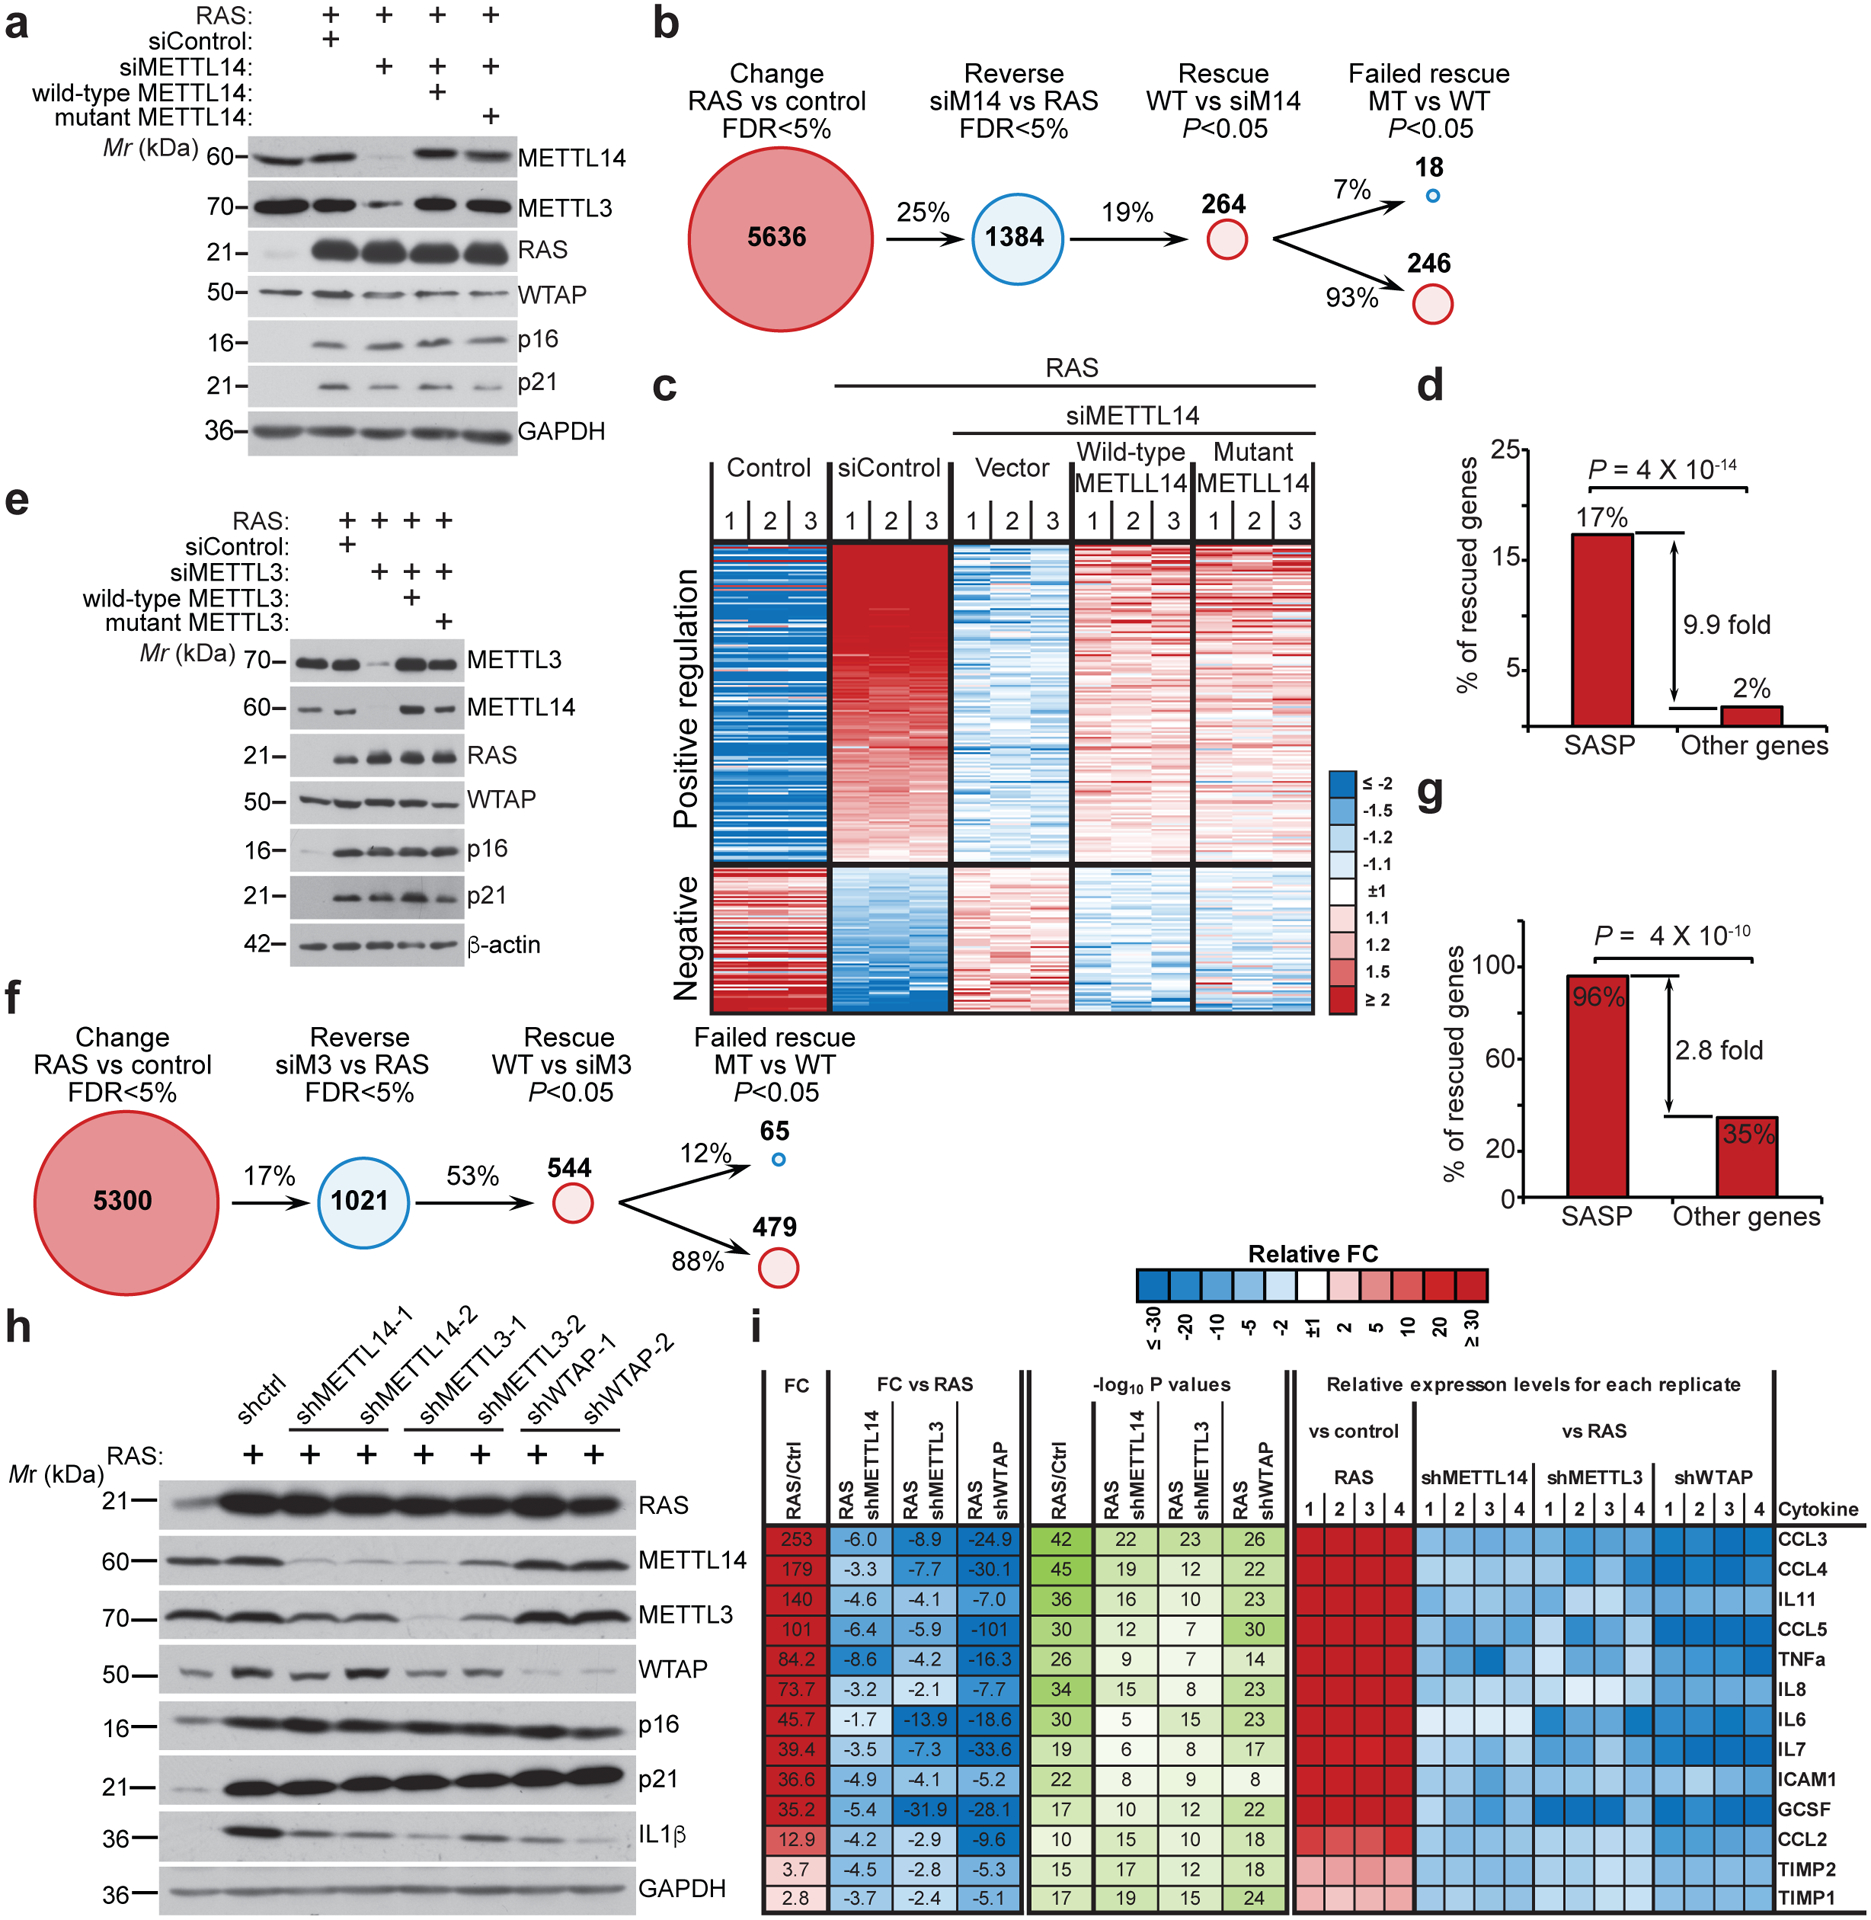
a, IMR90 cells were induced to senesce by oncogenic RAS expressing a non-targeting siRNA control (siControl) or METTL14-targeted siRNA (siMETTL14) with or without the rescue of ectopically expressed wildtype or the R298P mutant METTL14. Cells were harvested and analyzed for expression of the indicated proteins by immunoblot. The experiment was repeated three times independently with similar results. b-d, Numbers of genes significantly changed in the indicated cells determined by RNA-seq analysis (b), and heatmap of RNA-seq data with 3 biologically independent replicates in each of the groups for the genes whose expression significantly changed by METTL14 knockdown and rescued by both wildtype and the R298P mutant METTL14 (c), among which SASP genes were significantly enriched (d). e-g, IMR90 cells were induced to senesce by oncogenic RAS expressing a non-targeting siRNA control (siControl) or METTL3-targeted siRNA (siMETTL3) with or without the rescue of ectopically expressed wildtype or the D394A/W397A mutant METTL3. Cells were harvested and analyzed for expression of the indicated proteins by immunoblot (e). The experiment was repeated three times independently with similar results. Numbers of genes significantly changed in the indicated cells determined by RNA-seq analysis (f), and SASP genes were significantly enriched among the genes whose expression significantly changed by METTL3 knockdown and rescued by both wildtype and the D394A/W397A mutant METTL3 (g). h, IMR90 cells were induced to senesce by RAS with or without the expression of the indicated shRNAs. Expression of the indicated proteins was determined by immunoblot. The experiment was repeated three times independently with similar results. i, The secretion of soluble factors under the indicated conditions was detected by antibody arrays. The heatmap indicates the fold change (FC) in comparison to the control or RAS-induced senescent condition. Relative expression levels per replicate and average fold change differences are shown (n=4 biologically independent replicates). P values were calculated using a two-tailed Fisher Exact test in 1d and 1g. Uncropped blots for 1a, 1e, 1h, and numerical source data for 1i are provided.
We next sought to determine whether the observed effects are MTC complex dependent. Toward this goal, we performed the rescue experiments in METTL3 knockdown cells by expressing wildtype METTL3 or a D394A/W397A mutant METTL3 that is enzymatically inactive (Fig. 1e)17, 18. Similar to METTL14 rescue experiments, we show that 88% of METTL3-dependent changes in gene expression rescued by wildtype METTL3 were also rescued by the D394A/W397A mutant (Fig. 1f and Extended Data Fig. 1d). Likewise, SASP genes were enriched by both wildtype and mutant METTL3 regulated genes during senescence (Fig. 1g and Extended Data Fig. 1e). We next knocked down the expression of the core subunits METTL14 and METTL3 as well as the WTAP subunit that is required for the nuclear localization of the METTL3-METTL14 complex3 in senescent cells (Fig. 1h). Notably, expression of SASP genes was reduced by knockdown of all three subunits of MTC (Extended Data Fig. 2a). Similar observations were also made in cells undergoing senescence induced by etoposide (Extended Data Fig. 2b). We next measured changes in the levels of secreted SASP factors using an antibody-based array. Consistently, knockdown of all three subunits of MTC significantly decreased the levels of secreted SASP factors (Fig. 1i). Further, we validated that ectopic expression of both wildtype and mutant METTL3 or METTL14 rescued the expression of SASP genes that are downregulated by knocking down of METTL3 or METTL14 (Extended Data Fig. 3). Notably, knocking down of the MTC subunits did not affect senescence-associated growth arrest or expression of markers of senescence such as SA-β-gal and upregulation of p16 and p21 (Fig. 1a, 1e, 1h and Extended Data Fig. 4). This indicates that the observed decrease in SASP is not an indirect consequence of senescence inhibition. Ectopic expression of METTL3 or METTL14 induced senescence and the associated growth arrest in IMR90 cells, which correlates with an upregulation of SASP genes (Extended Data Fig. 5a–d). In addition, ectopic expression of both wildtype and the R298P mutant METTL14 further increased the upregulated SASP genes in senescent cells (Extended Data Fig. 5e). Finally, ectopic expression of wildtype or mutant METTL3 or METTL14 upregulated the p53 and p21 senescence-promoting pathway (Extended Data Fig. 5f). Consistently, SASP promote senescence through pathways including the p53 and p21 pathway19. Indeed, conditioned medium from senescent cells induced by wildtype or mutant METTL3 or METTL14 upregulated SA-β-Gal positive cells and decreased incorporation of BrdU, a marker of cell proliferation (Extended Data Fig. 5g–h).
SASP genes are differentially expressed at the different stages of senescence. We next determined the dynamics of METTL3 and METTL14-regulated SASP genes. Toward this goal, we performed a time-course studies using the well-characterized IMR90 cells transduced with an Estrogen Receptor: H-RASG12V fusion protein (ER:RAS) that can be induced with 4-hydroxytamoxifen (4-OHT) (Extended Data Fig. 6a). Notably, oncogenic RAS induction did not affect the overall m6A levels (Extended Data Fig. 6b). SASP genes regulated by METTL3 and METTL14 coincided with induction of formation of cytoplasmic chromatin fragments (CCF) that promote SASP genes through activation of NFκB (Extended Data Fig. 6c–e)20. This correlated with the association of METTL3 with the promoter and METTL14 with the enhancer of SASP genes such as CXCL5 (Extended Data Fig. 6f). Consistent with previous reports21, expression of retrotransposon RNA such as LINE1 and its regulated genes such as IFNβ is a later event during senescence (Extended Data Fig. 6g). Indeed, knockdown of METTL3 or METTL14 did not significantly reduce LINE1 expression (Extended Data Fig. 6h). Thus, our results support that MTC promotes NFκB-regulated SASP during senescence.
SASP is not regulated by m6A
Our results suggest that upregulation of SASP genes is METTL3 and METTL14 dependent but m6A-independent. To directly test this possibility, we profiled m6A distribution at the transcriptome levels in control and senescent cells by RNA immunoprecipitation followed by sequencing. Indeed, m6A distribution was not significantly altered at the transcriptome level during senescence (Extended Data Fig. 7a–b). Notably, METTL3/METTL14 regulated SASP genes were not subjected to m6A regulation as evidenced by background signal in the analysis (Fig. 2a). We next sought to validate this finding by knocking down endogenous METTL3 or METTL14 with or without rescue with wildtype or mutant METTL3 or METTL14 in senescent cells. Indeed, m6A levels were reduced by METTL3 or METTL14 knockdown, which can be rescued by wildtype METTL3 or METTL14, but not by mutant METTL3 or METTL14 (Fig. 2b). In addition, we validated that mRNAs of the SASP genes were not subjected to m6A modification as evidenced by the comparable levels between anti-m6A antibody and a control IgG in the RNA immunoprecipitation analysis (Fig. 2c). In contrast, as a positive control, m6A modification on PHLPP2 mRNA22 was decreased by endogenous METTL3 or METTL14 knockdown, which was rescued by wildtype METTL3 or METTL14, but not by the mutant METTL3 or METTL14 (Fig. 2d). Given the role of m6A modification on carRNAs in regulating transcription9, we profiled carRNAs in senescent cells with or without METTL3 or METTL14 knockdown (Extended Data Fig. 7c). We validated previous reports that m6A modification of carRNAs is regulated by METTL3 and METTL14 (e.g., Extended Data Fig. 7d)9. However, none of the METTL3 and METTL14-regulated SASP genes were subjected to regulation of m6A modification on their associated carRNAs (e.g., Extended Data Fig. 7e). Together, these results support that the METTL3 and METTL14 complex regulates SASP genes independently of its m6A function.
Figure 2: SASP is not regulated by m6A.
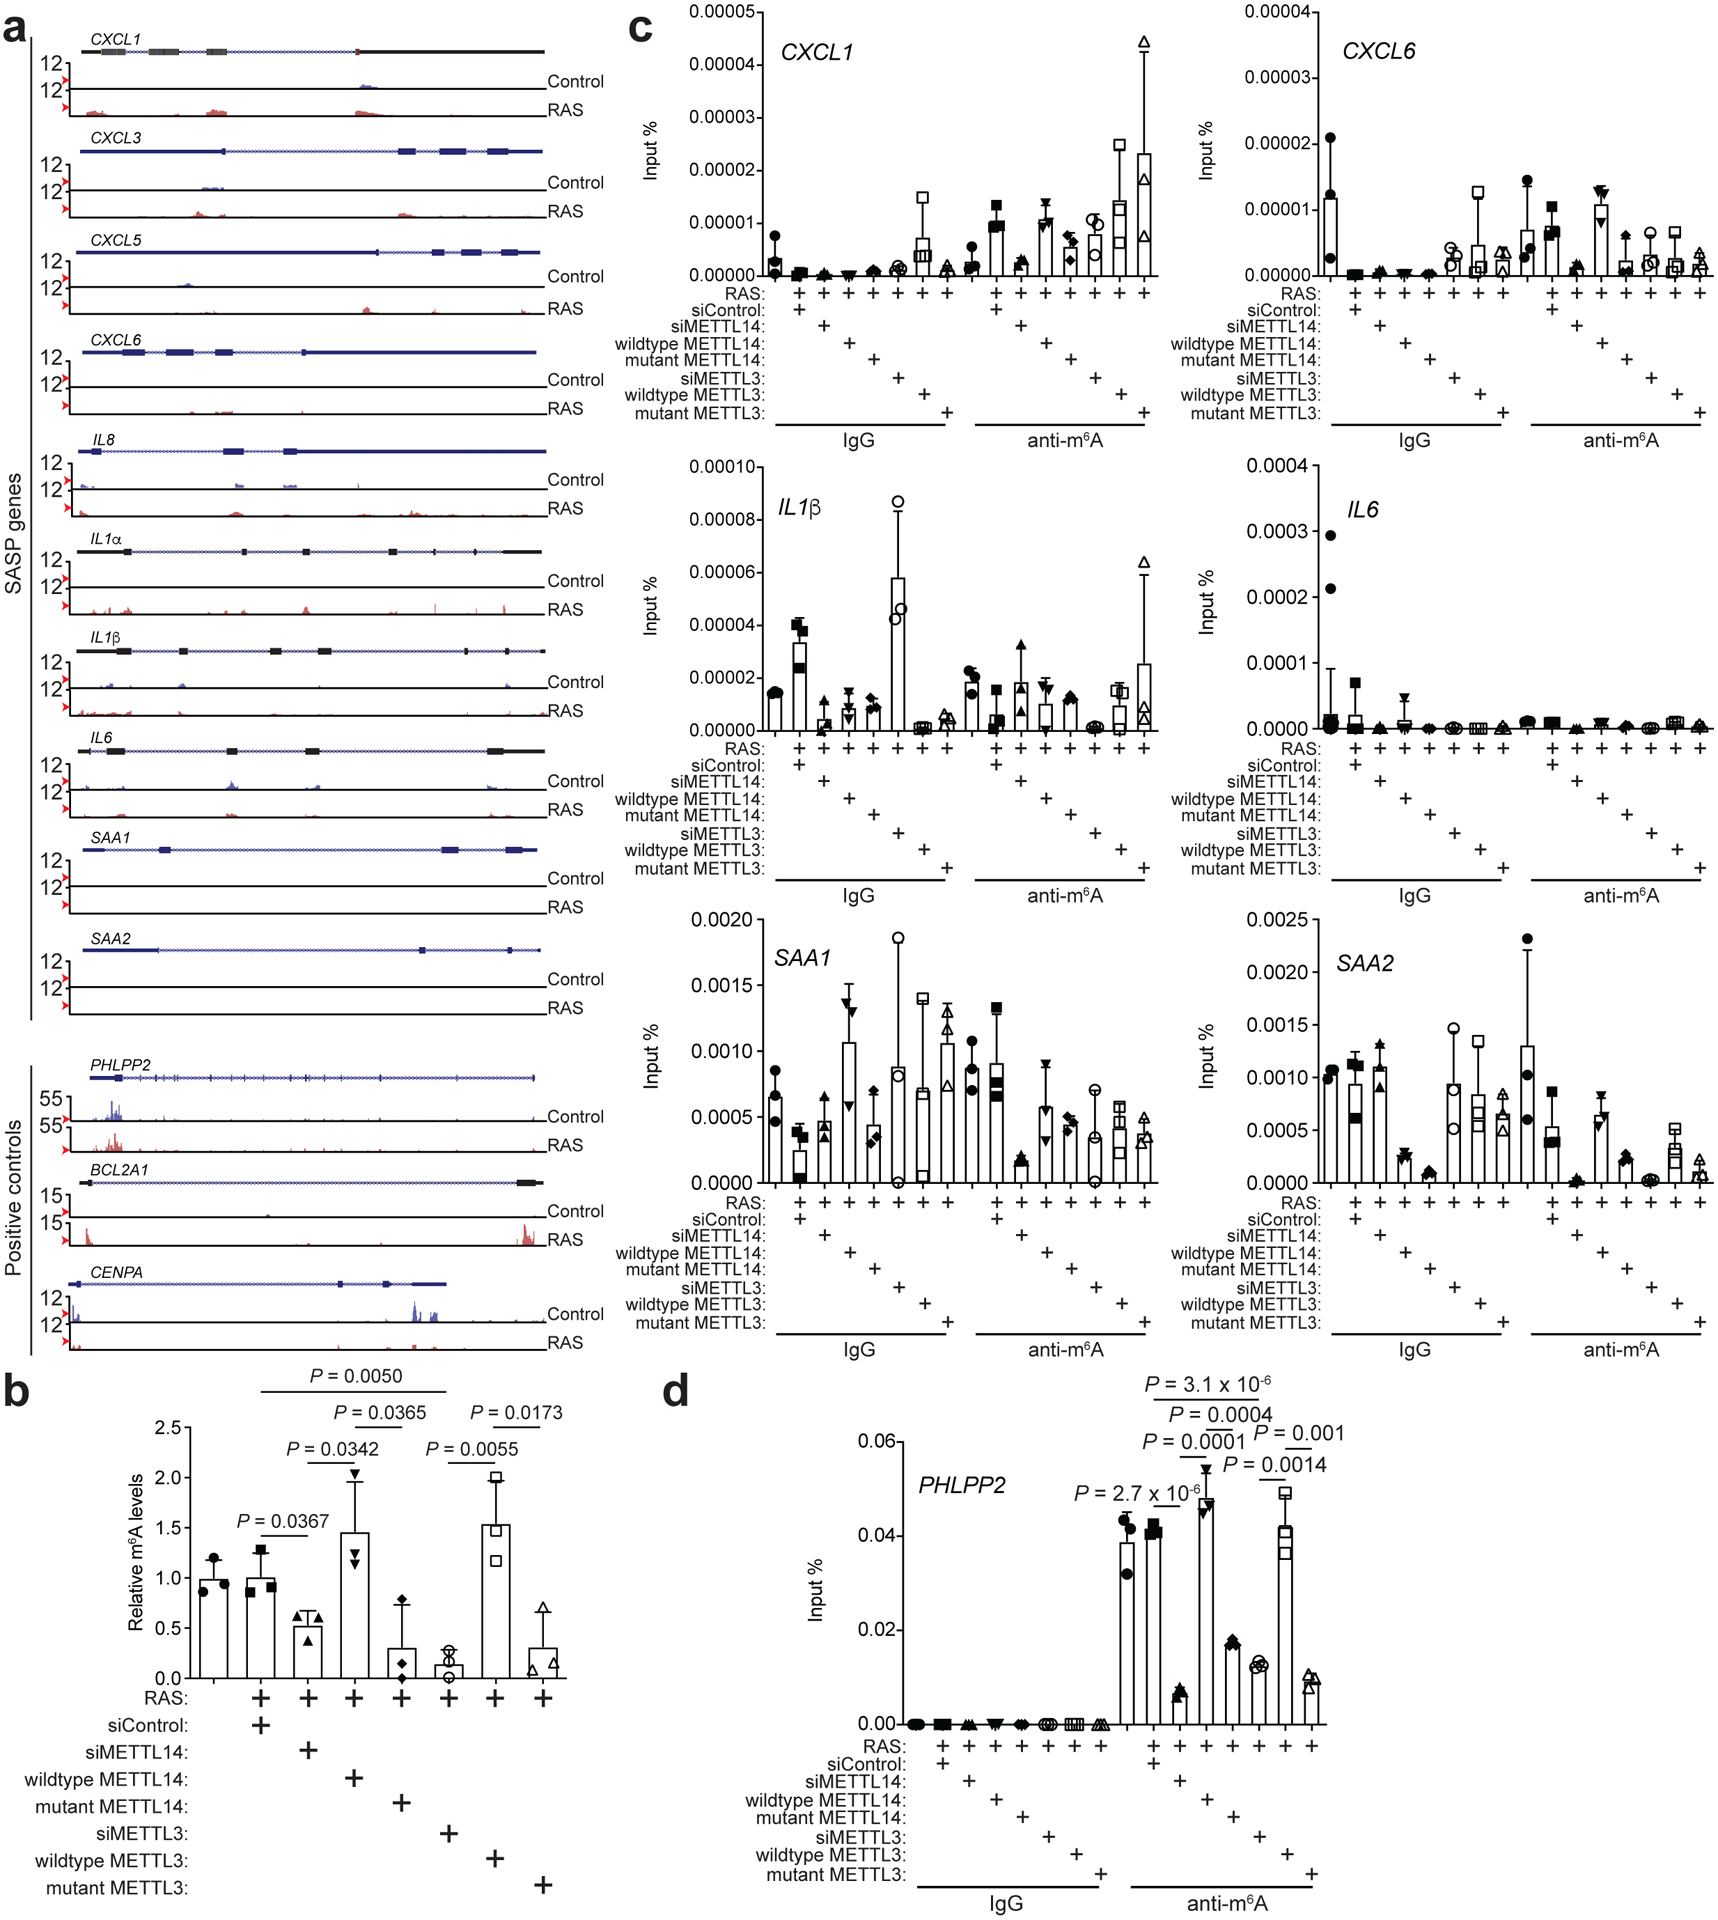
a, Tracks of m6A distribution on the representative SASP genes based on RNA immunoprecipitation followed by sequencing using an anti-m6A antibody. The m6A signal was normalized with the corresponding input and the relative fold change was shown. m6A modified non-SASP gene PHLPP2, BCL2A1 and CENPA were used as positive controls. Red arrows point to statistical cut off in peak calling. b-d, m6A levels from total RNAs in control and RAS-induced senescent cells with or without knockdown of endogenous METTL3 or METTL14 and rescued by the indicated wildtype or mutant METTL3 or METTL14 (b). m6A modifications on the indicated SASP genes (c) or a positive control PHLPP2 gene (d) were quantified with RNA immunoprecipitation using an anti-m6A antibody followed by RT-qPCR. Data represent mean ± s.d. of three biologically independent experiments. P values were calculated using a two-tailed t-test. Numerical source data for 2b, 2c and 2d are provided.
Genome-wide METTL3 and METTL14 redistribution
We next sought to determine the mechanism by which MTC regulates SASP by mapping the association of METTL3 and METTL14 with chromatin using cut-and-run in control and senescent cells. In control cells, the two proteins showed overwhelming co-localization (Fig. 3a–c). In contrast, both METTL3 and METTL14 redistributed but with different patterns in senescent cells (Fig. 3a–c). Specifically, METTL3 showed an increase in binding upstream near genes’ transcription starting sites (TSS), while METTL14 showed an increase in binding at least 10 kb away from gene bodies (Fig. 3d and Extended Data Fig. 8a). Given redistribution patterns of the METTL3 and METTL14 complex and their roles in regulating SASP, we next directly explored the role of METTL3 and METTL14 in gene transcription during senescence by performing RNA polymerase II (Pol II) ChIP-seq analysis. Interestingly, although METTL3 or METTL14 knockdown did not affect the global Pol II distribution (Extended Data Fig. 8b), the association of Pol II with SASP genes loci was decreased by their knockdown (P=10−29 for METTL3 knockdown and P=10−42 for METTL14 knockdown by paired t test) (Fig. 3e). This is consistent with the findings that knockdown of METTL14 or METTL3 suppresses SASP gene expression (Fig. 1).
Figure 3: Genome-wide redistribution of METTL3 and METTL14.
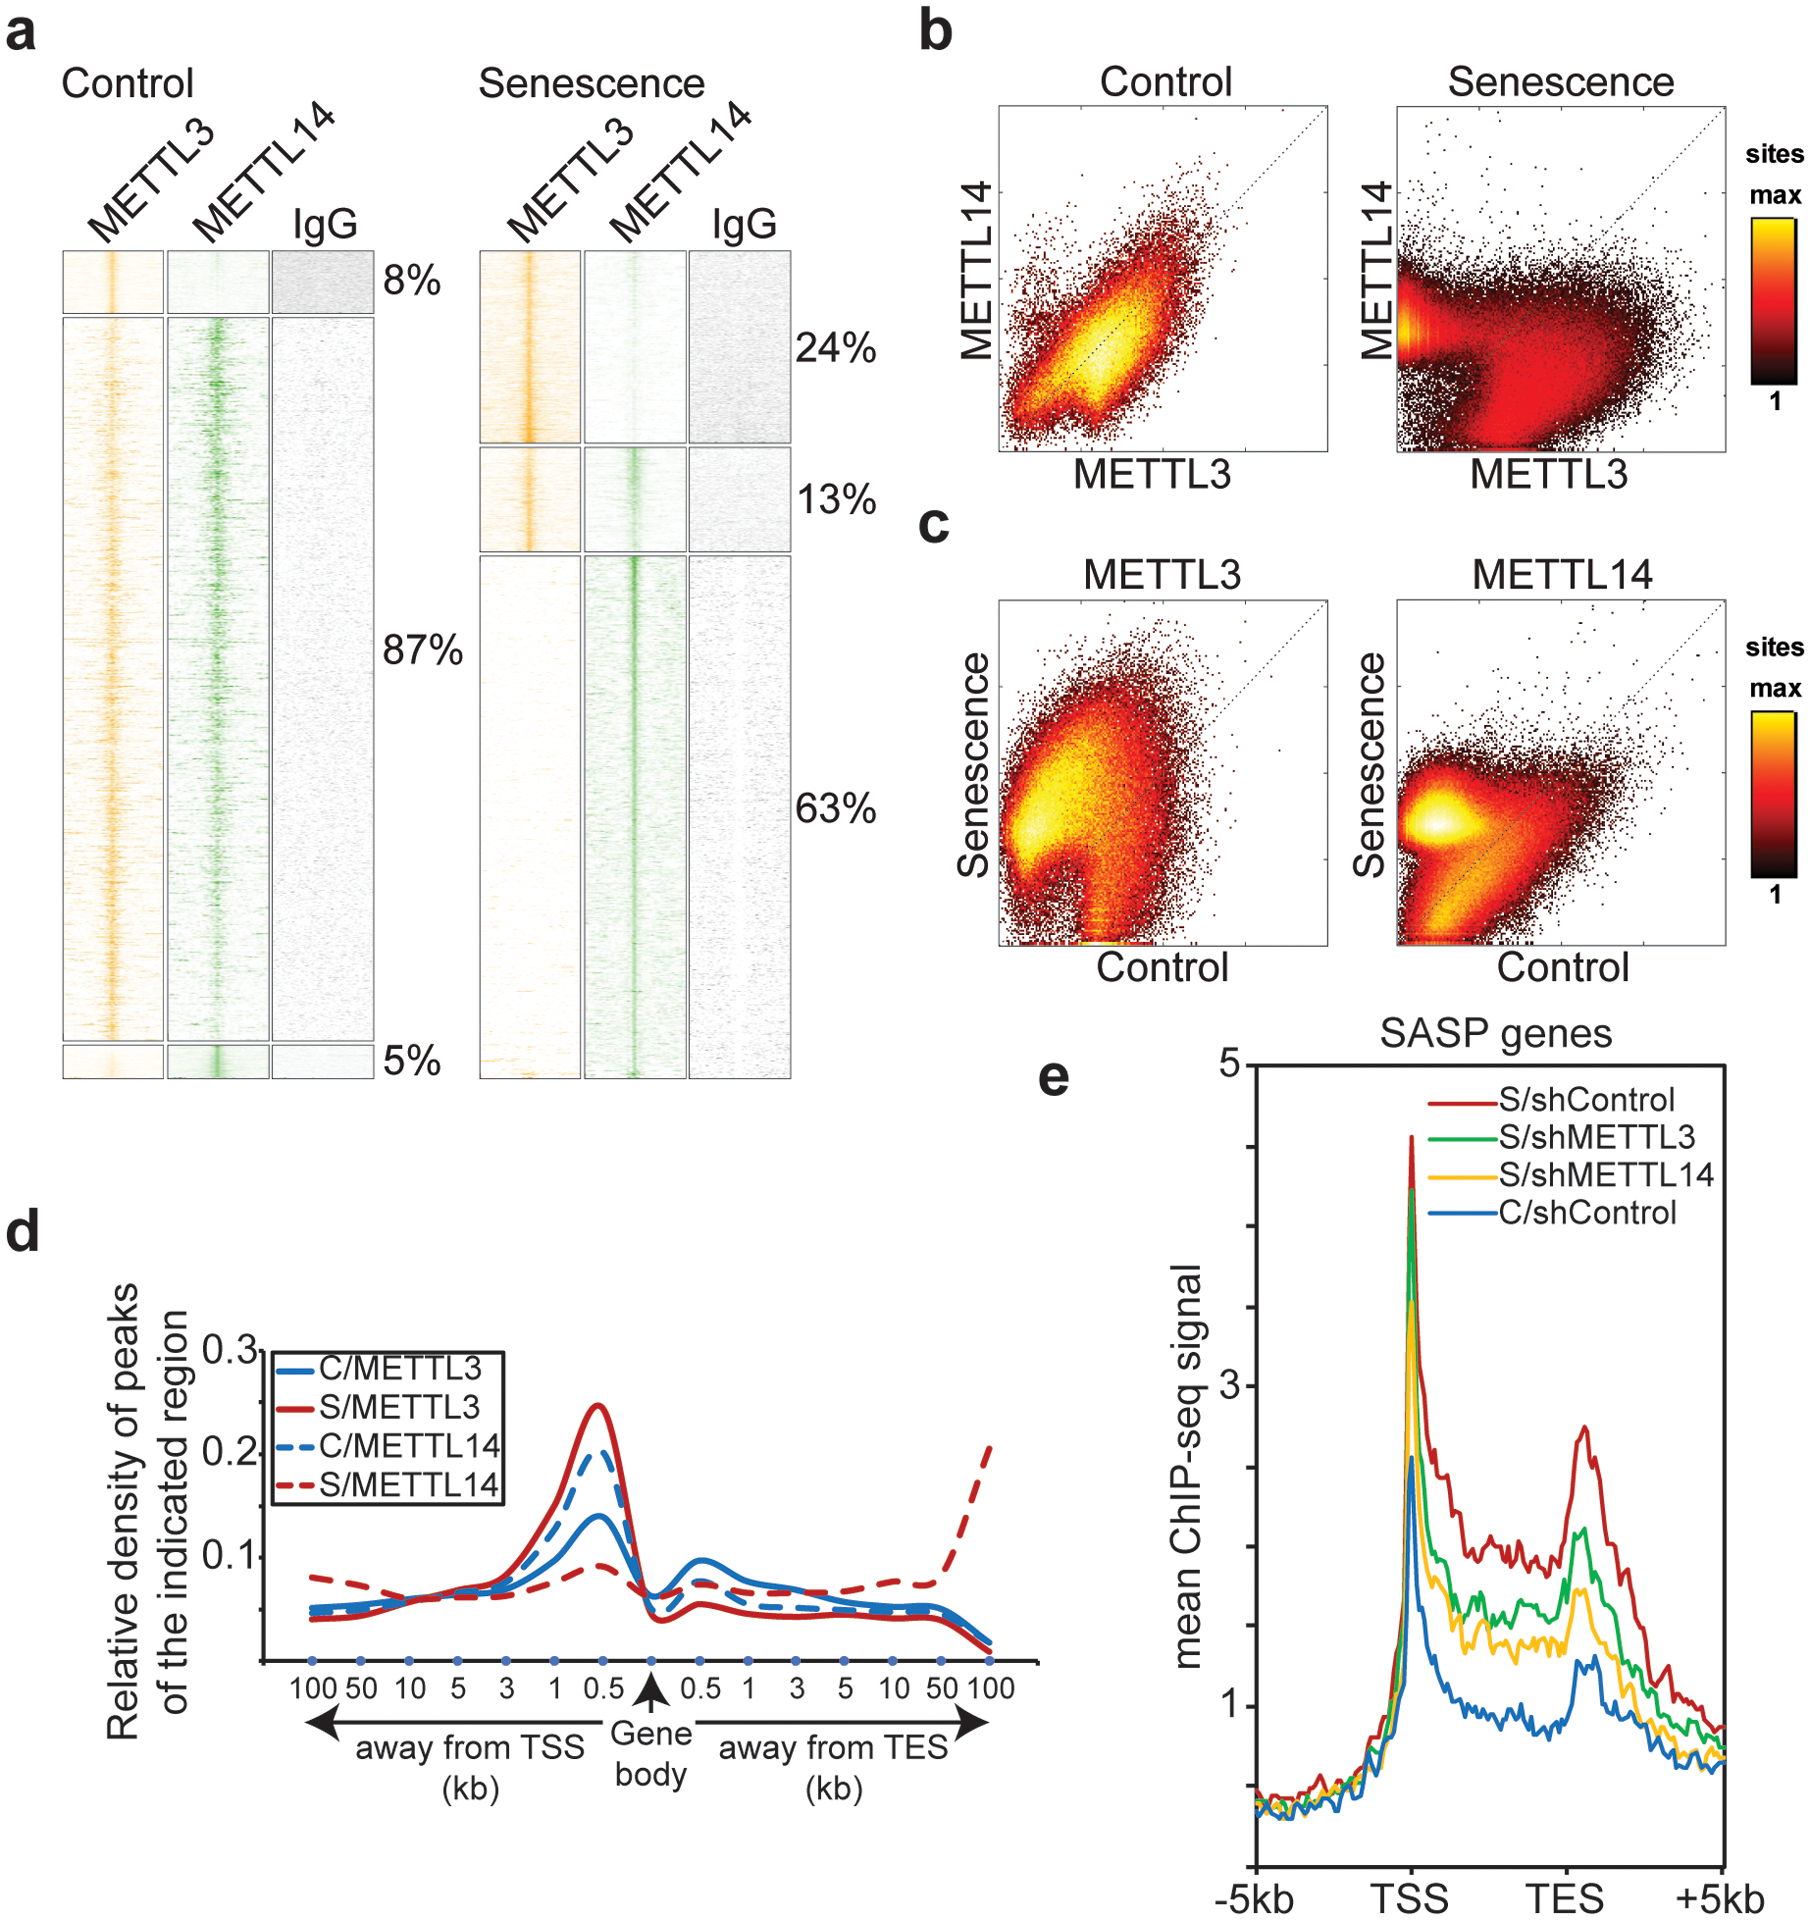
a, Heatmap clustering of cut-and-run seq profiles of METTL3 and METTL14 in control and senescent cells. b-c, Correlation of binding signal between METTL3 and METTL14 in control vs. senescent cells (b) and correlation of the specific binding signal of METTL3 or METTL14 between control and senescent cells (c). d, Distribution of relative normalized density of METTL3 and METTL14 cut-and-run seq peaks within gene body context in control (C) and senescent (S) cells. e, Average profiles of RNA polymerase II (Pol II) occupancy on SASP gene loci in control (C) and senescent (S) cells with or without METTL3 or METTL14 knockdown determined by ChIP-seq analysis.
METTL3 is localized to the pre-existing NF-κB sites within the promoters of SASP genes
We next cross-referenced METTL3 cut-and-run with RNA-seq datasets comparing control and senescent cells. Analysis of genomic loci specifically bound by METTL3 in senescent cells within 500 bp of a gene’s TSS whose expression is significantly upregulated in senescent cells (FDR < 5% with METTL3 cut-and-run signal increase > 2 fold) revealed a significant enrichment of SASP genes (P = 2×10⁻⁸ by Fisher exact test) (Fig. 4a). Analysis of enrichment of transcription factor binding sites of METTL3 direct target genes revealed that NFκB, a known regulator of SASP genes12, 13, as the top transcription factor (Extended Data Fig. 8c). Accordingly, we performed cut-and-run analysis for the regulatory NFκB p65 subunit. The analysis revealed a significant correlation between redistribution of METTL3 (change of signal in senescent vs. control cells) and NFκb p65 distribution in senescent cells (Fig. 4b and Extended Data Fig. 8d). Indeed, compared with controls, a significant number of METTL3 was redistributed to the pre-existing NFκB p65 sites (Fig. 4b). Consistently, we observed an interaction between METTL3 and METTL14 and NFκb p65 by co-immunoprecipitation analysis in both control and senescent cells (Fig. 4c and Extended Data Fig. 8e). Indeed, blocking the translocation of NFκB into the nucleus by a small molecule inhibitor BAY11–7082 significantly reduced the association of METTL3 with the promoters of SASP genes such as CXCL3 and CXCL5, but not negative control regions (Fig. 4d and Extended Data Fig. 8f, –g). Conversely, knockdown of METTL3, but not METTL14, decreased the association of NFκB p65 with the promoters of SASP genes but not negative control regions, while knockdown of both METTL3 and METTL14 reduced the activity of NFκB reporter in senescent cells (Fig. 4e and Extended Data Fig. 8h–j). Notably, METTL3 mutant that is deficient for its m6A methyltransferase activity rescued p65 phosphorylation, its nuclear chromatin association and its association with the promoters of SASP genes with equal efficiency as wildtype METTL3 in METTL3 knockdown senescent cells (Extended Data Fig. 8k–m). Similar to a previous report8, the analysis also revealed an interaction between METTL3 and METTL14 and Pol II (Fig. 4c). This is consistent with the findings that knockdown of METTL14 or METTL3 decreased Pol II association with the SASP genes (Fig. 3e).
Figure 4: METTL3 is localized to the pre-existing NF-κB sites within the promoters of SASP genes.
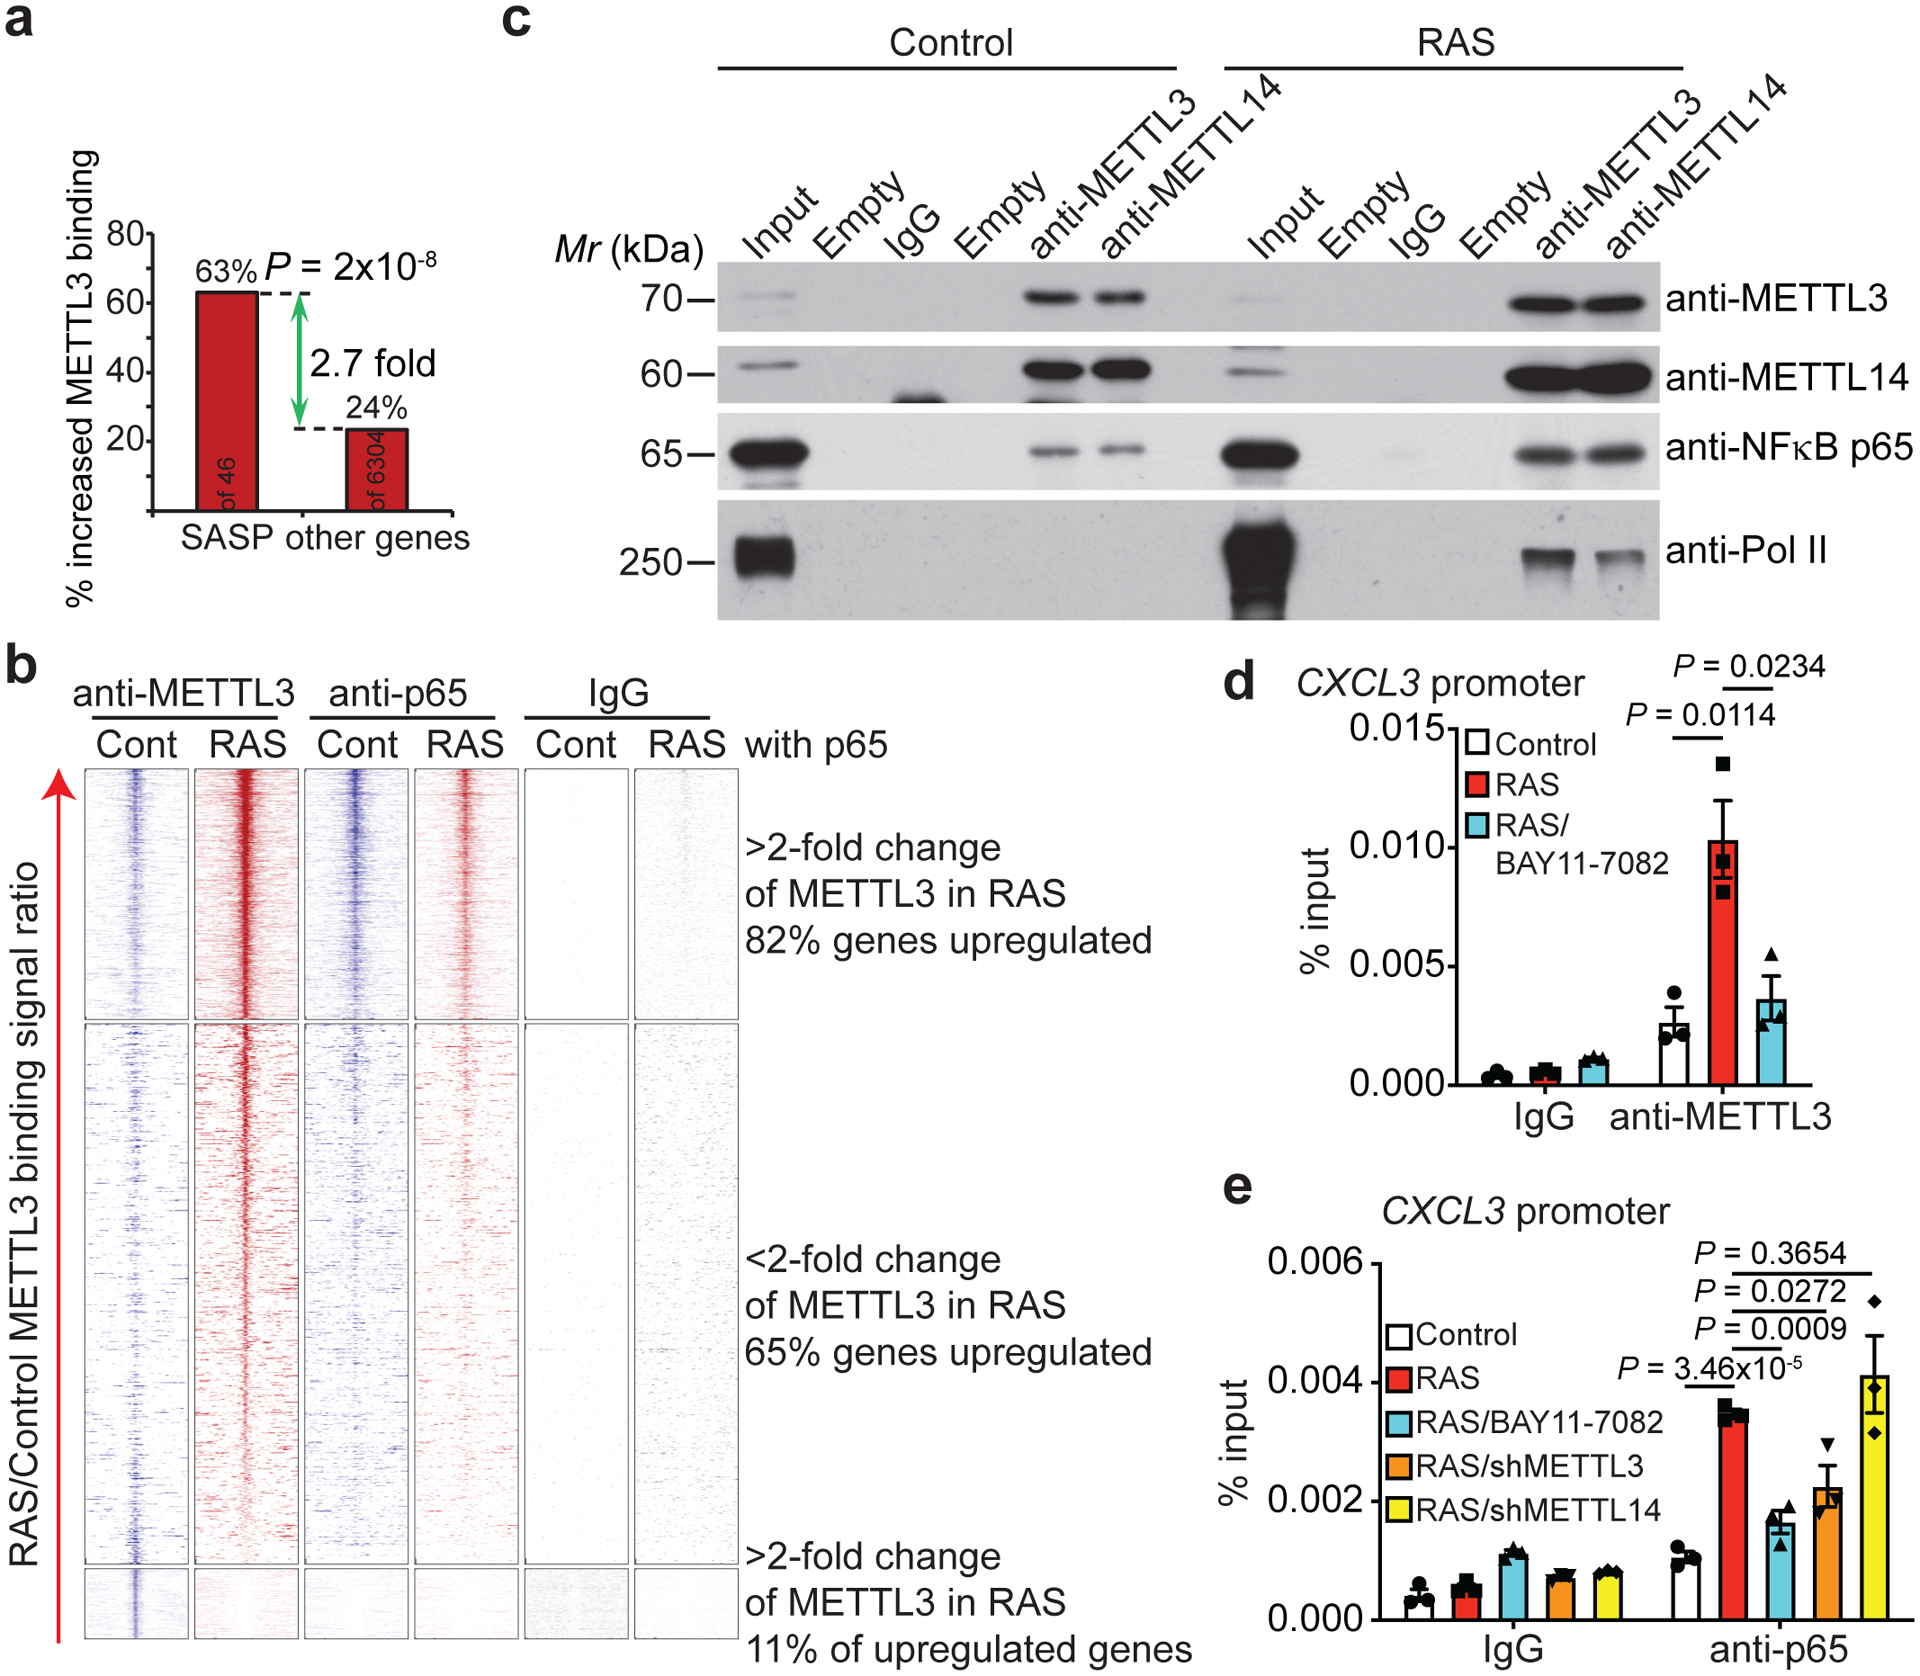
a, Enrichment of SASP genes among genes whose promoters showed an increased association with METTL3 in senescent cells. b, Heatmap of binding signal around METTL3 peaks found in control and RAS-induced senescent cells from cut-and-run seq for METTL3 and NF-κB p65. c, Co-immunoprecipitation analysis between METTL3 or METTL14 and NF-κB p65 subunit and RNA polymerase II in control and RAS-induced senescent cells. The experiment was repeated three times independently with similar results. d-e, ChIP–qPCR analysis of the association of METTL3 and NF-κB p65 with the promoters of the indicated SASP genes in control and RAS-induced senescent cells with or without METTL3 or METTL14 knockdown or treated with IKK inhibitor Bay 11–7082 (5 μM) for 48 hrs. Data represent mean ± s.e.m. of three biologically independent experiments. P values were calculated using a two-tailed t-test except in 4a by a two-tailed Fisher Exact test. Uncropped blots for 4c and numerical source data for 4d and 4e are provided.
METTL14 regulates SASP gene enhancers
We next cross-referenced METTL14 cut-and-run with RNA-seq datasets comparing control and senescent cells without or with METTL14 knockdown and rescued with wildtype or the R298P mutant METTL14 (Fig. 5a). Specifically, we focused on genes with increased METTL14 peaks in senescent cells (>2 fold within 100 kb from TSS) and overlapped those genes with genes whose expression was suppressed by METTL14 knockdown and rescued by both wildtype and mutant METTL14. The analysis revealed a significant enrichment (P = 2×10⁻⁴ by Fisher Exact Test) of such overlapped putative METTL14 target genes (Fig. 5a and Extended Data Fig. 9a) that were also enriched for SASP genes (Extended Data Fig. 9b). Given that METTL14 showed a redistribution from TSS to at least 10 kb away from gene body in senescent cells (Fig. 3d), we explored whether these redistributed sites represent distal enhancers. Indeed, cross-reference of co-localized binding sites for METTL14 and lysine 27 acetylated histone H3 (H3K27ac), an enhancer marker23, revealed that METTL14 and H3K27ac bindings were increased >2 fold in 195 genes in senescent cells within 100 kb from TSS (Fig. 5b). SASP genes such as CXCL1, CXCL3, CXCL5, CXCL6, IL1α, IL1β and IL6 (Fig. 5c) were also enriched among these genes (Extended Data Fig. 9c). Notably, acute-phase serum amyloids A1 and A2 (SAA1 and SAA2) were only weakly regulated by METTL3 and METTL14, while only regulation of SAA2’s, but not SAA1’s, by METTL3 and METTL14 can be validated (Extended Data Fig. 3c and 9d)24. Indeed, the association of H3K27ac with distal enhancers of SASP genes was impaired by METTL14 knockdown (Fig. 5d and Extended Data Fig. 9e). Notably, METTL14 expression positively correlated with the expression of a number of SASP genes in human pancreatic intraepithelial neoplasia, precursors to malignancy, which contain oncogenic-RAS induced senescent cells25 (Extended Data Fig. 9f). In contrast to decreasing METTL3’s association with the promoters of SASP genes, NFκb inhibition did not affect the association of METTL14 with the distal enhancers of SASP genes (Extended Data Fig. 9g).
Figure 5: METTL14 regulates SASP gene enhancers.
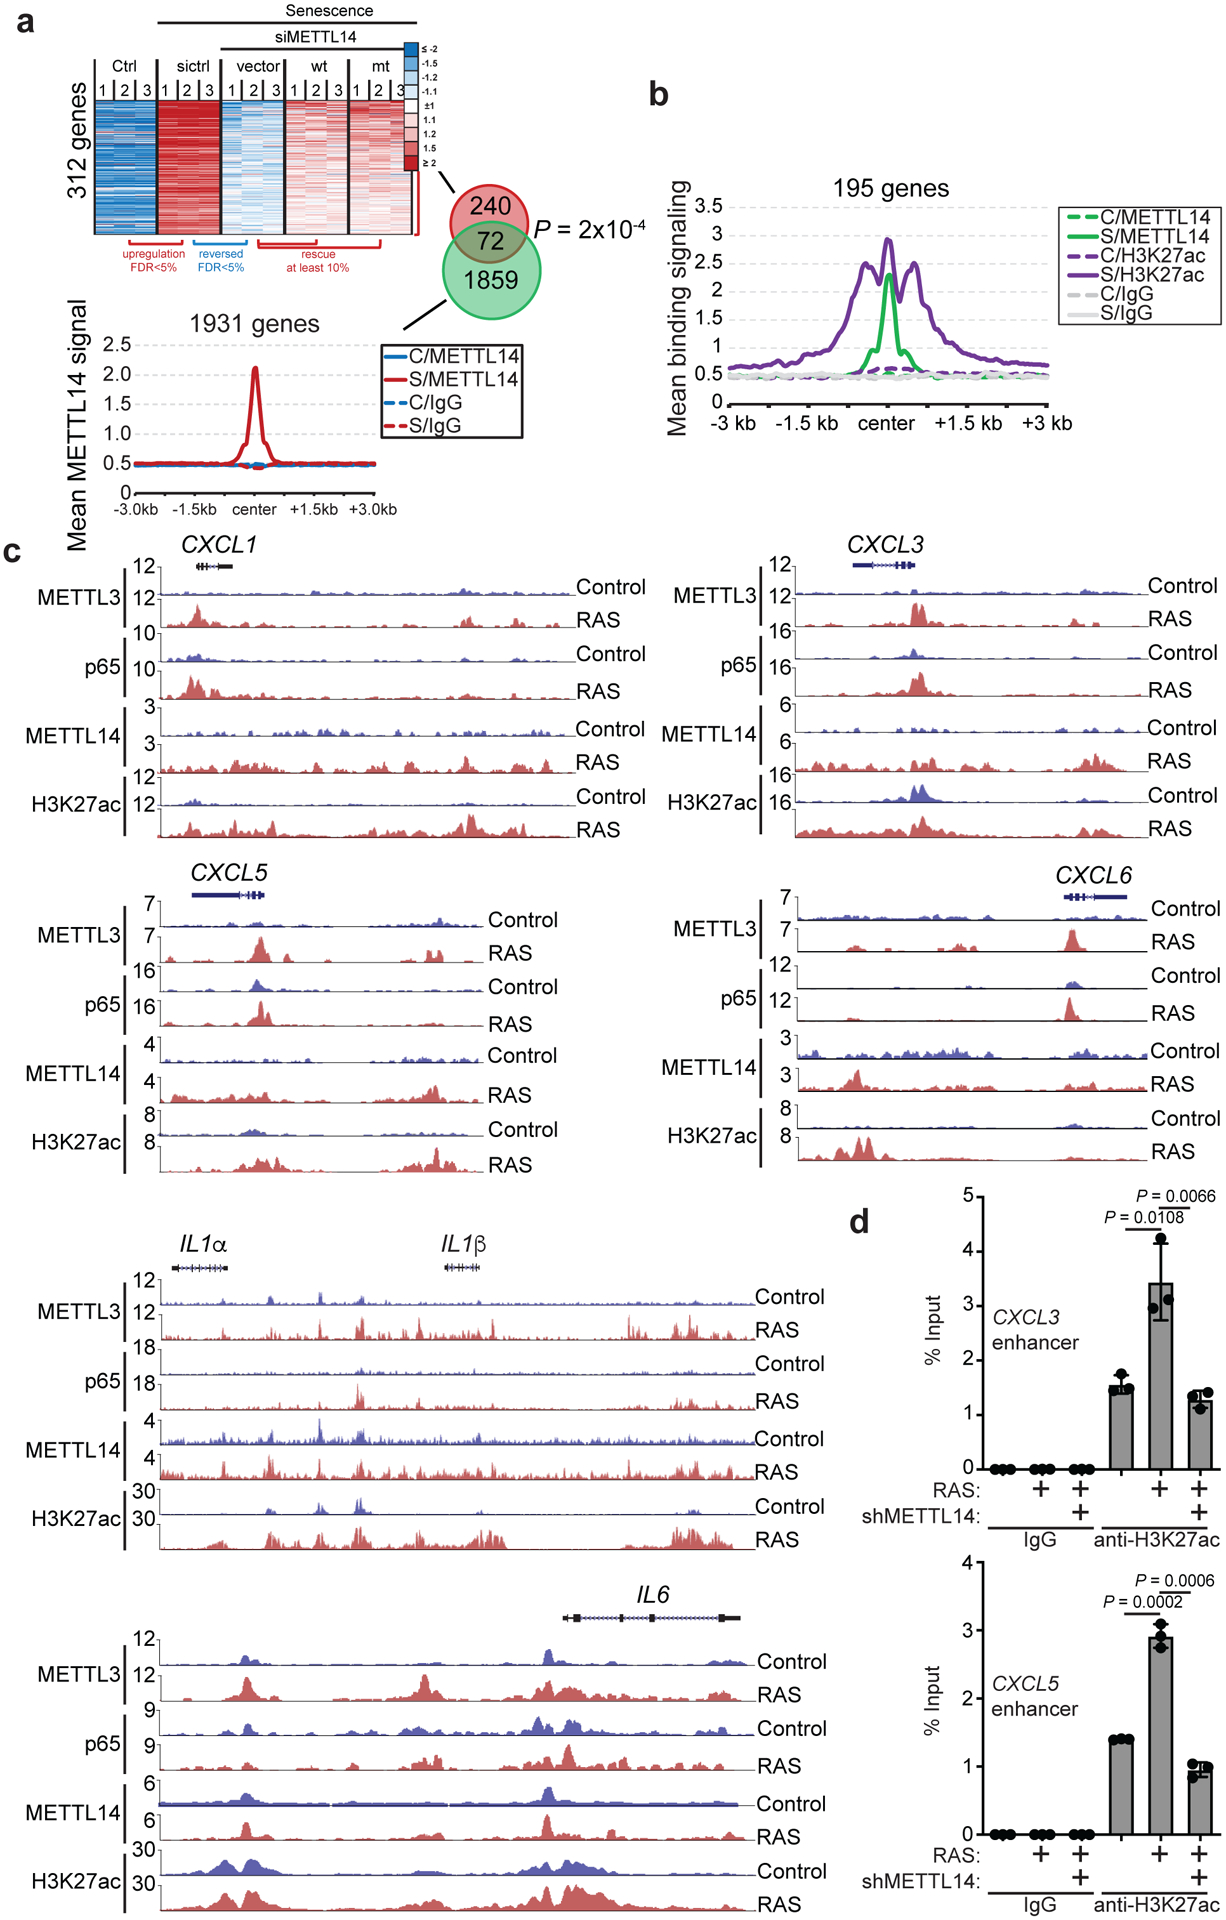
a, Overlap between genes with expression rescued by both wildtype (wt) and the R298P mutant (mt) METTL14 in senescent cells with METTL14 knockdown and genes with ≥2 fold increase in METTL14 binding in senescence (S) compared with controls (C). n=3 biologically independent experiments for RNA-seq analysis. b, Average profiles of the cut-and-run signal for METTL14 and the ChIP-seq signal for H3K27ac for genomic loci with increased association for both METTL14 and H3K27ac in senescent (S) compared with control (C) cells (≥2 fold). c, Representative cut-and-run peaks of METTL3, NF-κB p65, METTL14 and H3K27ac on the indicated SASP genes loci in control and RAS-induced senescent cells. d, ChIP-qPCR analysis of the association of H3K27ac with the enhancers of the indicated SASP gene loci in control and RAS-induced senescent cells with or without METTL14 knockdown. Data represent mean ± s.d. of three biologically independent experiments. P values were calculated using a two-tailed t-test except in 5a by a two-tailed Fisher Exact test. Numerical source data for 5d are provided.
The redistribution pattern of METTL3 and METTL14 suggest that they may regulate SASP gene expression through the formation of chromatin looping, allowing enhancer and promoter interaction through interaction between METTL3 and METTL14. We directly examined chromatin looping between METTL14-redistributed enhancer and METTL3-enriched promoter of SASP genes such as CXCL3, CXCL5 and IL1β using in situ chromosome conformation capture (3C) in control and senescent cells26. Indeed, we observed a robust association between the promoter and enhancer of these SASP genes (Fig. 6a). Notably, METTL14 knockdown reduced the interaction to the levels observed in control cells (Fig. 6a). This supports the notion that the interaction between METTL3 and METTL14 mediates the promoter and enhancer looping in senescent cells to promote SASP gene expression (Fig. 6b). Consistently, 3D DNA-FISH analysis of IL1β locus revealed that the distance between its promoter and enhancer was reduced in senescent cells and knockdown of METTL3 or METTL14 increased their distances (Fig. 6c–d). Finally, enzymatically inactive mutant METTL3 did not reduce its association with the promoters of SASP genes (Fig. 6e). Likewise, mutant METTL14 did not negatively affect its association with enhancers of SASP genes (Fig. 6f). Together, these findings support that the METTL3 and METTL14 complex regulate promoter and enhancer interaction of SASP genes in an enzymatic activity independent manner.
Figure 6: METTL3 and METTL14 mediate SASP gene enhancer and promoter loop formation.
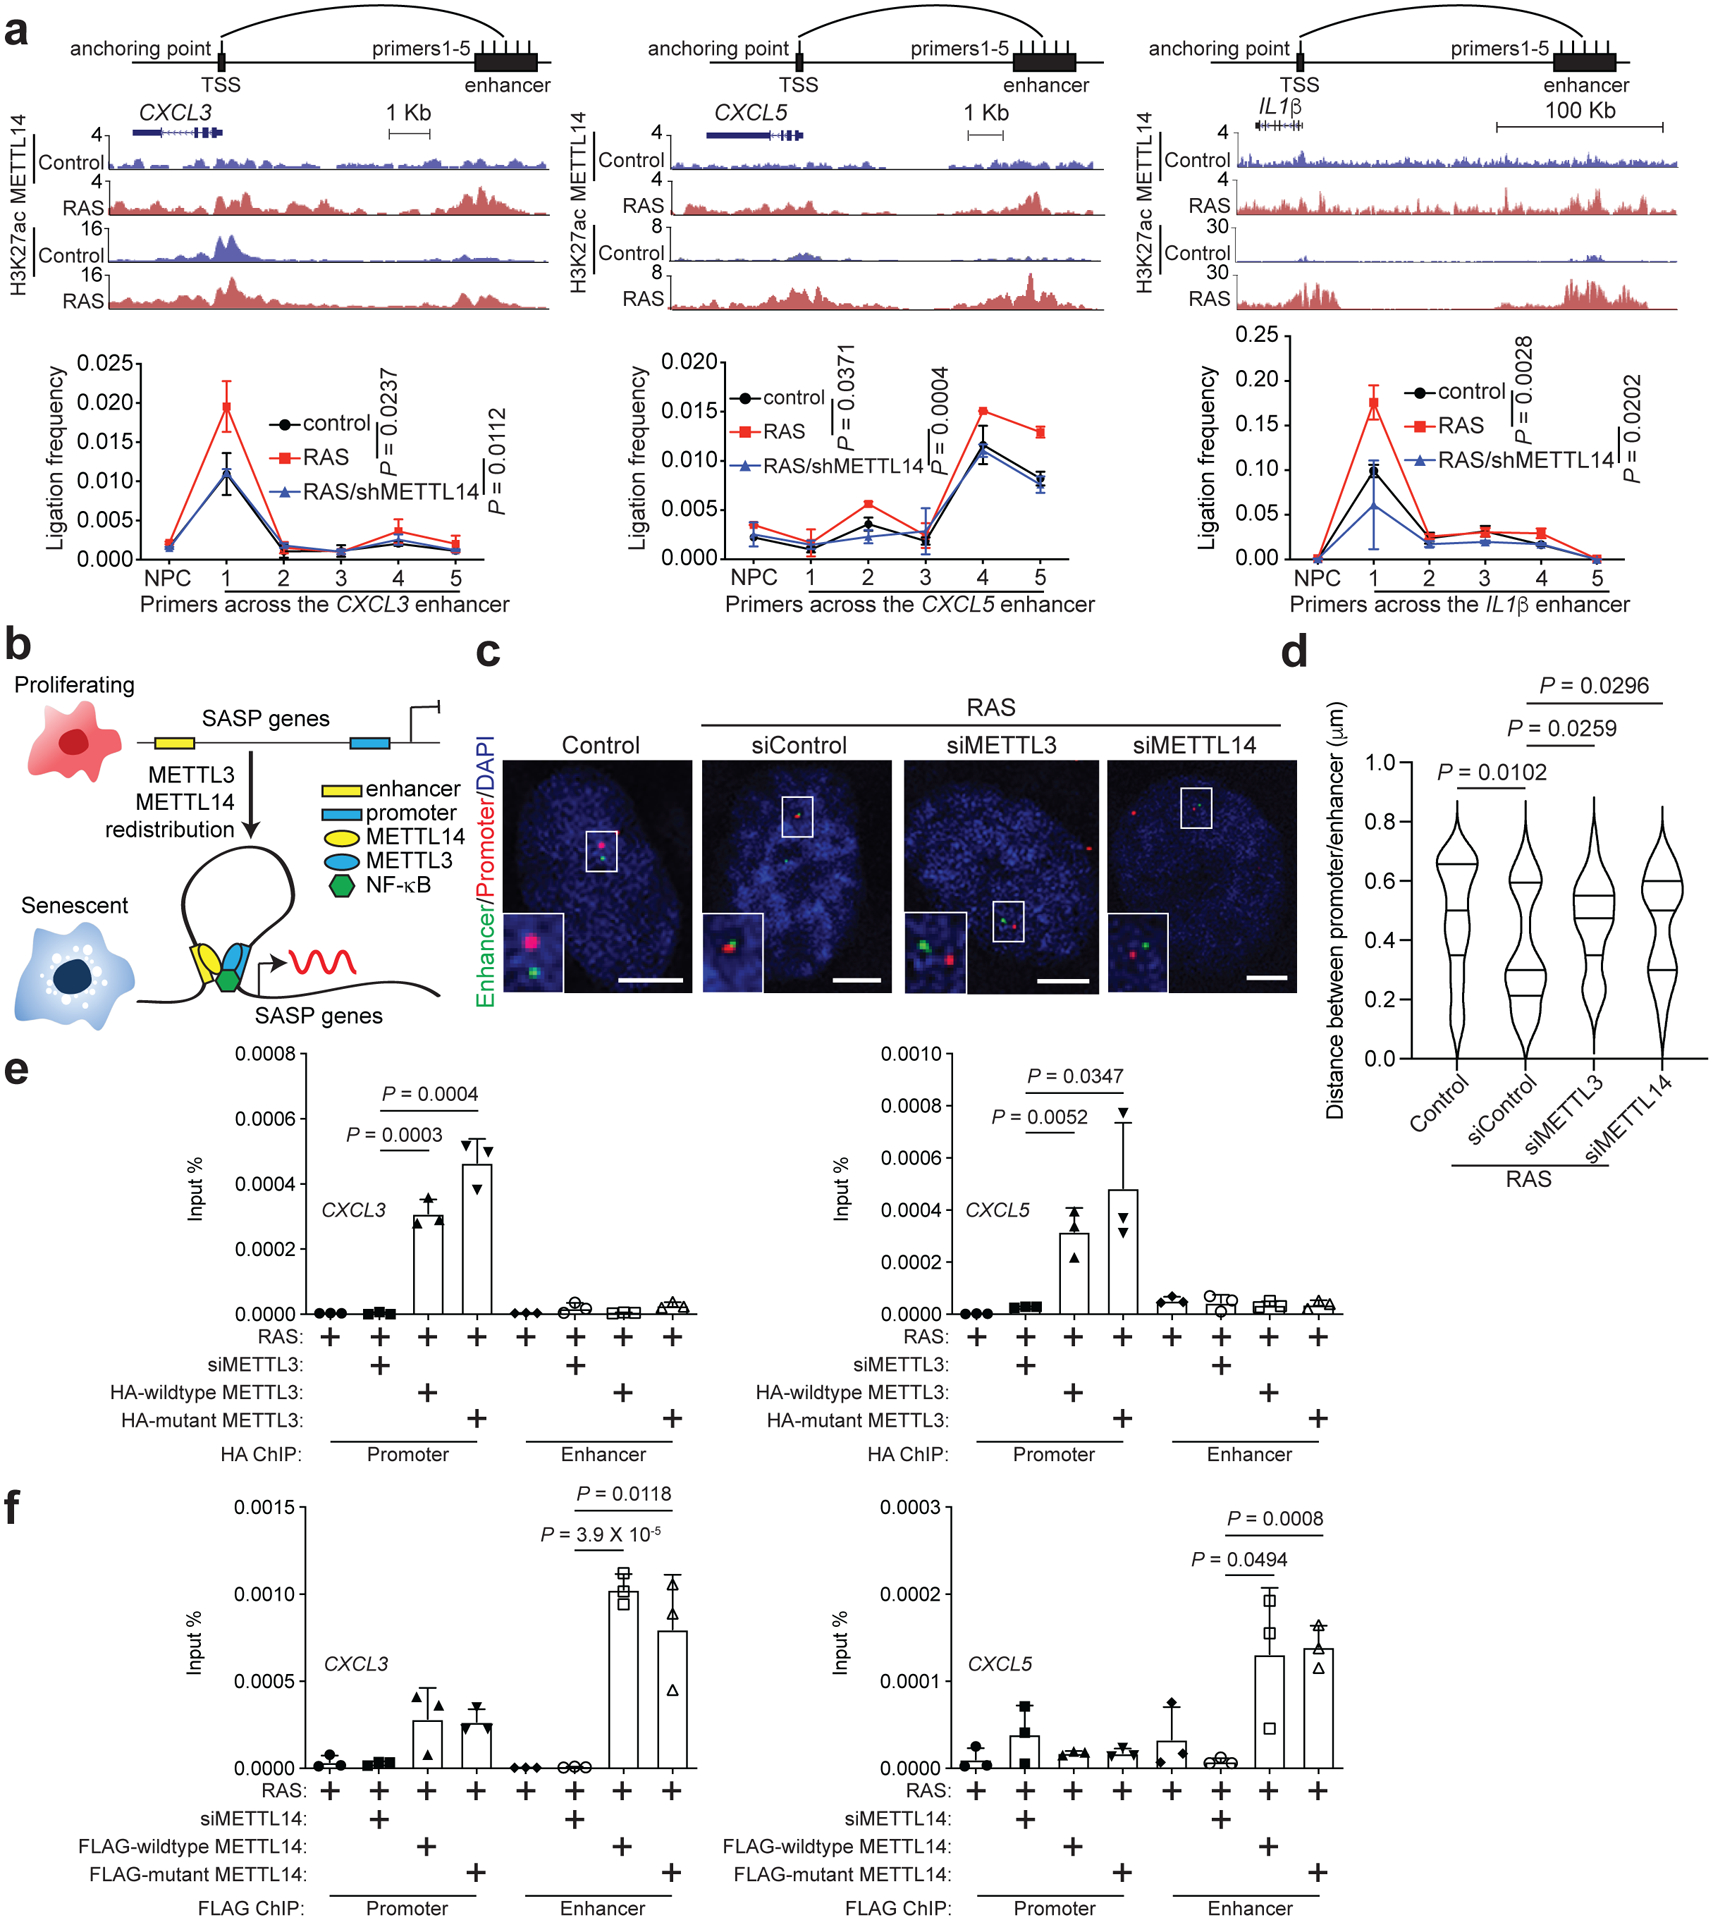
a, 3C-qPCR analysis of the promoter-enhancer interaction frequency on the indicated SASP gene loci in control and RAS-induced senescent cells with or without METTL14 knockdown. Schematic illustrates the 3C primers targeting the enhancer and promoter of the SASP gene loci according to the cut-and-run seq peaks for H3K27ac and METTL14 in control and RAS-induced senescent cells. b, A model for the mechanism by which the redistributed METTL3 and METTL14 promote SASP gene expression in senescent cells by mediating promoter and enhancer looping. c-d, Representative images of 3D DNA-FISH for IL1β locus in control and RAS-induced senescent cells with or without knockdown of METTL3 or METTL14. Dual labelled DNA-FISH was performed with a probe for promoter (in red) and another probe for enhancer (in green) (c). Scale bars = 5 μm. The distance between IL1β promoter and enhancer probes was determined using ImageJ software (d). At least 40 loci were quantified for each of the indicated groups. e-f, ChIP–qPCR analysis of association of HA-tagged wildtype and mutant METTL3 (e) and FLAG-tagged wildtype and mutant METTL14 (f) with the promoters and enhancers of the indicated SASP genes in control and senescent cells with or without endogenous METTL3 or METTL14 knockdown, and rescued with HA-tagged wildtype or mutant METTL3 or FLAG-tagged wildtype or mutant METTL14. Data represent mean ± s.d. of three biologically independent experiments unless otherwise stated. P values were calculated using a two-tailed t-test. Numerical source data for 6a, 6d, 6e and 6f are provided.
METTL3 and METTL14 are required for tumor-promoting function of SASP
SASP factors play a context dependent role in cancer12, 13. For example, SASP promotes the growth of tumor cells both in vitro and in vivo in immunocompromised mice14. To further establish the role of MTC-regulated SASP in a physiological context, we treated ovarian cancer cells with conditioned media collected from senescent cells with or without knocking down of METTL14, METTL3 or WTAP subunits of the MTC. Indeed, the growth-promoting effects of conditioned media from senescent cells were significantly reduced by the knocking down of all three subunits of MTC (Fig. 7a). Consistently, the tumor growth-stimulating effects of co-injected senescent fibroblasts were significantly impaired by the knocking down of all three MTC subunits in vivo in xenograft models (Fig. 7b–c).
Figure 7: METTL3 and METTL14 are required for pro-tumorigenic and immune surveillance function of the SASP.
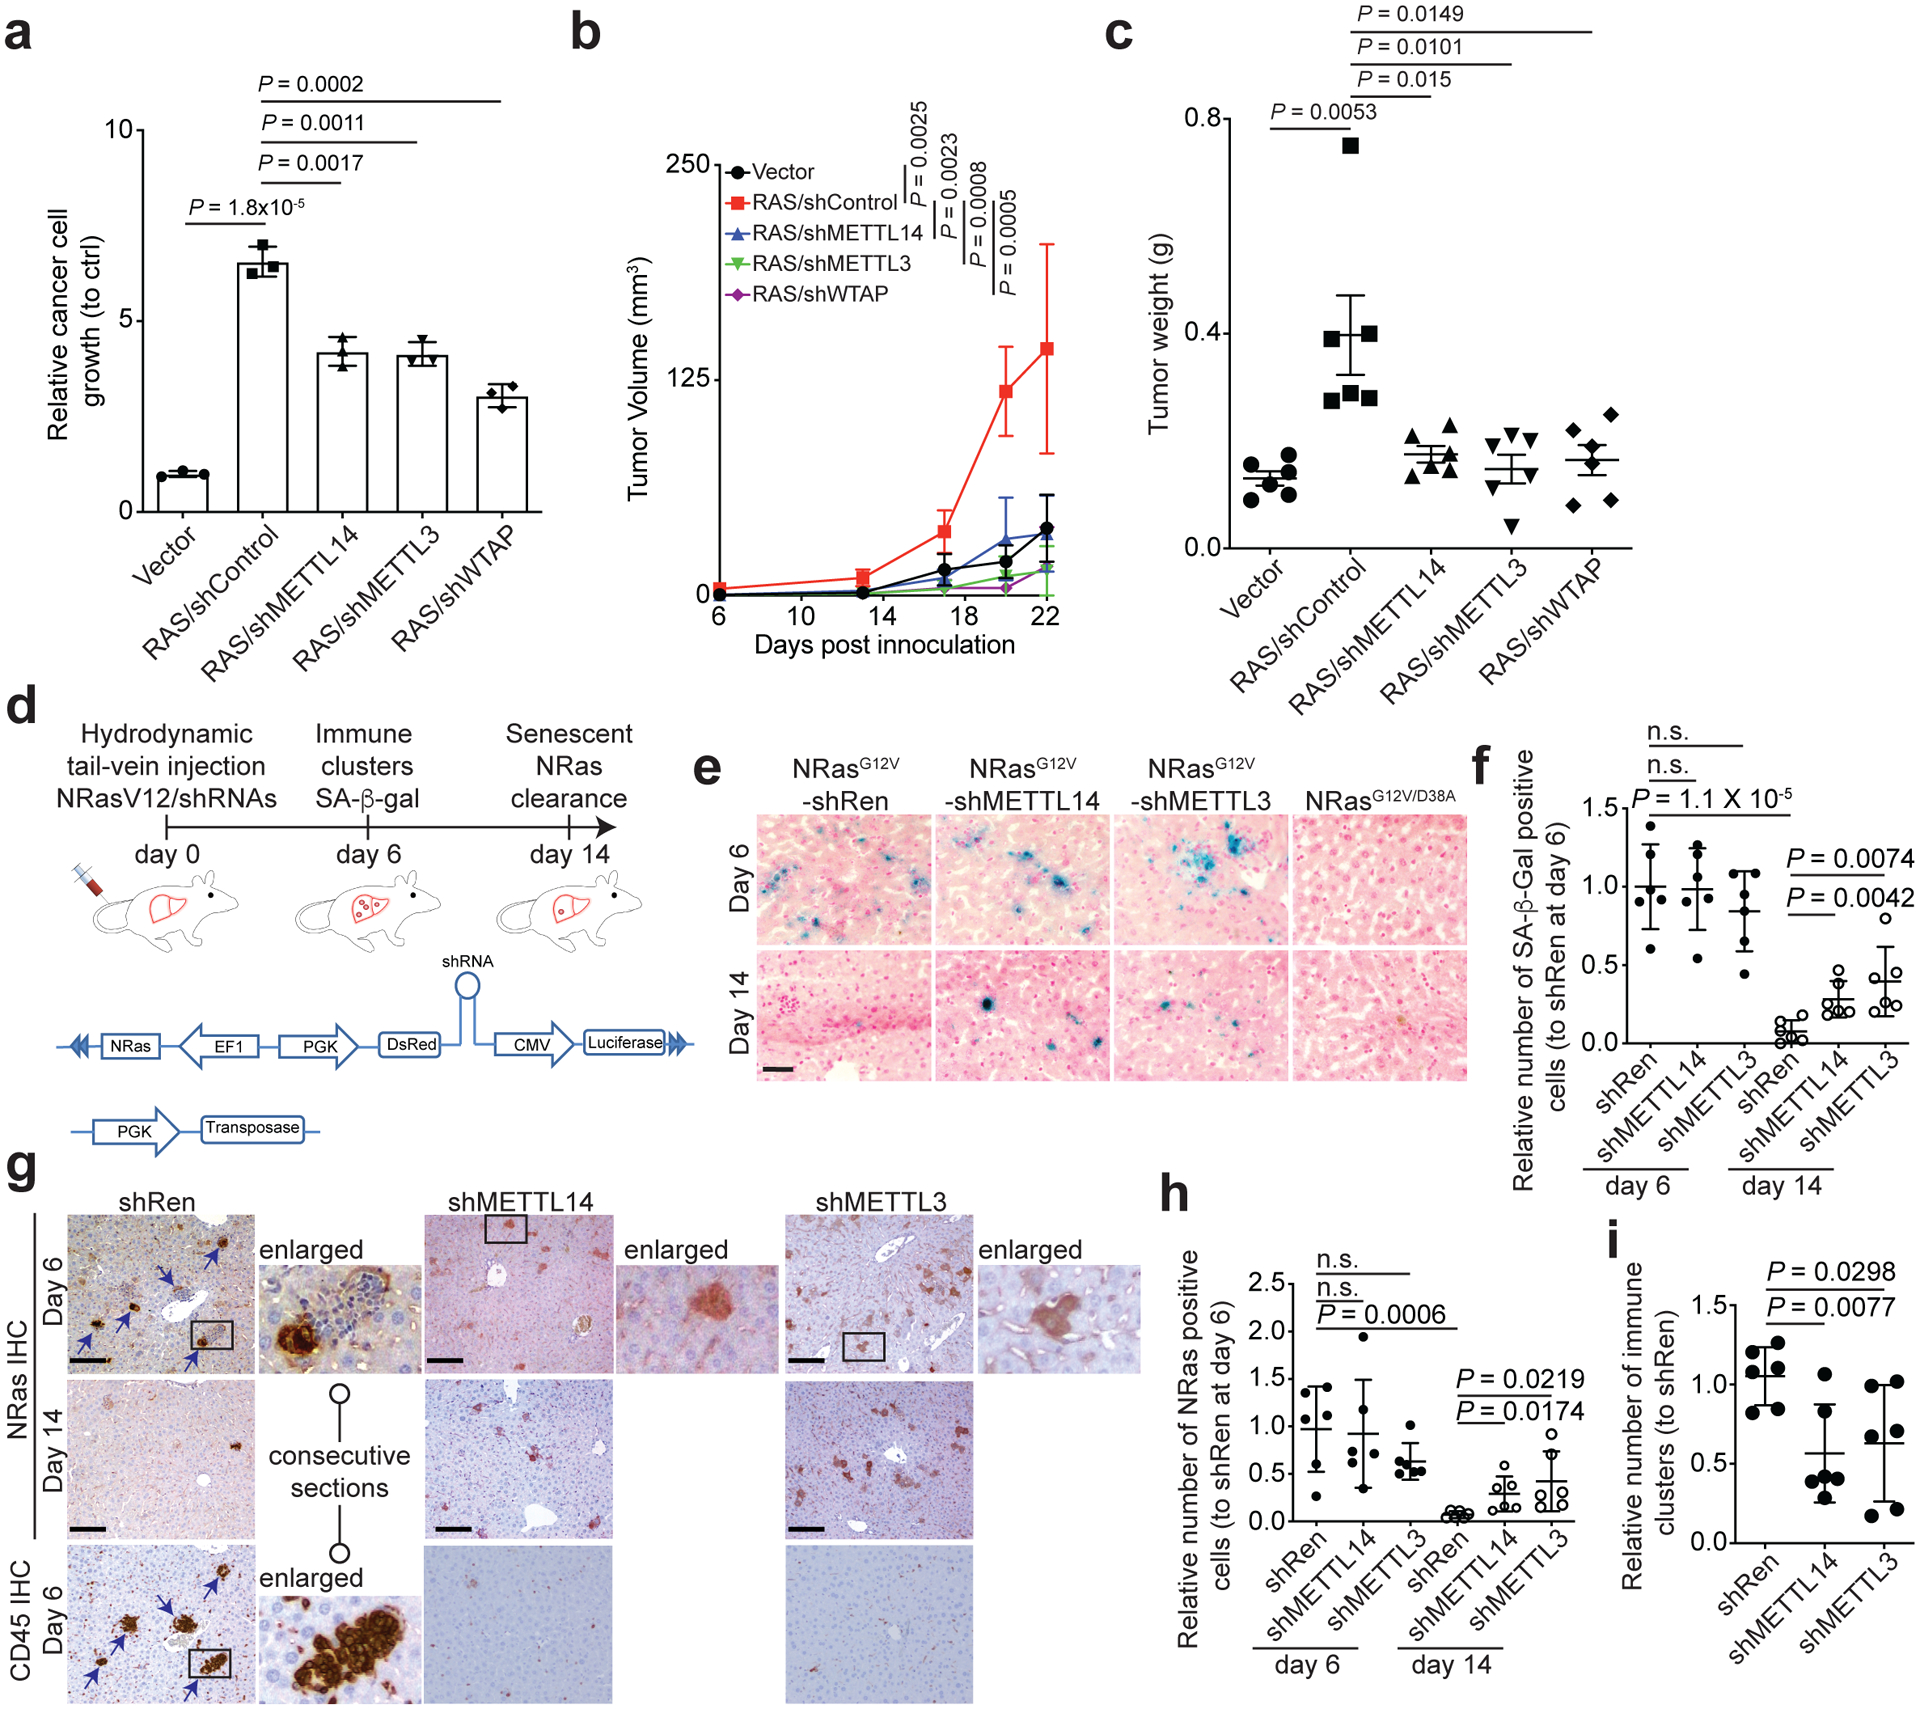
a, TOV21G ovarian cancer cell growth in conditioned media collected from control and senescent IMR90 cells without or with knockdown of METTL3, METTL14 or WTAP. After 7 days of incubation, cell number was counted and normalized against cell number from cells cultured in conditioned media collected from control proliferating IMR90 cells. b-c, Tumor growth stimulated by co-injected senescent IMR90 fibroblasts in a xenograft mouse model was inhibited by knockdown of METTL3, METTl14 or WTAP. TOV21G cells were subcutaneously co-injected with the indicated senescent IMR90 cells into 6–8-week-old NSG female mice. Tumor volume (b) was measured at the indicated time points (n=6 biologically independent mice per group) and tumor weight (c) was measured at the end of the experiment (n=6 mice/group). d, Schematic of experimental design and transposon-based constructs. e-f, Representative images of SA-β-gal staining of liver tissues from the indicated groups at day 6 and 14 post injection (e), and SA-β-gal positive cells were quantified in the indicated groups (f) (n=6 biologically independent mice per group). g-i, Representative images of immunohistochemical staining for NRas and CD45 expression in each of the indicated groups at the indicated time points. The immune clearance was indicated by comparing NRas positive cells at day 6 and remaining NRas positive cells at day 14 (h). Clusters of immune cells at day 6 were quantified (i), n=6 biologically independent mice per group. n.s., not significant. Scale bars = 50 μm. Data represent mean ± s.d. except in 7c with mean ± s.e.m. P values were calculated using a two-tailed t-test. Numerical source data for 7a, 7b, 7c, 7f, 7h and 7i are provided.
METTL3 and METTL14 are required for SASP-mediated immune surveillance
In addition to the detrimental tumor-promoting effects, SASP plays a key role in immune-modulating and surveillance of premalignant oncogene-induced senescent cells during tumor initiation12, 13. To explore the role of METTL3/METTL14-regulated SASP in immune surveillance, we used a sleeping beauty (SB) transposase-based mouse model of oncogene-induced senescence in vivo, in which senescence can be acutely induced and the fate of senescent cells can be monitored27. Specifically, hydrodynamic tail vein injection of a vector expressing SB transposase and transposon vector expressing both oncogenic NRasG12V and shMETTL14, shMETTL3 or a negative control shRenilla (shRen) causes stable integration of the transposon selectively into hepatocytes (Fig. 7d and Extended Data Fig. 10a–b). Oncogenic NRasG12V acutely triggers senescence and SASP in hepatocytes, which activates immune surveillance and clearance of premalignant hepatocytes27. At day 6 post injection, NRasG12V induced senescence and formation of immune cell clusters around NRas-positive cells (Fig. 7e–f). Indeed, clusters of immune cells were in close proximity to the NRas-expressing cells in shRen controls (Fig. 7g). As a control, a mutant NRasG12V/D39A that is incapable of inducing senescence failed to trigger senescence or induce formation of immune cell clusters (Fig. 7e and Extended Data Fig. 10c)27. Notably, similar numbers of NRas-expressing and SA-β-gal positive cells were observed in both control shRen and shMETTL14 or shMETTL3-expressing groups (Fig. 7e–i). This suggests a similar efficacy in delivering the transposon vectors in these groups. Consistent with our in vitro findings, expression of shMETTL14 or shMETTL3 did not affect SA-β-gal positive cells (Fig. 7e–f), indicating that senescence was induced at a comparable level among different groups. However, shMETTL14 and shMETTL3 significantly decreased immune cell clusters (Fig. 7g–h and Extended Data Fig. 10d). By day 14, livers from shRen-control expressing mice showed a significant reduction in NRas-expressing and SA-β-gal positive hepatocytes (Fig. 7e–h), which is consistent with immune-mediated clearance of NRas-expressing senescent cells27. In contrast, shMETTL14 and shMETTL3-expressing groups retained significantly more NRas and SA-β-gal positive cells (Fig. 7e–h). This correlates with a significant lower number of immune cell clusters in shMETTL14 or shMETTL3 groups compared to shRen-expressing groups (Fig. 7i). Together, these findings support that METTL3 and METTL14 are required for SASP-mediated immune clearance of senescent cells in vivo.
Discussion
Our study establishes a m6A-independent function of the METTL3 and METTL14 complex. The redistribution of METTL3 to promoters and METTL14 to enhancers of SASP genes suggests that the METTL3 and METTL14 complex plays an important role in regulating transcription independent of its m6A function. Notably, METTL3 and METTL14-regulated SASP genes are primarily NFκB target genes, which is consistent with our findings that METTL3 and METTL14 interact with NFκB to regulate its activity. While SASP is critical for immune surveillance and clearance of senescent cells in premalignant lesions induced by activation of oncogenes, it is detrimental in established tumors by promoting tumor growth12, 13. Therefore, our findings are consistent with the emerging evidence that MTC subunits such as METTL3 and METTL14 predominantly play an oncogenic role in cancers2, 28. In addition, independent of METTL14, METTL3 interacts with EIF3 to regulate looping of mRNA including those with m6A modification to control mRNA translation during tumorigenesis29, 30. Together, these findings suggest that compared with targeting the m6A methyltransferase activity of the MTC complex, degrading the subunits of MTC complex might be advantageous because it will simultaneously inhibit both the m6A-dependent and independent functions of the MTC. A limitation of our study is that we focused on the m6A-independent, transcription-regulating function of METTL3 and METTL14 in the context of SASP during senescence. However, we envision that the m6A-independent and transcription-regulating function of METTL3 and METTL14 may be involved in many biological processes beyond our current study.
Methods
Cells and culture conditions
IMR90 primary human diploid lung embryonic fibroblasts were cultured under low oxygen tension (2%) in DMEM supplemented with 10% fetal bovine serum, L-glutamine, sodium pyruvate, nonessential amino acids and sodium bicarbonate. All experiments were performed on IMR90 cells between population doublings of 25 and 35. Ovarian cancer TOV21G cell line was cultured in RPMI 1640 with 10% FBS and 1% penicillin/streptomycin under 5% CO2. Viral packing cells 293FT, Phoenix and mouse fibroblasts NIH 3T3 cells were cultured in DMEM with 10% FBS and 1% penicillin/streptomycin under 5% CO2. All the cells lines are authenticated at The Wistar Institute’s Genomics Facility using short tandem repeat DNA profiling. Regular mycoplasma testing was performed using the LookOut Mycoplasma PCR detection (Sigma, Cat. No: MP0035).
Reagents, plasmids and antibodies
Etoposide was purchased from Sigma (E1383), Bay 11–7082 was purchased from Selleckchem (S2913). siMETTL14 (J-014169–18), siMETTL3 (J-005170–20) and non-targeting siControl (D-001810–01) were purchased from Dharmacon. The pBABE-puro-H-RASG12V and pBABE-puro-Empty plasmids were obtained from Addgene.
The METTL3 (#53739) and METTL14 (#53740) expressing plasmids were obtained from Addgene and subcloned into pCDH vector. Site-specific mutation of FLAG-tagged METTL14 was generated using Q5 Site-Directed Mutagenesis Kit (New England Biolabs, Beverly, MA) according to manufacturer’s instructions using the following primers: Forward: 5’- AACTGTGAAGCCTAGCACAGACG-3 and Reverse: 5’-CCTTTGATCCCCATGAGG-3’. Site-specific mutation of HA-tagged METTL3 was generated using Q5 Site-Directed Mutagenesis Kit (New England Biolabs, Beverly, MA) according to manufacturer’s instructions using the following primers: Forward: 5’-AGCTTCTAGAGCCACCATGTACCCATACGATGTTCCAGATTACGCTTCGGACACGTGGAGCTCTAT-3’ and Reverse: 5’-ATATCCGCGGGTGGGGCAGCCATCACAACTGCAAA-3’; and Forward: 5’-GCCCCACCCGCGGATATTCACATGGAACTGCCCTAT-3’ and Reverse: 5’-AATTGCGGCCGCCTATAAATTCTTAGGTTTAG-3’. All mutation sites were confirmed by Sanger sequencing at The Wistar Institute’s Genomics Facility.
The scramble control shRNA (#1864), the viral packaging plasmids pMD2.G (#12259) and psPAX2(#12260) were obtained from Addgene. The following TRC lentiviral vectors encoding shRNAs against human METTL3, METTL14 and WTAP were obtained from Molecular Screening Facility at the Wistar Institute: shMETTL14-#1: TRCN0000015936; shMETTL14-#2: TRCN0000015937; shMETTL3-#1: TRCN0000034715; shMETTL3-#2: TRCN0000034716; shWTAP-#1: TRCN0000231422; and shWTAP-#2: TRCN0000231424.
The following transposon-based plasmids were used: NRasV12 expression transposon vector pKT2/Luc-FAH-PGK-EF1-V12 was kindly provided by Dr. Kirk J. Wangensteen at the University of Pennsylvania. The DNA fragment containing mouse FAH cDNA in pKT2/Luc-FAH-PGK-EF1-V12 was replaced with DsRed2-miR-30-shRenilla cassette from TRMPVIR (#27994, Addgene); miR-30 based shRNAs were designed as previously described31. shRNA sequences for validated mouse Mettl3 (5’-GCACACTGATGAATCTTTAGG-3’) or mouse Mettl14 (5’-CCTGAGATTGGCAATATAGAA-3’) were described previously32, 33. The ECMV-Luciferase cassette was replaced by CMV-Luciferase from pLenti-CMV-Puro Luc (w168–1) (#17477, Addgene). All plasmids were verified by Sanger DNA sequencing. The pKT2/Luc-PGK-NRasV12/D38A and pPGK-Transposase plasmids were described previously20.
The following antibodies were purchased from the indicated suppliers: for cut-and-run, ChIP and ChIP-sequencing: anti-METTL14 (Sigma, Cat. No: HPA038002, 5 μg per cut-and-run); anti-METTL3 (Proteintech, Cat. No: 5073–1-AP, 5 μg per cut-and-run); anti-NFκB p65 (Abcam, Cat. No: 16502, 5 μg per cut-and-run); anti-RNA polymerase II (Santa Cruz Biotechnology, Cat. No: SC-47701, 10 μg per ChIP-seq); anti-FLAG (Sigma, cat. No: F3165, clone M2, 2μg per ChIP), anti-HA (Cell Signaling, cat. No: 3724, 1:50 dilution for ChIP), IgG Isotype Control (Thermo Fisher Scientific, Cat. No: 10500C or 10400C). For m6A seq: anti-m6A (Synaptic Systems, Cat. No: 202003). For immunoprecipitation and Western blot: anti-METTL3 (Abcam, Cat. No: 195352, 2 μg/IP, 1:1000 for Western blot); anti-METTL14 (Sigma, Cat. No: HPA038002, 2 μg/IP, 1:1000 for Western blot); anti-NF-κB p65 (Cell Signaling, Cat. No: 8242, 1:1000 for Western blot); anti-phospho-p65 (Cell Signaling, Cat. No: 3033, 1:50/IP); anti-GAPDH (Sigma, Cat: No: G8795, 1: 10000 for Western blot); anti-p16 (Santa Cruz Biotechnology, Cat. No: sc-56330, 1:1000 for Western blot); anti-RAS (Becton Dickinson, Cat. No: 610001, 1:1000 for Western blot); anti-p21 (Abcam, Cat. No: 7960, 1:1000 for Western blot); anti-p53 (Millipore, cat. no. OP43, 1:1000 for Western blot); anti-WTAP (Santa Cruz Biotechnology, Cat. No: sc-374280, 1:1000 for Western blot); anti-IL1β (Abcam, Cat. No: 193852, 1:1000 for Western blot). For IHC, anti-NRas (Santa Cruz Biotechnology, Cat; No: sc-31, 1:100), anti-CD45 (BD Pharmingen™, Cat. No: 550539, 1:100) and anti-BrdU (Abcam, Cat. No: ab6326, 1:3000). Secondary antibody for immunofluorescence: Alexa Fluor 488-conjugated goat anti-rabbit IgG (H+L) (Thermo Fisher Scientific, Cat. No: A-11008, 1:1000).
Retrovirus and lentivirus production and infection
Retrovirus was produced using Phoenix cells as previously described34. Lentivirus was produced by transfection 293FT cell with FuGENE® 6 (Promega). 48 hours post transfection, supernatant virus was harvested. For gene knockdown experiments in oncogenic H-RASG12V-induced senescent cells, IMR90 cells infected with oncogenic H-RASG12V encoding or empty vector expressing retrovirus were selected by 1 μg/ml puromycin, at day 4 post infection, cells were infected with shRNA-encoding lentivirus, and then selected with 3 μg/ml puromycin.
Senescence induction and SA-β-gal staining
Senescence induced by oncogenic H-RASG12V was performed as described previously35. For ER:RAS senescence induction24, IMR90 cells were infected with lentivirus encoding a 4-hydroxy-tamoxifen (4-OHT) inducible ER:RAS construct (pLNC-ER:Ras), after two-weeks of selection with G418 (400 μg/ml, Gibco), cells were maintained with lower dose of G418 (200 μg/ml) and treated with 4-OHT at a final concentration of 100 nM, cells were harvested to examine the expression of RAS and other markers at indicated time points. For etoposide-induced senescence, IMR90 cells at approximately 60–70% confluency were treated with 100 μM etoposide for 48 hours, and then washed with PBS, replaced with normal media. Cells were harvested for analysis at day 8 as described20. For SA-β-gal staining, cells were fixed using 2% formaldehyde/0.2% glutaraldehyde in PBS then washed twice with PBS. Cells were then incubated in X-Gal solution (150 mM NaCl, 40 mM Na2HPO4 (pH 6.0), 2 mM MgCl2, 5 mM K3Fe(CN)6, 5 mM K4Fe(CN)6 and 1 mg ml−1 X-gal) overnight at 37 °C in a non-CO2 incubator. For mice liver tissue, frozen sections were fixed and stained at pH 5.5 for 5–8 hours as previously described36.
BrdU incorporation and immunofluorescence
IMR90 cells were labeled with BrdU at the final concentration of 3 μg/ml at 37°C for 3 hours and fixed with 4% paraformaldehyde (PFA) for 30 mins at room temperature, 2N HCL was used to denature DNA for the access to visualize the incorporated BrdU. NIH3T3 cells were transfected with 2.5 μg NRASG12V-dsRed-shRNA plasmid and 0.5 μg PGK-SB using FuGENE® 6 (Promega), and fixed with 4% paraformaldehyde (PFA) for 10 mins at room temperature followed by permeabilization with 0.2% Triton X-100 in PBS for 5 min. After blocking with 3% BSA in PBS, cells were incubated with primary antibody overnight at 4°C and Alexa-Fluor conjugated secondary antibody (Life Technologies).
RNA sequencing
At day 4 post vector control or RAS expressing retrovirus infection, IMR90 cells were seeded and transfected with non-targeted siControl, siMETTL14 or siMETTL3 using Lipofectamine™ RNAiMAX. Cells were transfected with siRNA again and infected with lentivirus encoding siMETTL14 resistant (siRNA targeting sequence mutagenesis was performed by using the following primers: Forward:5’-TTGGCAATCAATTCGTCTTTTAGCCTGATGAGCTCCCT-3’ and Reverse: 5’-AAAGACGAATTGATTGCCAAATCTAACACTCCTCCCATG-3’) wildtype or a R298P mutant METTL14, or siMETTL3 resistant (siRNA targeting sequence mutagenesis was performed by using the following primers: Forward: 5’-CTACATTTTAGGCGCATAATCAATAAACACACTGATG-3’ and Reverse: 5’-TTATGCGCCTAAAATGTAGCTTGCGACAGGGTCGATC-3’) wildtype or a D394A/W397A mutant METTL3 on the next day. Cells were harvested 48 hours post infection and RNA was extracted using RNeasy mini Kit (Qiagen, 74106) and digested with DNase I (Qiagen, 79254). For METTL14 rescue experiment, libraries were prepared using Lexogen kit and sequenced in 75bp single-end run. For METTL3 rescue experiment, libraries were prepared using KAPA RNA HyperPrep kit and sequenced in 75bp paired-end run. Libraries were sequenced with Illumina NextSeq 500 at the Wistar Genomics Facility.
m6A RNA and chromosome-associated regulatory RNA (caRNA) immunoprecipitation and sequencing
Total RNA was isolated from control or oncogenic RAS-induced senescent IMR90 cells 9 days post infection (three independent batches of cells were collected) using the RNeasy maxi kit (Qiagen, 75162) and digested with DNase I (Qiagen, 79254). polyA+ RNA was purified using the GenElute mRNA Miniprep kit (Sigma). Immunoprecipitation, library construction and sequencing were performed according to the published protocol37 and as we previously published38. Briefly, purified mRNA was fragmented using ZnCl2 buffer into ~100 nt and subjected to immunoprecipitation with an anti-m6A antibody. m6A-containing mRNAs eluted by free m6A and input fragments from control and senescent cells were used for library preparation. caRNA sequencing was performed as described9, 39. The caRNA was extracted from the chromosome-associated fraction, followed by fragmentation and immunoprecipitation. rRNA-depleted caRNA (QIAseq FastSelect kit) was used for library preparation and sequencing was performed with Illumina NextSeq 500 using 75 bp paired-end run at the Wistar Genomics Facility.
ChIP and ChIP-sequencing
Briefly, cells were fixed using 1% formaldehyde (Sigma, Cat. No: F8775) for 10 min at room temperature, quenched with 2.5 M glycine, washed with cold PBS twice and then lysed using ChIP lysis buffer 1 (50 mM HEPES-KOH (pH 7.5), 1 mM EDTA (pH 8.0), 140 mM NaCl, 1% Triton X-100 and 0.1% sodium deoxycholate (DOC) with 0.1 mM PMSF and EDTA-free Protease Inhibitor Cocktail). Following incubation on ice for 10 min, the lysed samples were centrifuged at 3,000 r.p.m. for 3 min at 4 °C. The resulting pellet was resuspended in lysis buffer 2 (10 mM Tris pH 8.0, 1 mM EDTA, 200 mM NaCl and 0.5 mM EGTA with 0.1 mM PMSF and EDTA-free Protease Inhibitor Cocktail) and incubated at room temperature for 10 mins before centrifugation at 3,000 r.p.m. for 5 min at 4 °C. The resulting pellet was resuspended in lysis buffer 3 (100 mM NaCl, 10 mM Tris-Hcl pH 8.0, 1 mM EDTA, 0.1% DOC, 0.5 mM EGTA and 0.5% N-lauroylsarcosine with 0.1 mM PMSF and EDTA-free Protease Inhibitor Cocktail) and sheared using a Bioruptor (Diagenode) for 25 min (30 sec on and 30 sec off). Following centrifuge, the supernatant was incubated with antibody or IgG overnight at 4 °C. After incubation with protein A/G Dynabeads (Thermo Fisher) for 2 hours at 4 °C, ChIP samples were washed at 4 °C using ChIP lysis buffer 1 containing 0.65 M NaCl, wash buffer (250 mM LiCl, 10 mM Tris-HCl pH 8.0, 0.5% DOC, 0.5% NP-40 and 1 mM EDTA pH 8.0), and TE buffer. Subsequently, DNA was eluted by incubation of the beads with TE buffer plus 1% SDS for 15 mins at 65 °C. The samples were then incubated overnight at 65 °C to reverse crosslinking. The next day, the samples were digested with proteinase K and the DNA was purified using a Wizard SV Gel and PCR Clean Up kit (Promega). Quantitative PCR was performed on the immunoprecipitated DNA using iTaq Universal SYBR Green (Bio-Rad Laboratories) using primers listed in Supplementary Table 1.
10 ng of ChIP DNA was used for ChIP-seq library construction using NEBNext Ultra DNA Library Prep Kit (NEB, E7645) and the ChIP-seq libraries were sequenced in a 75 bp single-end run on the Next Seq 500 (Illumina) at Wistar Genomic facility.
Cut-and-run sequencing
Cut-and-run was performed as described40. Briefly, cells were harvested, and gently washed twice using wash buffer (20 mM HEPES pH 7.5, 150 mM NaCl, 0.5 mM spermidine and EDTA-free Protease Inhibitor Cocktail). Cells were then incubated with the antibody overnight in the buffer (Wash buffer supplemented with 0.05% digitonin and 2 mM EDTA) at 4°C. The next day, supernatant was removed by centrifuge and cell pellets were washed once with Dig-wash buffer (Wash buffer containing 0.05% digitonin). Cell pellets were then incubated with Protein A-MNase (700 ng/ml in Dig-wash buffer) for 1 hour by rotation at 4°C. After three times of wash, cell pellets were resuspended in 100 μl Dig-wash buffer with 2 μl 100 mM CaCl2, incubated at 0°C for 30 mins, and then reactions were stopped by addition of 100 μl 2 × STOP buffer (340 mM NaCl, 20 mM EDTA pH 8.0, 4 mM EGTA, 0.05% digitonin, 50 μg/ml RNase A, 50 μg/ml glycogen and 2 pg/ml heterologous spike-in yeast DNA). The supernatant DNA was collected after centrifuge and further purified using phenol–chloroform–isoamyl alcohol (Sigma, Cat. No: p3803), chloroform extraction and ethanol precipitation. Cut-and-run DNA was analyzed by qPCR or used for DNA library construction for sequence as described above.
Immunoprecipitation, chromatin fractionation and immunoblot
For immunoprecipitation, cells were lysed with buffer (150 mM NaCl, 1% NP40, 20% Glycerol, 1 mM EDTA, 50 mM Tris-HCl pH 8.0, 1 mM PMSF, EDTA-free protease inhibitor cocktail). After briefly sonication, 1–2 mg of cell lysates were incubated with anti-METTL3, anti-METTL14, anti-phospho-p65 or the corresponding IgG controls at 4°C. Protein A/G beads (Thermo fisher) were pre-blocked by 5% BSA/PBS, and then incubated with proteins for 1.5 hour at 4 °C. After three times of washing (200 mM NaCl, 0.5% Triton X-100, 1 mM EDTA, 50 mM Tris-HCl pH 7.5, 1 mM PMSF, EDTA-free protease inhibitor cocktail), beads were boiled in 1X sample buffer (10% glycerol, 2% SDS, 0.01% bromophenol blue, 0.1 M dithiothreitol and 62.5 mM Tris-Hcl pH 6.8) and analyzed by immunoblot.
For chromatin fractionation, the cell pellets were resuspended in buffer A (10 mM Hepes-KOH, pH 8.0, 10 mM KCl, 1.5 mM MgCl2, 0.34 M sucrose, and 10% glycerol, pH 7.5, plus the EDTA-free Protease Inhibitor Cocktail, 1 mM DTT, and 0.1 mM PMSF) with 0.1% Triton X-100. Cells were incubated on ice for 5 min and then pelleted at 1,300 g for 4 min at 4°C. The pellet was washed in buffer A, after which it was resuspended in buffer B (3 mM EDTA, pH 8.0, and 0.2 mM EGTA, pH 8.0, plus the EDTA-free Protease Inhibitor Cocktail, 1 mM DTT, and 0.1 mM PMSF). Samples were incubated on ice for 30 min and then centrifuged at 1,700 g for 4 min at 4°C. The pellet was washed once in buffer B and finally resuspended in sample buffer.
Protein was isolated for immunoblotting by lysing cells in 1X sample buffer. Equal amounts of protein were loaded and separated by SDS-polyacrylamide gel electrophoresis (SDS-PAGE) and transferred to polyvinylidene fluoride membrane (Millipore). Membranes were blocked with 5% non-fat milk and then incubated with primary antibodies and secondary antibodies.
Antibody array analysis
The antibody array for secreted factors was performed using Human Inflammation Array 3 kit (QAH-INF-3) by RayBioTech following the manufacturer’s instructions as we previously described35. Briefly, culture media were collected following PBS wash and incubation in serum-free DMEM for 12 hours. The media was filtered (0.2 μm) and incubated on the array overnight at 4 °C. Following incubation, the array was washed five times with wash buffer I and then two times with wash buffer II at room temperature. The array was then incubated with the biotinylated antibody cocktail for 2 hours at room temperature before being washed five times with wash buffer I and then two times with wash buffer II at room temperature. The array was then incubated with Cy3 dye-conjugated streptavidin and incubated in the dark at room temperature for 1 hour. Following incubation, the array was washed five times with wash buffer I and then washed two times with wash buffer II before allowing to dry at room temperature in the dark. Cy3 signals were measured using an Amersham Typhoon imaging system and normalized to the cell number from which the media was generated.
Chromatin conformation capture (3C)
3C was performed as previously described41, 42. Briefly, five million cells were fixed with 1% formaldehyde in fresh media and quenched by 0.2 M glycine at room temperature for 10 min. Cells were lysed in cold Hi-C lysis buffer (10 mM Tris, pH 8.0, 10 mM NaCl, 0.2% IGEPAL CA-630 with proteinase inhibitor) for 15 min, followed by a wash with 500 μl cold lysis buffer. The cell pellet was permeabilized in 0.5% SDS at 62°C for 10 mins and quenched by adding 145 μl of water and 25 μl of 10% Triton X-100, and incubate at 37°C for 15 min. 25 μl of 10X NEBuffer2 and 100 U of MboI were added to digest the chromatin overnight at 37°C with rotation. Following inactivation of Mbo I at 62°C for 20 min, the ligation was performed at room temperature for 4 hours with rotation by adding 750 μl of ligation master mix [100 μl of 10× NEB T4 DNA ligase buffer, 80 μl of 10% Triton X-100, 10 μl of BSA (10 mg/ml), 5 μl of T4 DNA ligase (400 U/μl), and 555 μl of water]. Following centrifugation at 10,000 rpm for 5 min, reverse cross-linking was performed at 68°C for at least 4 hours. DNA was then purified by phenol/chloroform extraction and ethanol precipitation. Primer was designed following the qPCR primer design standard and primers no more than 100 nt close to Mbo I sites were selected (Supplementary Table 1)
Colony formation assay
Cells were seeded at the density of 3,000 cells per well in 6-well plate and cultured for 10 days before staining with 0.05% crystal violet for visualization. Analysis was performed based on integrated density using NIH ImageJ 1.48v software.
Conditioned medium
For conditioned medium collected from senescent cells induced by wildtype or mutant METTL3 or METTL14, the senescent cells were cultured in DMEM with 0.5% FBS for 7 days and filtered and mixed with DMEM with 40% FBS in a ratio of 6 to 1 to generate conditioned medium with 5% FBS. The conditioned medium was used to culture proliferating IMR90 cells for 5 days to induce senescence. For stimulation of tumor cells growth, conditioned medium was collected from control or RAS-induced senescent cells incubated in serum-free DMEM for 12 hours. Conditioned media were filtered and mixed with DMEM+2% FBS to generate culture media containing 0.5 % FBS. TOV21G cells were cultured in the conditioned media and refreshed every day. The cancer cell growth was determined by counting cell number at day 7.
Reverse-transcriptase quantitative PCR
Total RNA was harvested using Trizol (Invitrogen) and isolated using RNeasy mini kit (Qiagen, 74106). Extracted RNAs were used for reverse-transcriptase PCR (RT-PCR) with High-Capacity cDNA Reverse Transcription Kit (Thermo fisher). Quantitative PCR (qPCR) was performed using QuantStudio 3 Real-Time PCR System. Primers used for qRT-PCR are listed in Supplementary Table 1.
NF-κB reporter assay
NF-κB luciferase reporter plasmid (Addgene, Cat. No: 49343) and Renilla luciferase plasmid (pRL-SV40, Promega, Cat. No: E223A) were co-transfected using Lipofectamine 3000 Reagent (Invitrogen) and assayed for luminescence using a Dual-Luciferase Reporter Assay System (Promega, Cat. No: E1910). Luminescence signal was measured using a Victor X3 2030 Multilabel Reader (Perkin Elmer).
3D DNA-FISH
The BAC clone RP11–1033M8 containing the IL1β gene locus was purchased from the Children’s Hospital Oakland Research Institute. 3D DNA-FISH was performed as described previously43. Probes were generated through PCR using the BAC clone as template with the following primers: For promoter probe: 5’-AGTTGAACCTTCTGCCCTGG-3 (forward) and 5’-CCCTCTTTGCTCTCCACTGA-3’ (reverse) and for enhancer probe: 5’- ACCTGGCTGCTTAACGTACT-3’ (forward) and 5’-TTAGGGTCCTTAGGCATGGC-3’ (reverse). Probes targeting the promoter and enhancer region were labeled using the BioPrime DNA Labeling System kit (Invitrogen) and DIG DNA Labeling Kit (Roche), respectively. Probes were dissolved in 50% formamide/2XSSC/10% dextran sulfate, denatured for 5 min at 73°C and then pre-annealed for 30 min at 37°C.
Cells were treated with 0.075 M KCl hypotonic buffer, fresh fixative (3:1 MeOH/acetic acid) was added to the KCl buffer and incubated for 10 mins at room temperature. The solution was removed, and cells were fixed in 3:1 MeOH/acetic acid overnight at 20°C. After wash with fresh fixative, cells were treated with RNase A, followed by 0.1 mg/ml pepsin/0.01 M HCl and then postfixed in 1% PFA/50 mM MgCl2 for 10 min at room temperature. After wash with PBS, cells were dehydrated in an EtOH series (at 70%, 80%, and then 100% concentrations) for 2 min each and dried. DNA was denatured in 70% formamide/2XSSC at 73°C for 3 min, immediately dehydrated in the same order of EtOH series and dried, and then hybridized to the probes overnight at 37°C. Coverslips were washed for 10 mins at 43°C with prewarmed 50% formamide/2X SSC (twice), for 4 mins at 37°C with prewarmed 2X SSC (twice), and for 5 min at room temperature with 1X PBS (4X SSC, pH 7.0, and 0.05% Tween 20). After blocking with 4X SSC/0.05% Tween 20/5% milk, coverslips were incubated with FITC–Avidin D (1:100; Vector Laboratories) and anti-DIG-DyLight® 594 (1:200; Vector Laboratories) at room temperature followed by wash with blocking buffer while shaking. Coverslips were mounted, images were acquired using a Leica TCS SP5 II scanning confocal microscope.
In vivo mouse models
All the protocols were approved by the IACUC of Wistar Institute or University of Pennsylvania.
Mice were maintained at 22–23 °C with 40–60% humidity and a 12 hours light/12 hours dark cycle. For xenograft mouse models, 0.5×10⁶ TOV21G cells with or without 1×10⁶ IMR90 in PBS and mixed with Matrigel at 1:1 volume ratio were injected subcutaneously into the 6–8-week-old female immunocompromised non-obese diabetic/severe combined immunodeficiency (NOD/SCID) gamma (NSG) mice. Tumor size was measured using an electronic caliper and calculated using the formula: tumour size (mm3) = [d2 × D]/2, where d and D are the shortest and the longest diameter, respectively.
For Hydrodynamic tail veil injection, 8-week old female C56BL/6 mice were used. For each injection, endotoxin-free transposon-based construct expressing NRas and miR30-based shRNAs (25 μg) together with endotoxin-free transposase plasmid (5 μg) in 0.9% saline at a volume of 10% of mouse body weight were mixed and delivered into mice within 5–8 seconds as previously described27.
Immunochemistry
Fresh mouse liver tissues were fixed in 4% paraformaldehyde/PBS overnight at 4°C, or embedded in OCT for cryosection. For IHC staining, slides were deparaffinized, rehydrated, quenched in 0.6% hydrogen peroxide/methanol for 15 mins, and boiled for 20 mins in 10 mM citrate (pH 6.0) buffer for antigen retrieval. Slides were incubated with blocking buffer (5% serum, 1% BSA and 0.5% Tween-20 in PBS) for 1 hour at room temperature, and then incubated with relevant primary antibodies diluted in blocking buffer overnight at 4°C. Slides were further incubated with biotinylated secondary antibodies followed by ABC solution and developed with 3,3-diaminobenzidine (Vector Laboratories). Slides were finally counterstained with hematoxylin, dehydrated, and mounted with Permount (Thermo Fisher). For quantification, 20–30 10x fields per mouse were counted.
Bioinformatics analysis
For m6A-seq, raw sequencing data was aligned using bowtie244 against hg19 version of the human genome. HOMER45 was used to generate bigwig files and call m6A peaks (FDR<5%, at least 4 fold) in control and senescent cells versus corresponding total RNA input. De-novo motif analysis using HOMER identified most enriched consensus motif (AGGACT) in 71% of all FDR<5% peaks from exonic regions. Average signal around genes TSS and 3’ UTR were derived from bigwig files using bigWigAverageOverBed tool from UCSC toolbox46 with “mean0” option using 10bp bins for m6A and RNA input samples and m6A to RNA input ratio was used as normalized m6A signal.
For car-m6A-seq, raw sequencing data was aligned using bowtie244 against hg19 version of the human genome. HOMER45 was used to generate bigwig files and call m6A peaks (FDR<5%, at least 4 fold) in control and senescent cells with WT or METTL3 and METTL14 knockout versus corresponding total RNA input. Peaks corresponding to promoter-associated caRNAs (within 1kb from TSS) and enhancer-associated (overlap with H3K27ac sites) caRNAs were identified and assigned to genes with the closest TSS. Average signal within the peaks was derived from bigwig files using bigWigAverageOverBed tool from UCSC toolbox46 with “mean0” option and m6A signal was normalized to corresponding input. Kmeans clustering was performed on Z-score scaled normalized signal values.
RNA-seq data was aligned using bowtie244 against hg19 version of the human genome and RSEM v1.2.12 software47 was used to estimate raw read counts and RPKM values using Ensemble transcriptome. DESeq248 was used to estimate significance of differential expression between groups pairs. Overall gene expression changes were considered significant if passed FDR<5% thresholds unless stated otherwise. Significance of overlap between sets of genes was estimated using Fisher Exact Test with 12994 genes in METTL14 rescue experiment and 17730 genes in METTL3 rescue experiment detected by least 10 read counts in at least one sample used as background.
For cut-and-run and ChIP-seq, raw H3K27ac ChIP-seq data for proliferating and senescent cells was downloaded from GEO (accession number GSE74238) and replicates for input and H3K27ac data were pooled. Cut-and-run and ChIP-seq data was aligned using bowtie49 against hg19 version of the human genome and HOMER 4.1045 was used to generate bigwig files with default normalization parameters and call significant peaks vs IgG control using options “-style histone” for factors METLL3, METTL14, p65, H3K27ac. Peaks that passed FDR<5% at least 4 fold over control threshold were considered significant. Normalized binding signals were derived from bigwig files using bigWigAverageOverBed tool from UCSC toolbox46 with mean0 option over peak region for peak signal and 50bp window centered at peaks center for heatmaps and line plots (signal over gene body was derived using 2% windows). Fold differences between samples were calculated with average input signal 0.4 (average input value) used as a floor for the minimum allowed signal and changes of at least 2 fold between samples were considered significant. Distance from TSS of 10kb for METTL3 and p65 and 100kb for METTL14 and H3K27ac was used for gene-peak assignments.
Statistics & Reproducibility
Analysis of variance with Fisher’s least significant difference was used to identify significant differences in multiple comparisons. An unpaired two-tailed Student’s t-test was used for comparison between two groups. Experiments were repeated 3 times experimentally unless otherwise stated. Quantitative data are expressed as mean ± s.d. or s.e.m as defined in figure legends. No statistical method was used to predetermine sample size. No data were excluded from the analyses. All analysis was performed blindly but not randomly. Animal experiments were randomized. Prism 7.0c, 8.4.2 was used for calculating P values.
Reporting Summary
Further information on research design is available in the Nature Research Reporting Summary linked to this article.
Code availability
The software and algorithms for data analyses used in this study are all well-established from previous work and are referenced throughout the manuscript.
Data availability
Cut-and-run, ChIP-seq and RNA-seq data that support the findings of this study have been deposited in the Gene Expression Omnibus (GEO) under accession number: GSE141944 (RNA-seq for METTL3 knockdown and rescue: GSE159551; RNA-seq for METTL14 knockdown and rescue: GSE141991; cut-and-run and ChIP-seq: GSE141992; m6A-seq: GSE141993; and carRNA m6A-seq: GSE159550). For the correlation analysis between METTL14 and SASP genes in human laser capture and microdissected PanIN lesion samples, gene expression data were obtained from GEO (under accession code GSE43288). Source data for unprocessed immunoblots for Fig. 1a, 1e, 1h, 4c and Extended Data Fig. 4d, 5a, 5f, 6a, 8e, 8k, 8l and source data used for statistical analyses have been provided as Source Data files. All other data supporting the findings of this study are available from the corresponding author on reasonable request.
Extended Data
Extended Data Fig. 1. METTL3 and METTL14-dependent changes in transcriptome during senescence.
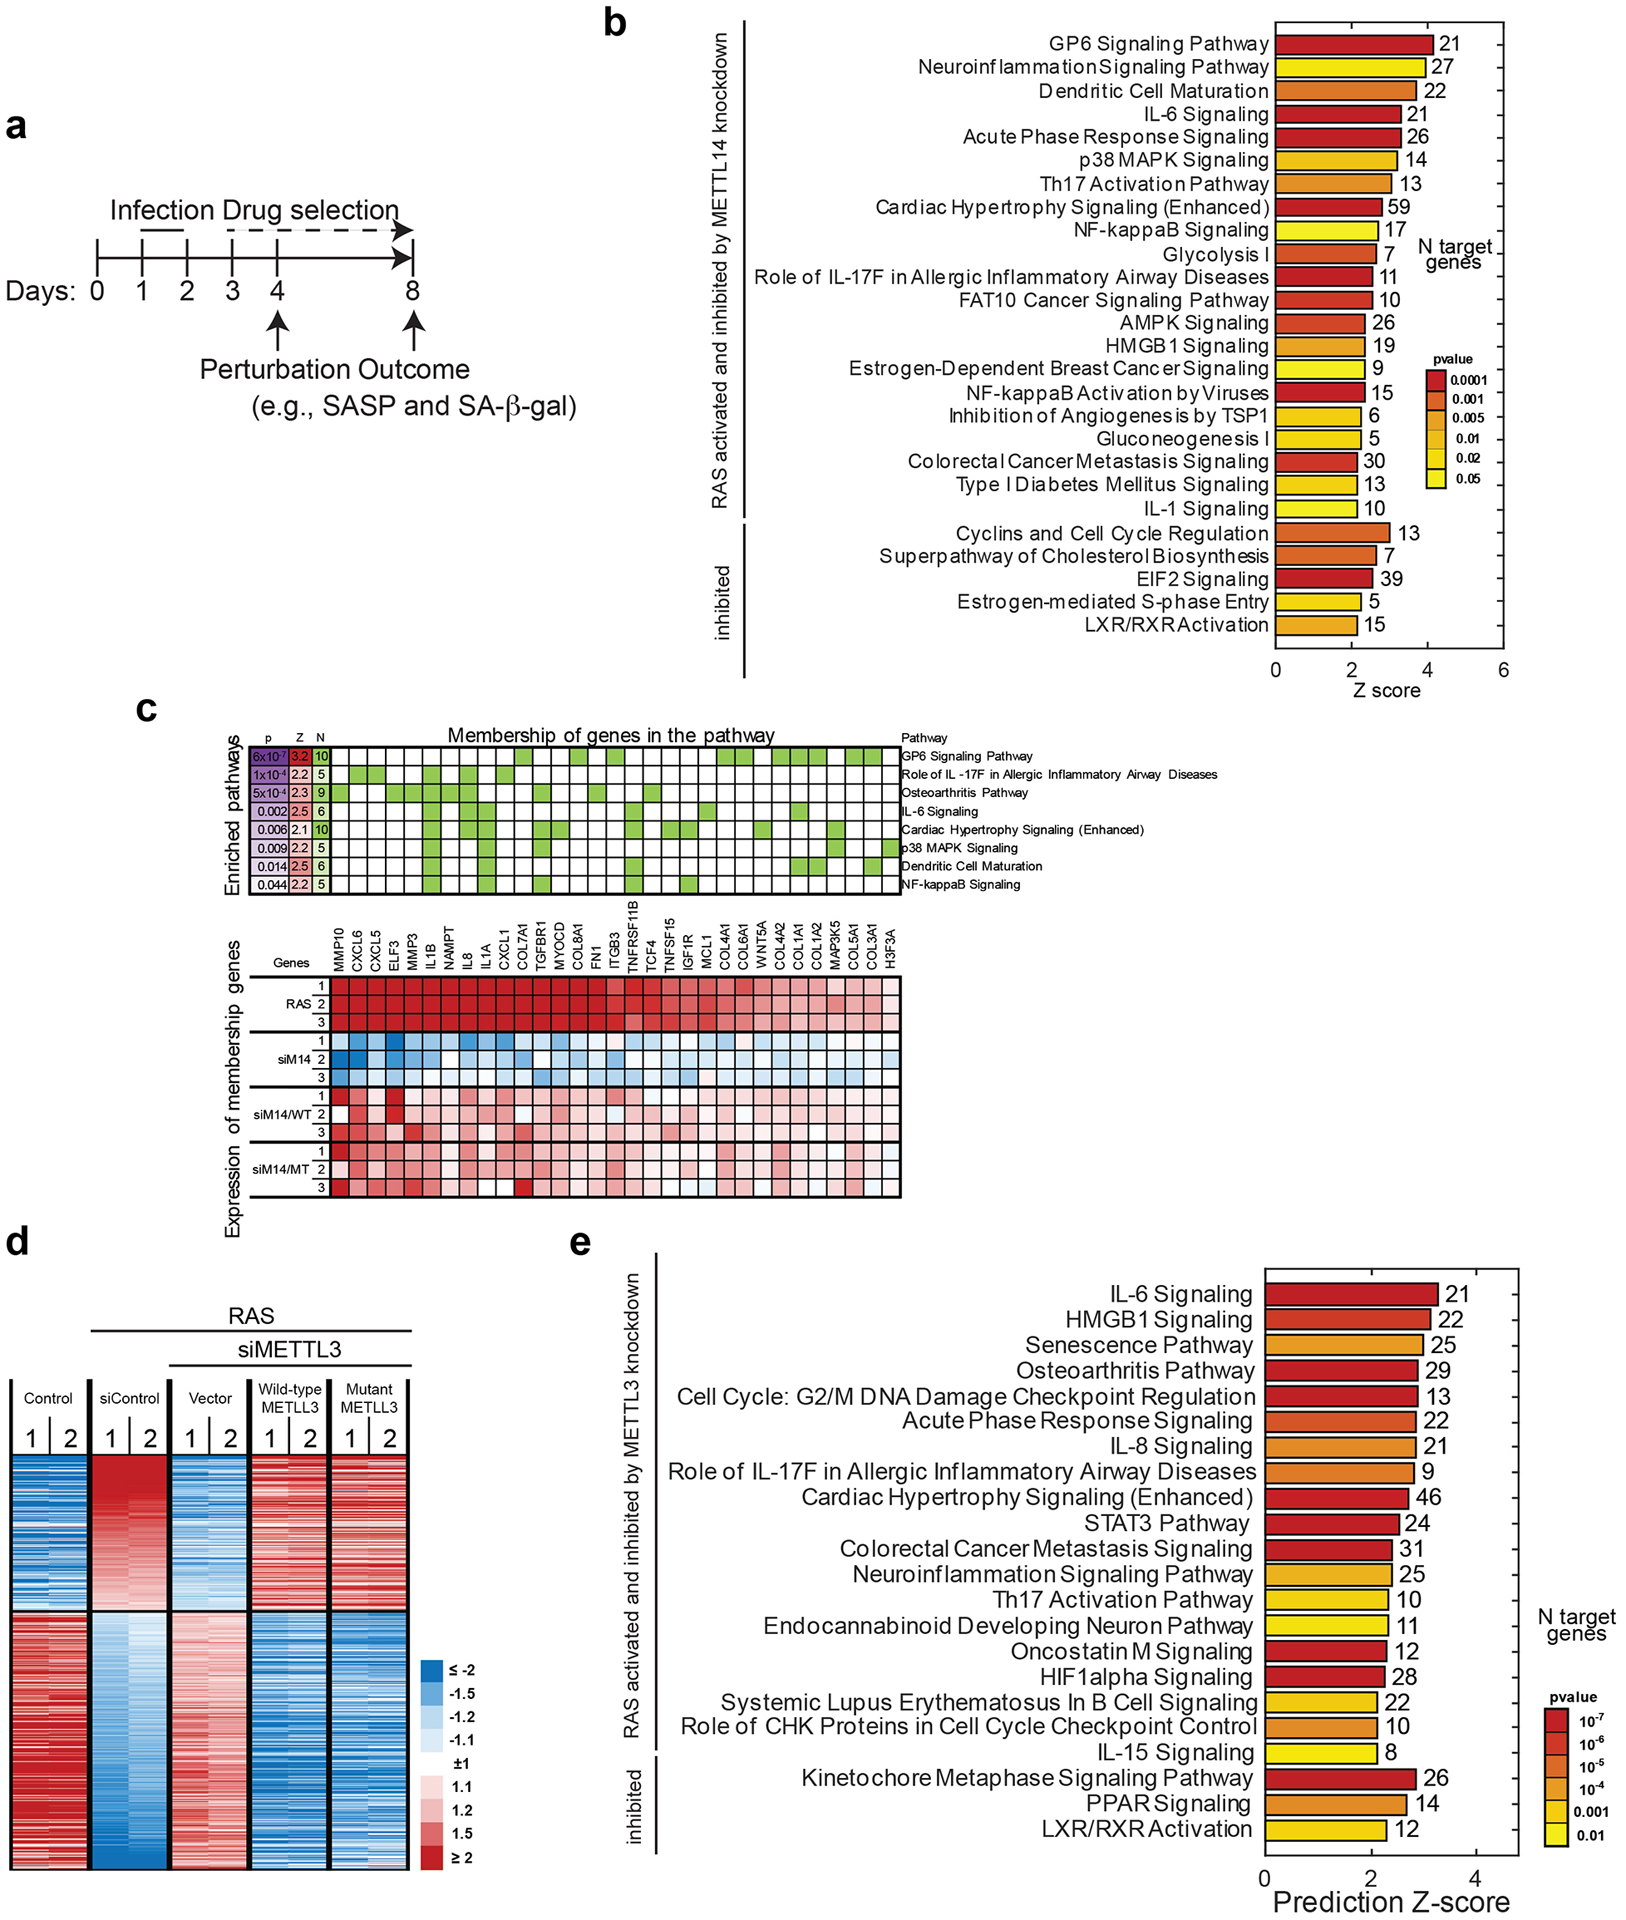
a, Schematic of experimental timeline using oncogenic-H-RASG12V to induce senescence in IMR90 cells. b-c, IMR90 cells were induced to senesce by oncogenic RAS expressing a non-targeting siRNA control (siControl) or METTL14-targeted siRNA (siMETTL14) with or without the rescue of ectopically expressed wildtype or the R298P mutant METTL14 were subjected to RNA-seq analysis. Ingenuity pathway enrichment analysis of genes altered by siMETTL14 (b) and rescued by both wildtype and the R298P mutant METTL14 (c) are shown. d-e, Heatmap of RNA-seq data with 2 replicates in each of the groups for the genes whose expression significantly changed by METTL3 knockdown and rescued by both wildtype and the D394A/W397A mutant METTL3 (d). Ingenuity pathway enrichment analysis of genes altered by siMETTL3 (e) is shown. p = p value, Z = activation z-score, N = number of genes. P values were calculated using a two-tailed Fisher Exact test.
Extended Data Fig. 2. MTC regulates SASP during both oncogene and chemotherapy-induced senescence.
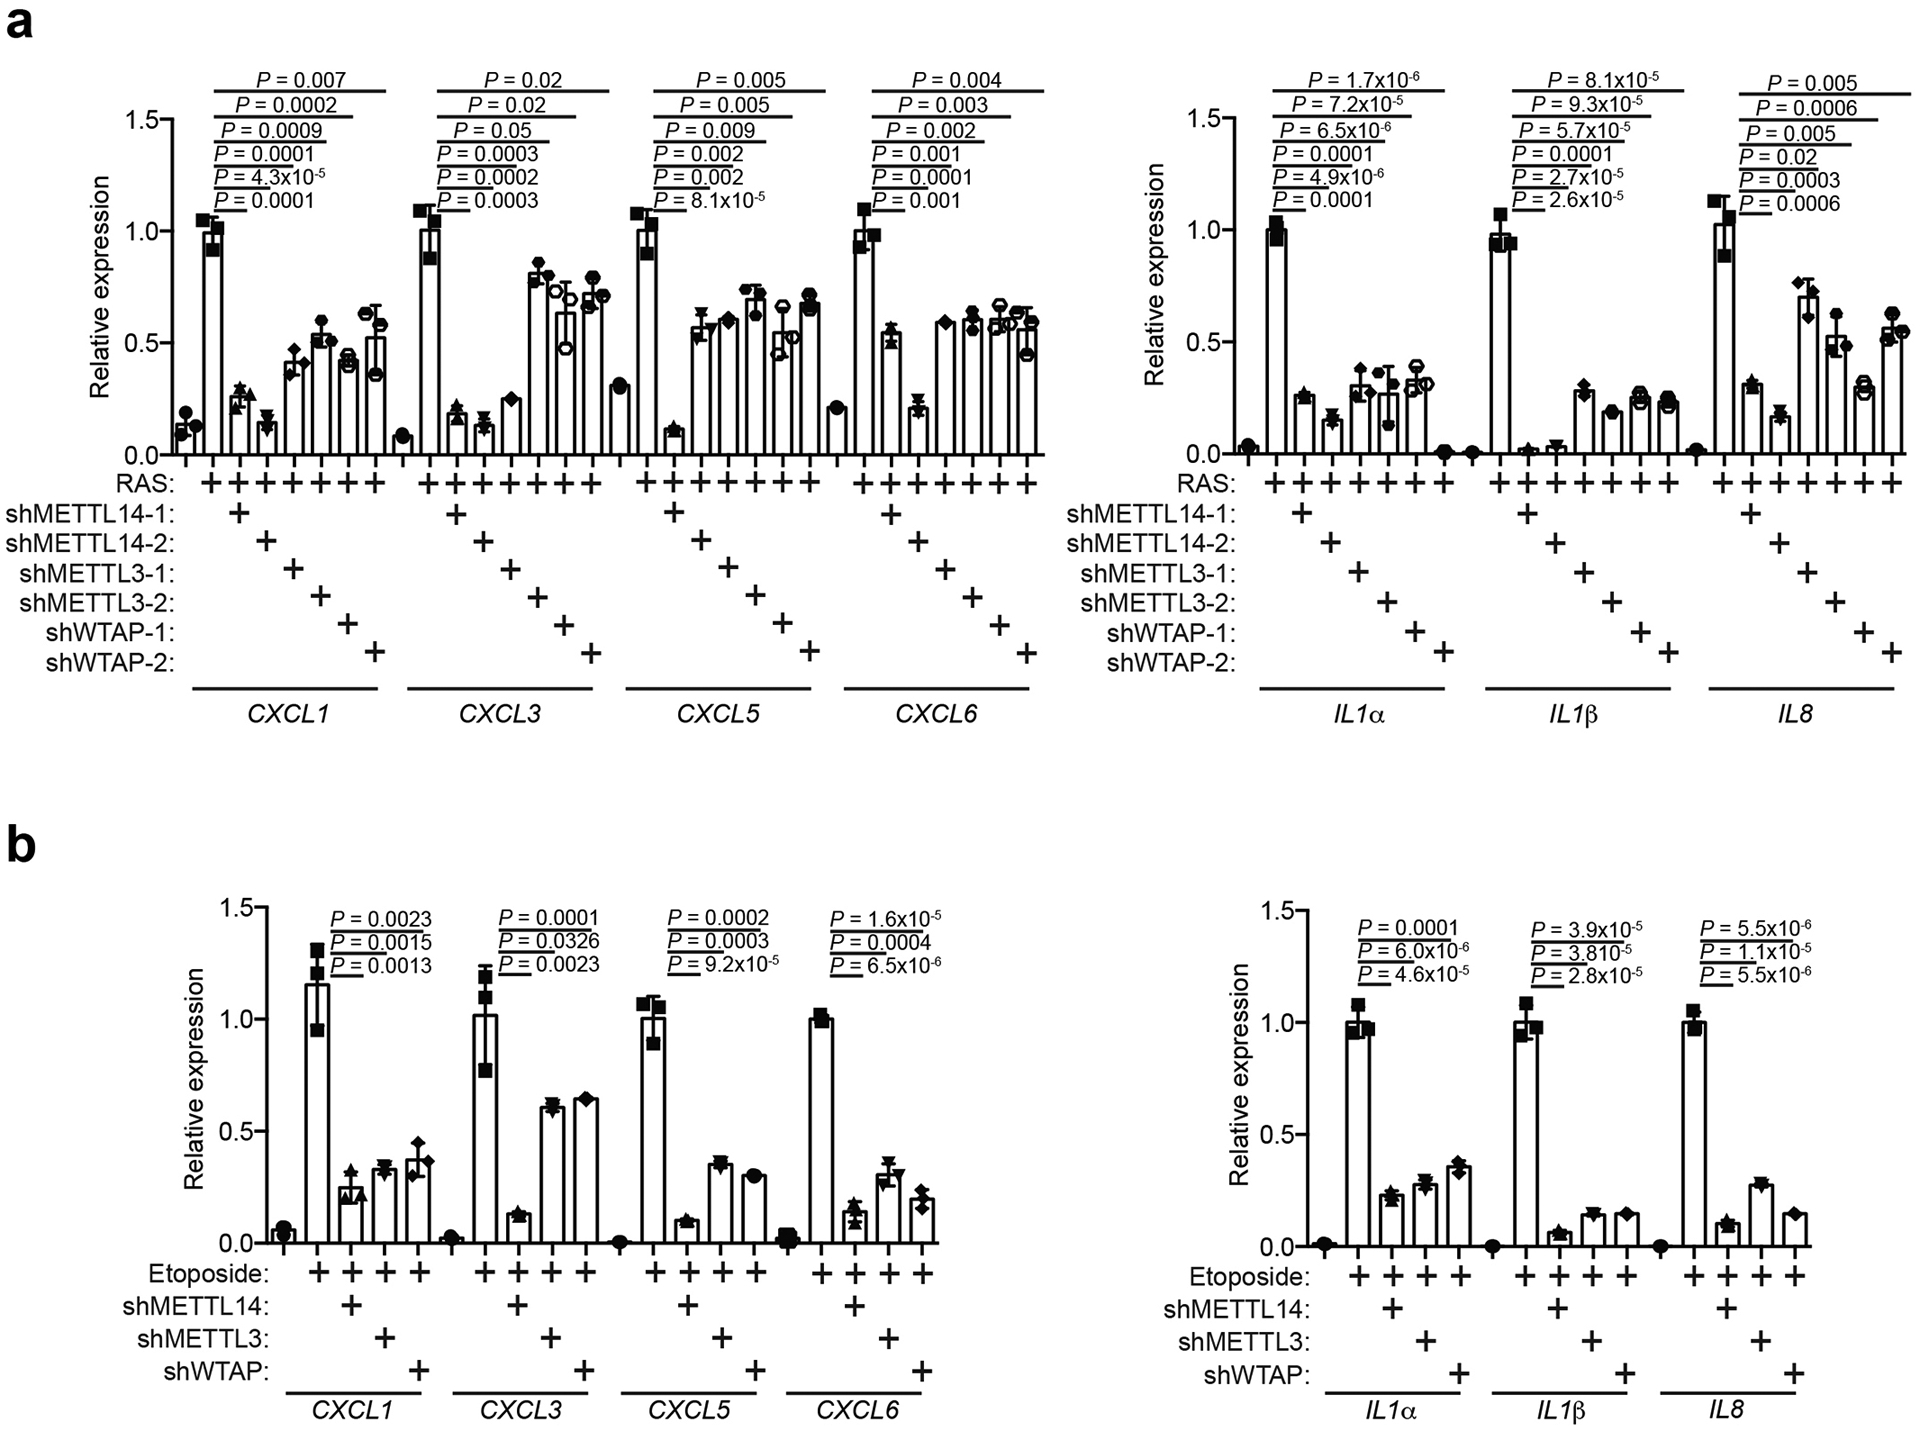
a-b, IMR90 cells were induced to senesce by oncogenic RAS (a) or Etoposide (b) with or without the expression of the indicated shRNAs and analyzed for expression of the indicated SASP genes by qRT-PCR. Data represent mean ± s.d. of three biologically independent experiments. P values were calculated using a two-tailed t-test. Numerical source data for 2a and 2b are provided.
Extended Data Fig. 3. MTC regulates SASP in an enzymatic activity independent manner.
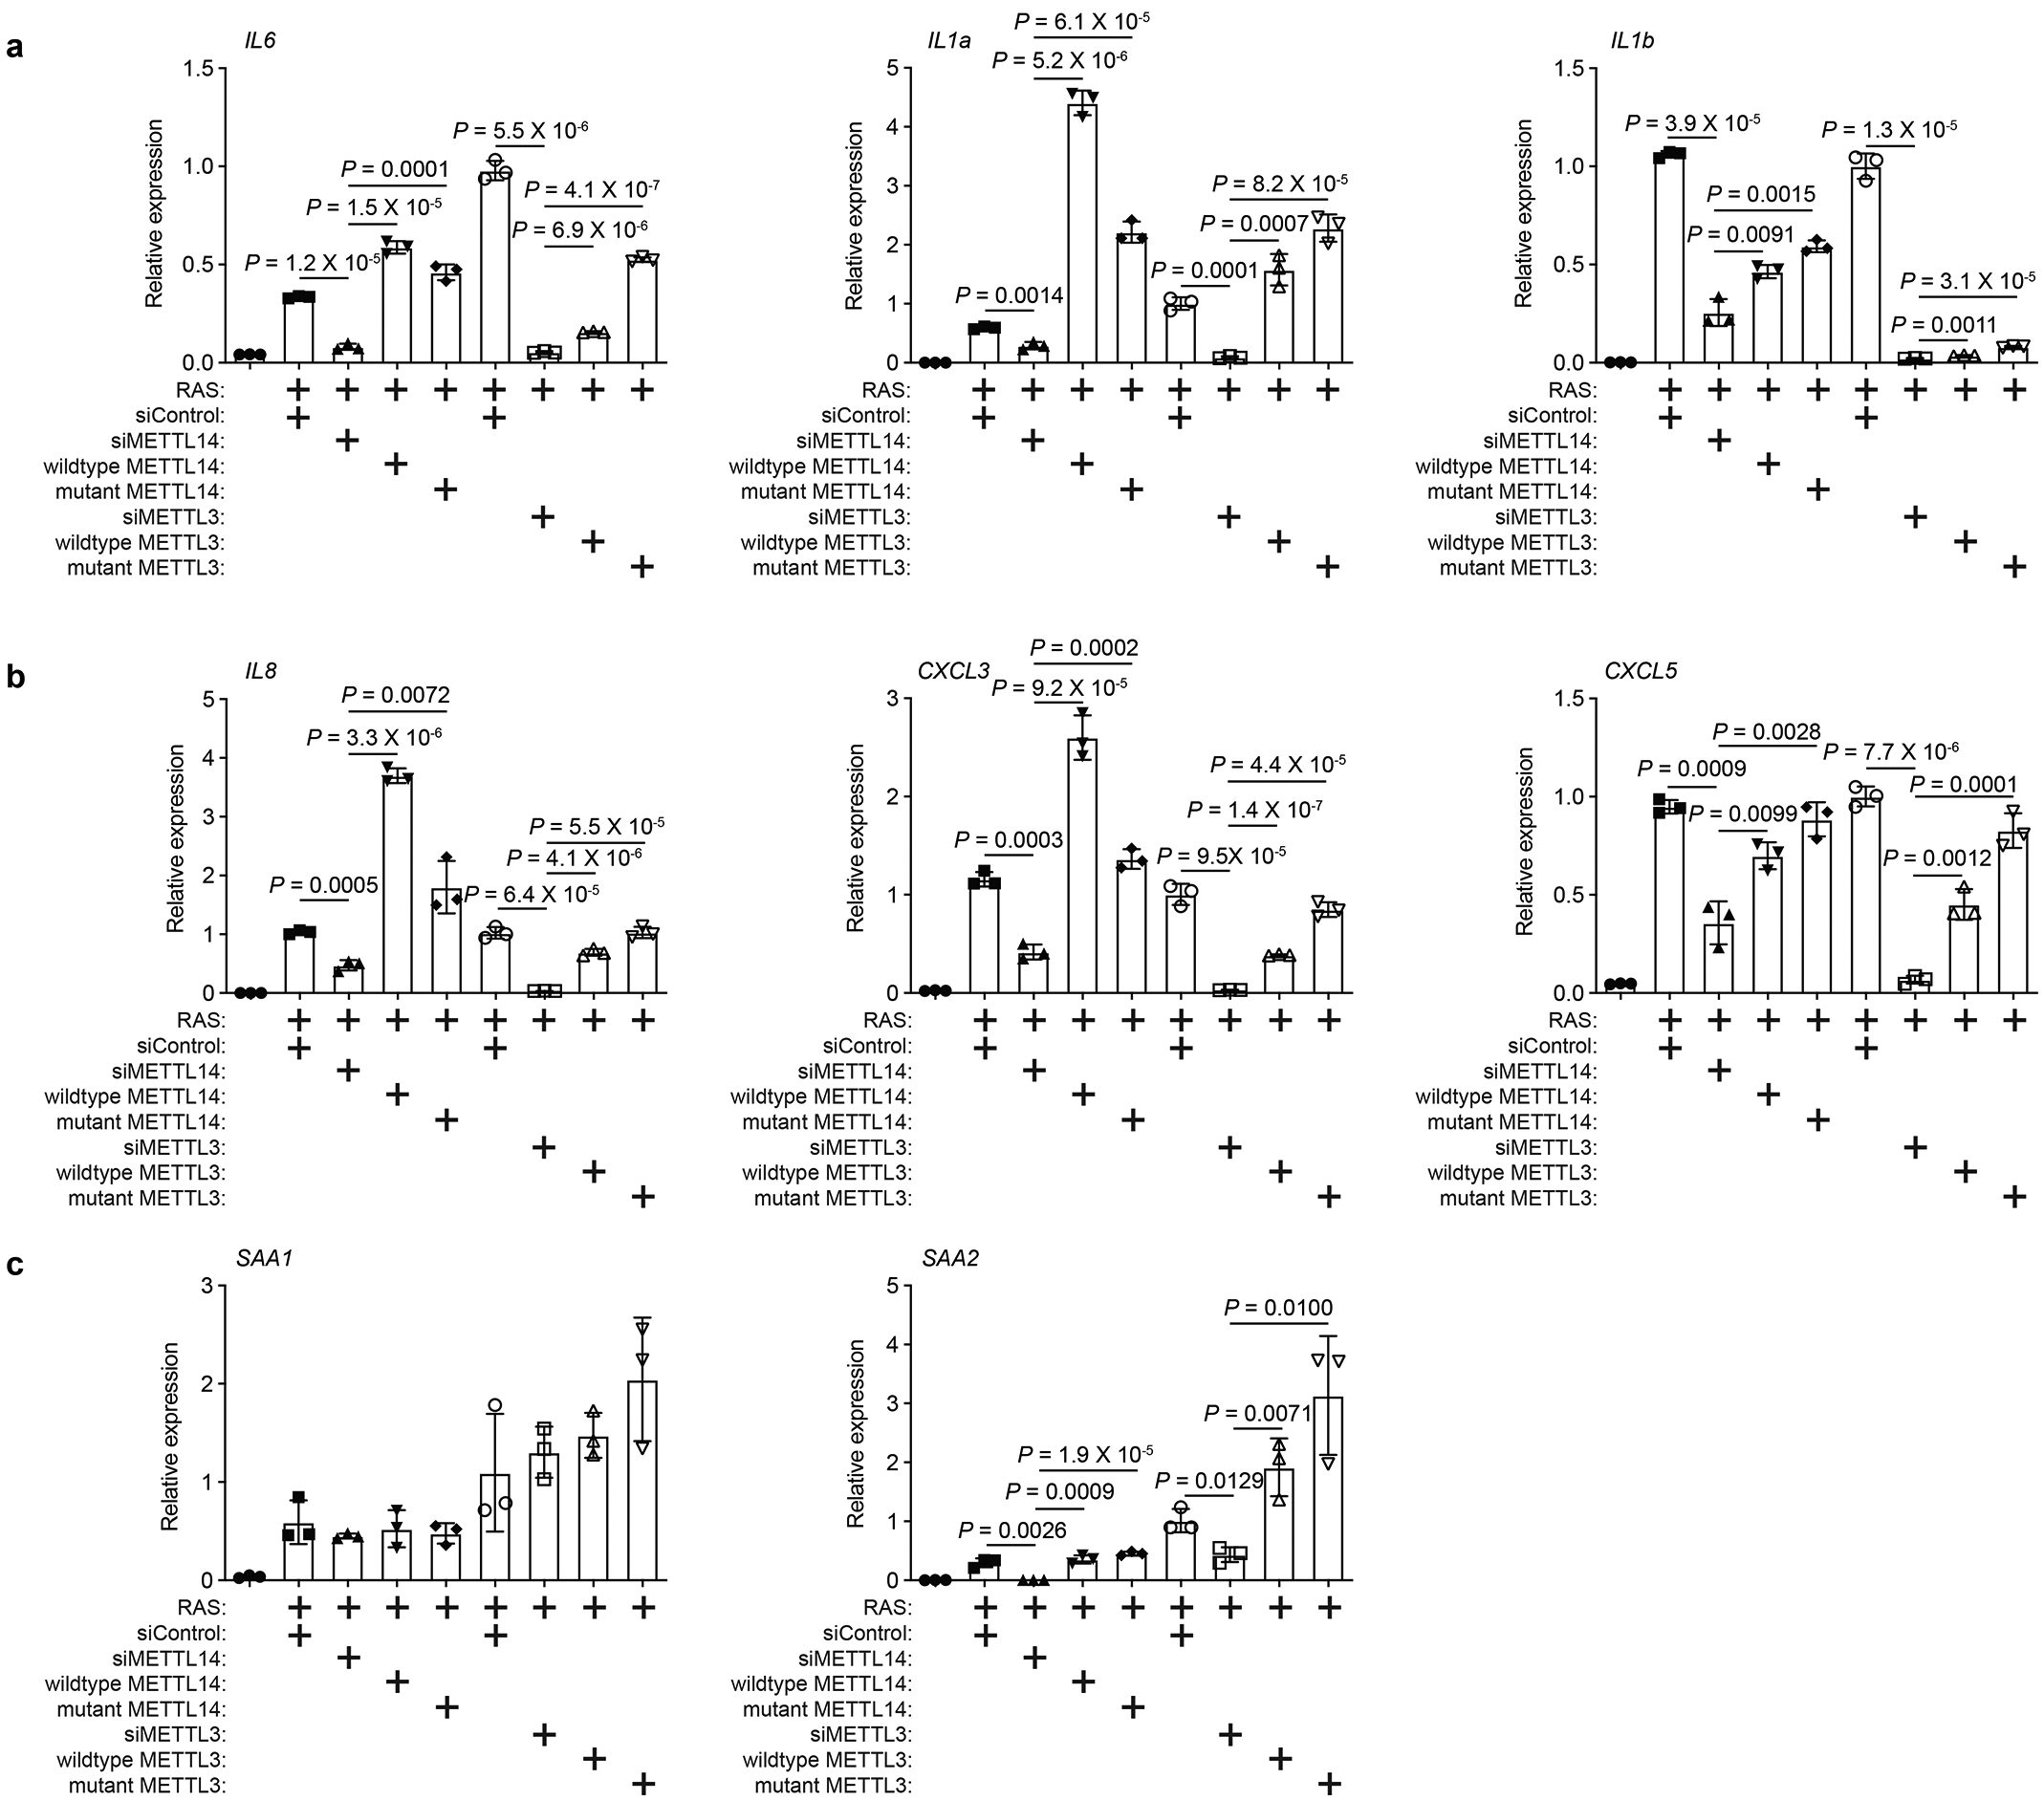
a-c, Control and RAS-induced senescent cells with or without knockdown of endogenous METTL3 and METTL14 were rescued by the indicated wildtype or mutant METTL3 or METTL14. Expression of IL6, IL1α, and IL1β (a); IL8, CXCL3 and CXCL5 (b); and SAA1 and SAA2 (c) was determined by RT-qPCR analysis. Data represent mean ± s.d. of three biologically independent experiments. P values were calculated using a two-tailed t-test. Numerical source data for 3a, 3b and 3c are provided.
Extended Data Fig. 4. Inhibition of MTC does not affect senescence-associated growth arrest.
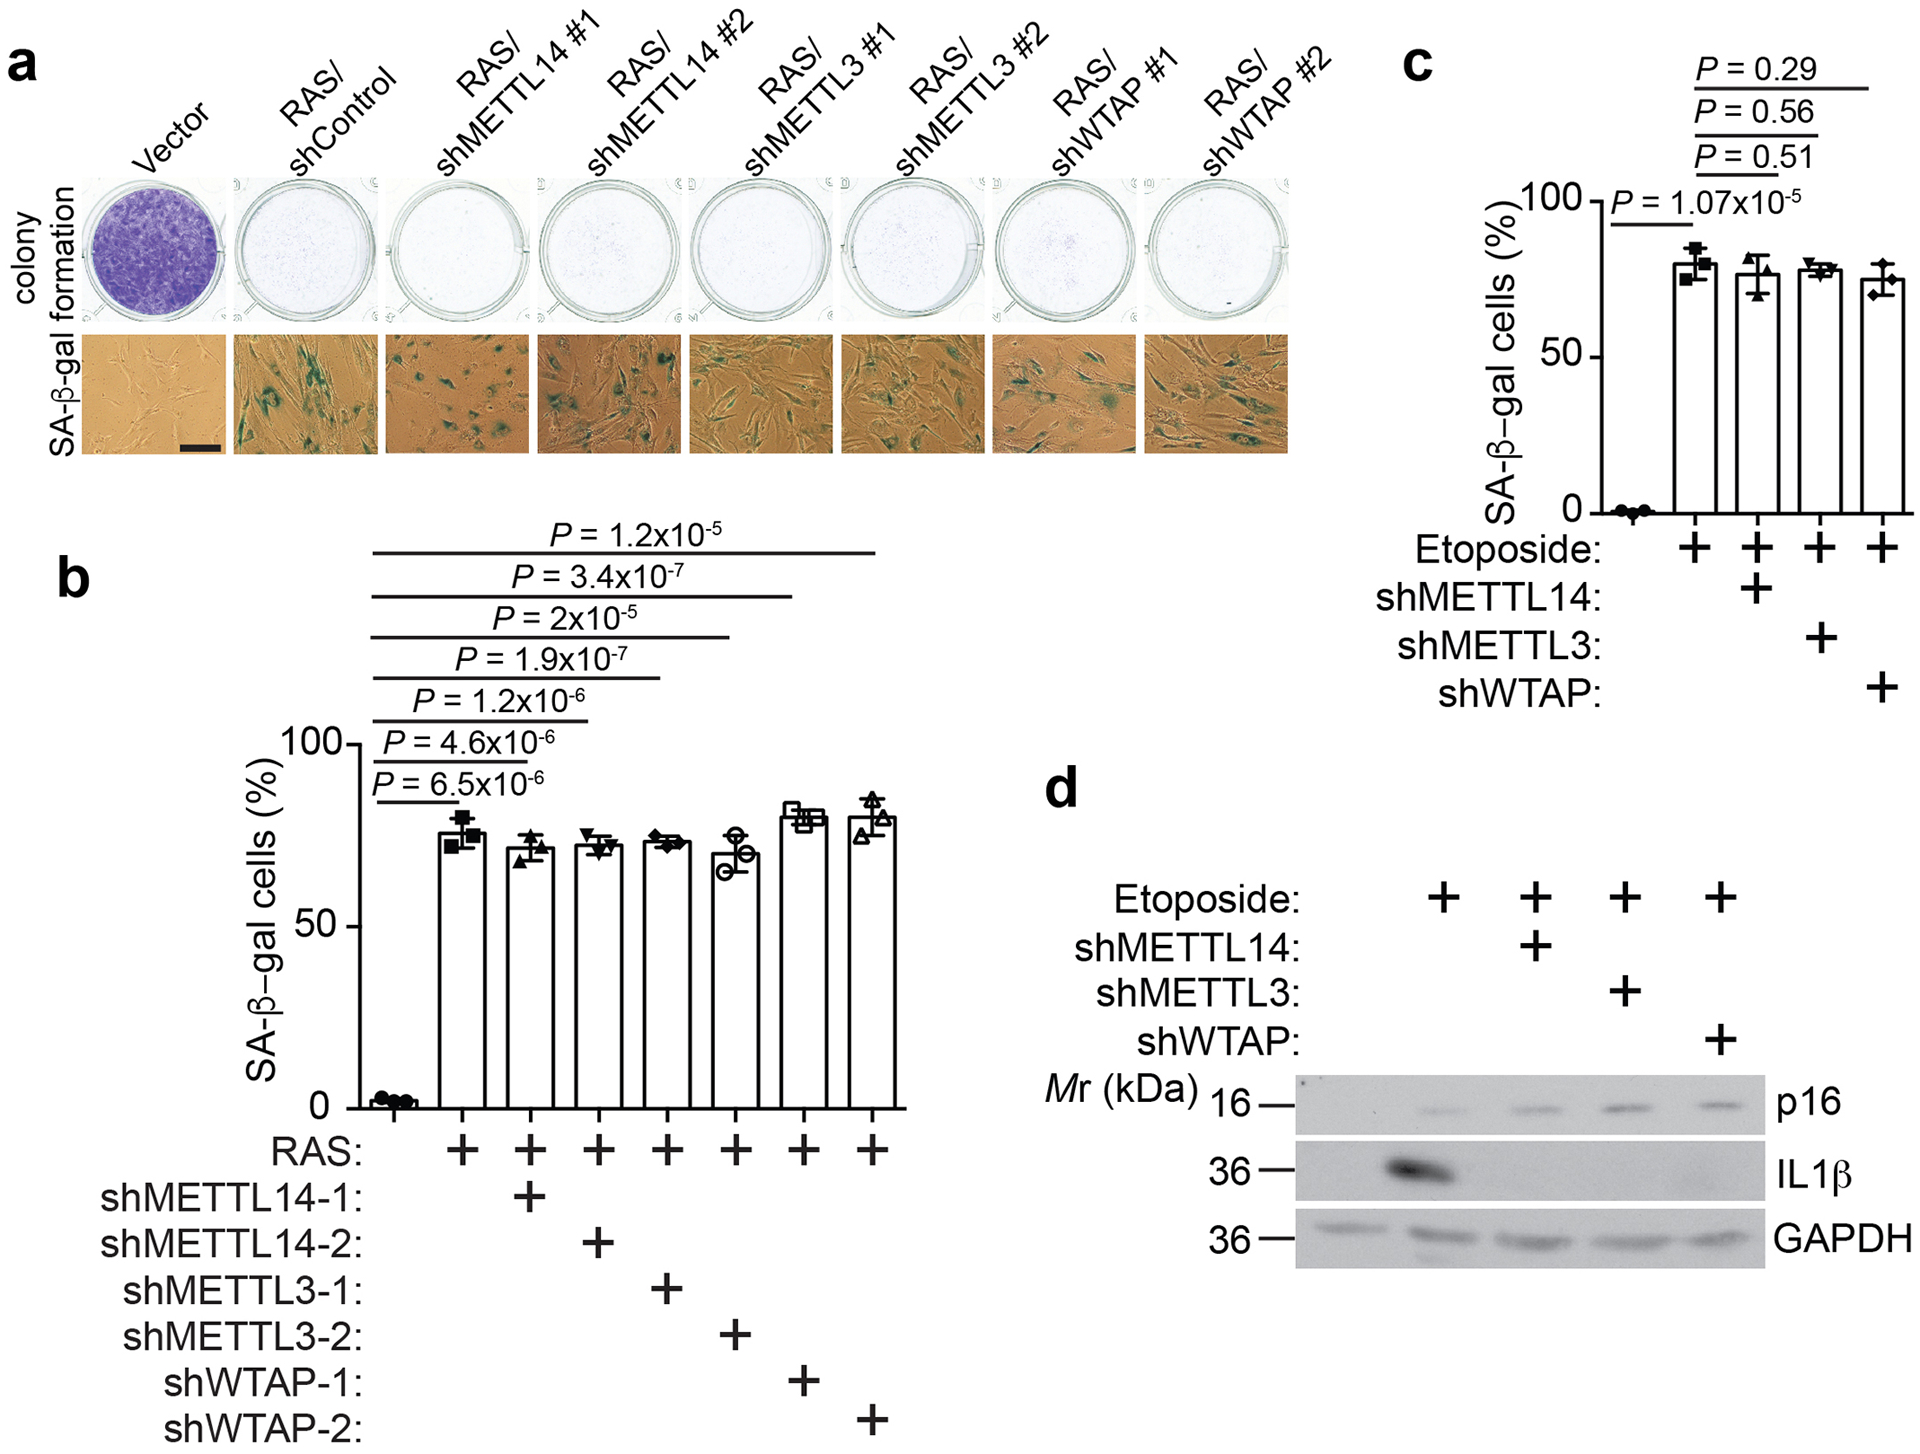
a-b, IMR90 cells were induced to senesce by RAS with or without the expression of the indicated shRNAs. The indicated cells were examined for senescence-associated growth arrest by colony formation and stained for SA-β-gal activity (a). SA-β-gal positive cells were quantified in the indicated treatment groups (b). c-d, IMR90 cells were induced to undergo senescence by etoposide with or without expression of the indicated shRNAs. SA-β-gal positive cells were quantified (c) and expression of p16, a marker of senescence, was determined by immunoblot (d). Data represent mean ± s.d. of three biologically independent experiments. P values were calculated using a two-tailed t-test. Uncropped blots for 4d and numerical source data for 4b and 4c are provided.
Extended Data Fig. 5. METTL3 and METTL14 promote SASP.
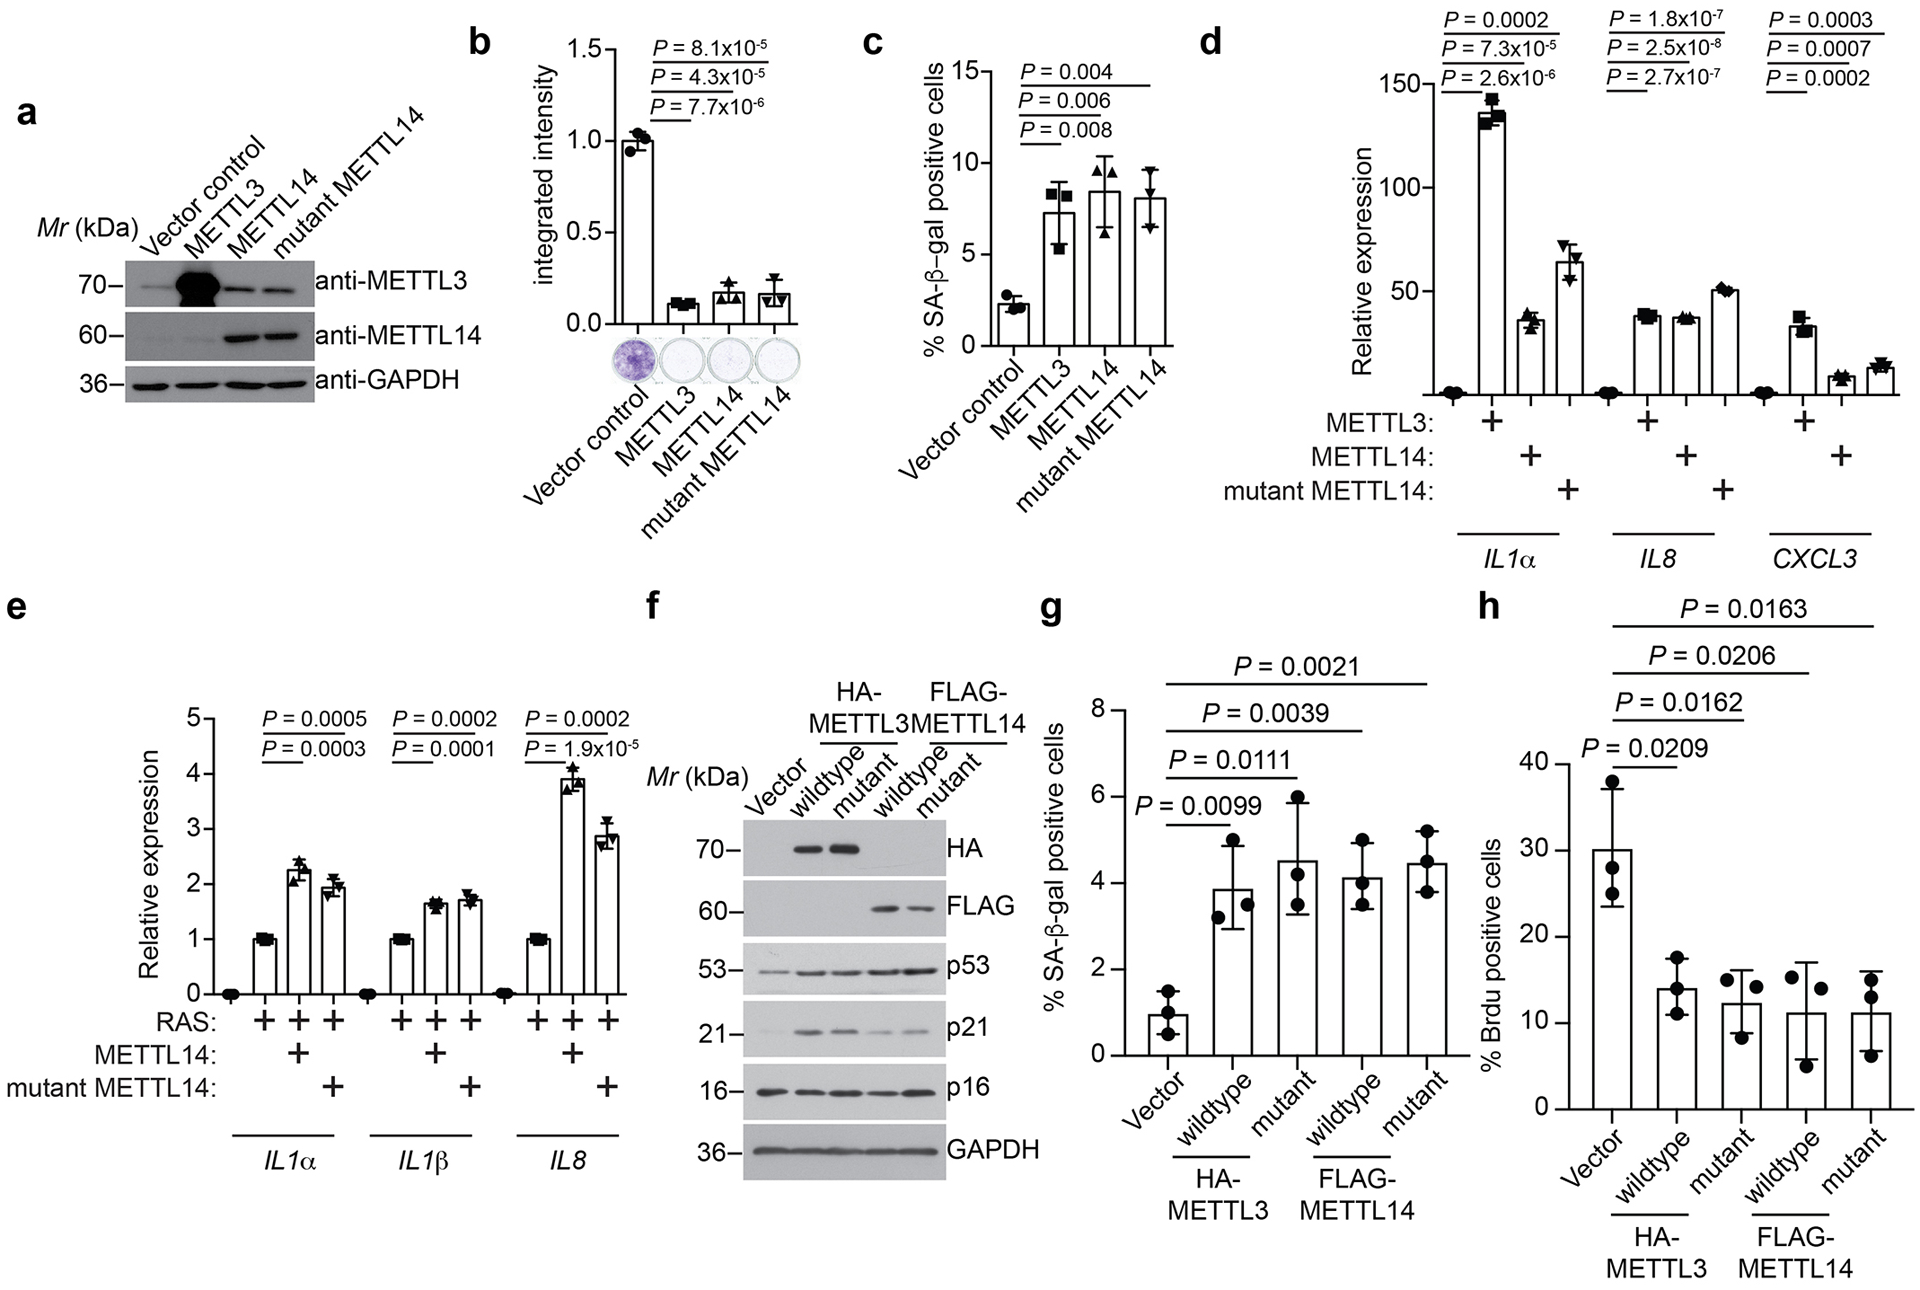
a-d, IMR90 cells ectopically expressing METTL3, wildtype or a R298P mutant METTL14 were subjected to analysis for expression of the indicated proteins by immunoblots (a), colony formation assay (b), SA-β-gal staining (c) or expression of the indicated SASP genes by qRT-PCR (d). The experiment in 5a was repeated twice independently with similar results. e, IMR90 cells expressing oncogenic RAS with or without ectopically expressed wildtype or the R298P mutant METTL14 were subjected to qRT-PCR analysis for expression of the indicated SASP genes. f, IMR90 cells with or without expressing the indicated wildtype or mutant METTL3 or METTL14 were harvested at day 6 post infection and analyzed for expression of the indicated proteins by immunoblot. The experiment was repeated twice independently with similar results. g-h, Conditioned medium collected from senescent cells with the indicated inducers were used to culture proliferating cells for 5 days. Changes in SA-β-gal (g) and BrdU incorporation (h) were examined. Data represent mean ± s.d. of three biologically independent experiments. P values were calculated using a two-tailed t-test. Uncropped blots for 5a and 5f and numerical source data for 5b, 5c, 5d, 5e, 5g and 5h are provided.
Extended Data Fig. 6. Kinetics of SASP gene expression.
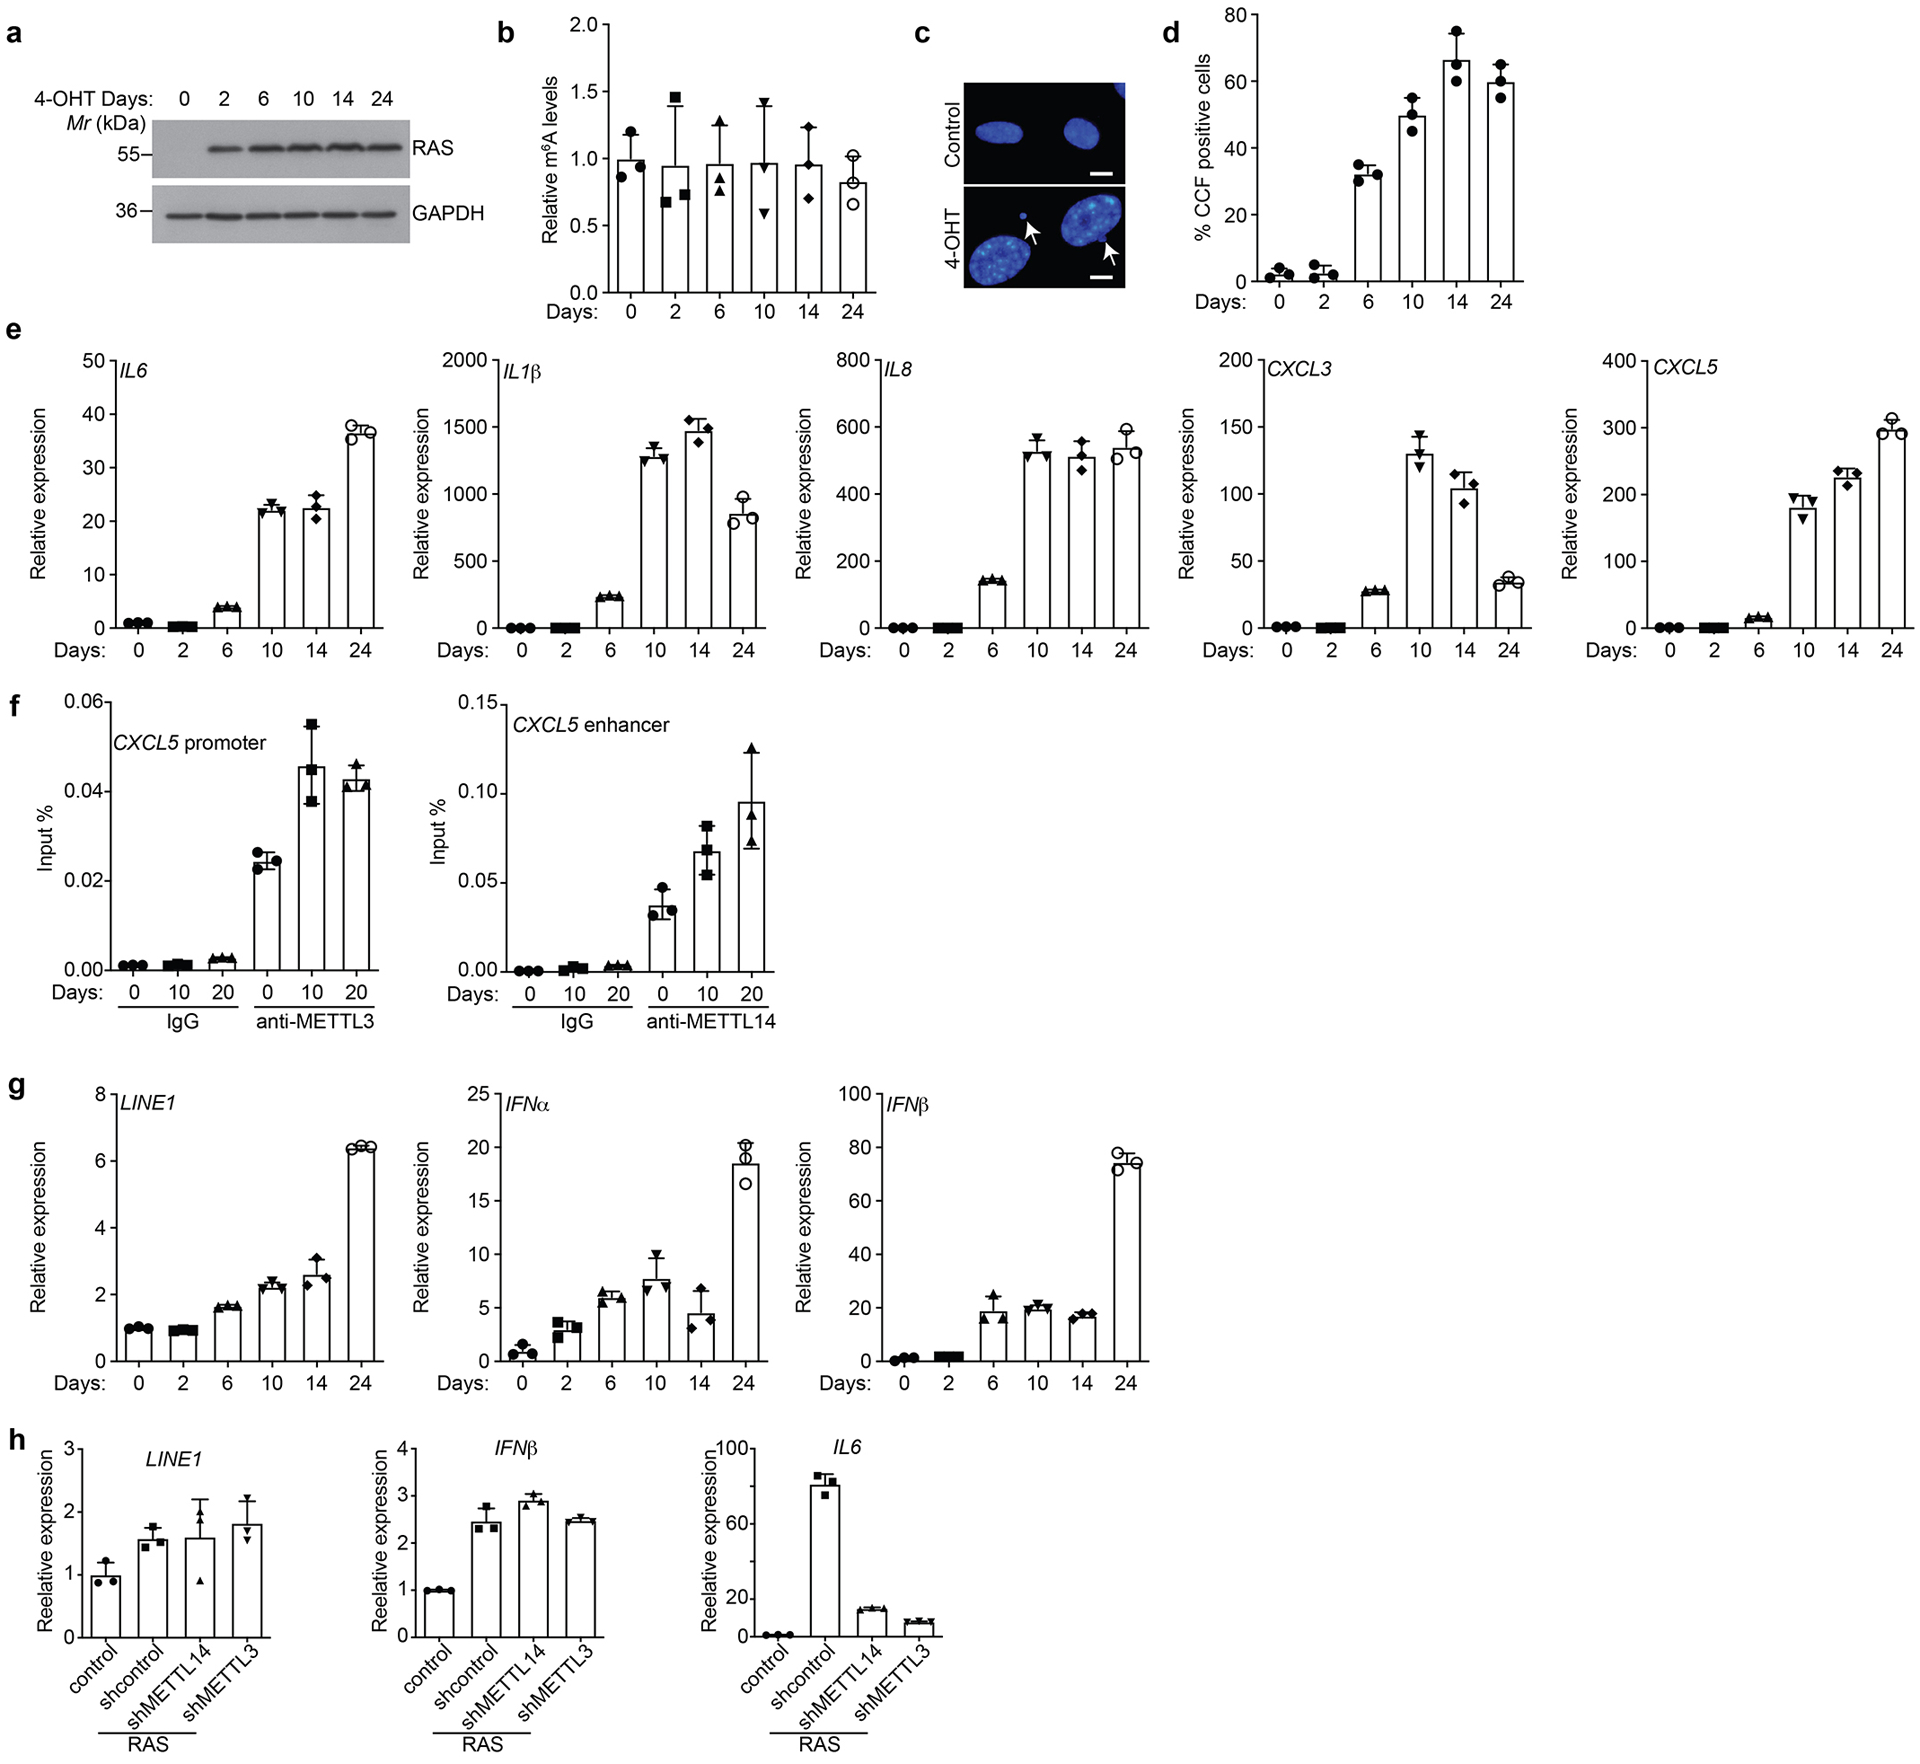
a-g, ER:RAS-expressing IMR90 cells were treated with 100 nM 4-OHT to induce RAS expression and analyzed for RAS expression by immunoblot (a), quantified for m6A levels from total RNAs (b), CCF formation (c) and quantification (d), expression of the indicated SASP genes (e), association of METTL3 and METTL14 with CXCL5 promoter and enhancer (f), or LINE1 and its regulated IFNα and IFNβ (g) by qRT-PCR analysis at the indicated time points. h, Expression of LINE1 and its regulated IFN β was determined by qRT-PCR in control and senescent cells without or with knockdown of METTL3 or METTL14. IL6 mRNA expression was used as a positive control. Arrows point to examples of CCF formed in RAS-induced senescent cells. Scale bar = 5 μm. Data represent mean ± s.d. of three biologically independent experiments. P values were calculated using a two-tailed t-test. Uncropped blots for 6a and numerical source data for 6b, 6d, 6e, 6f, 6g, and 6h are provided.
Extended Data Fig. 7. SASP genes are not subjected to m6A modification.
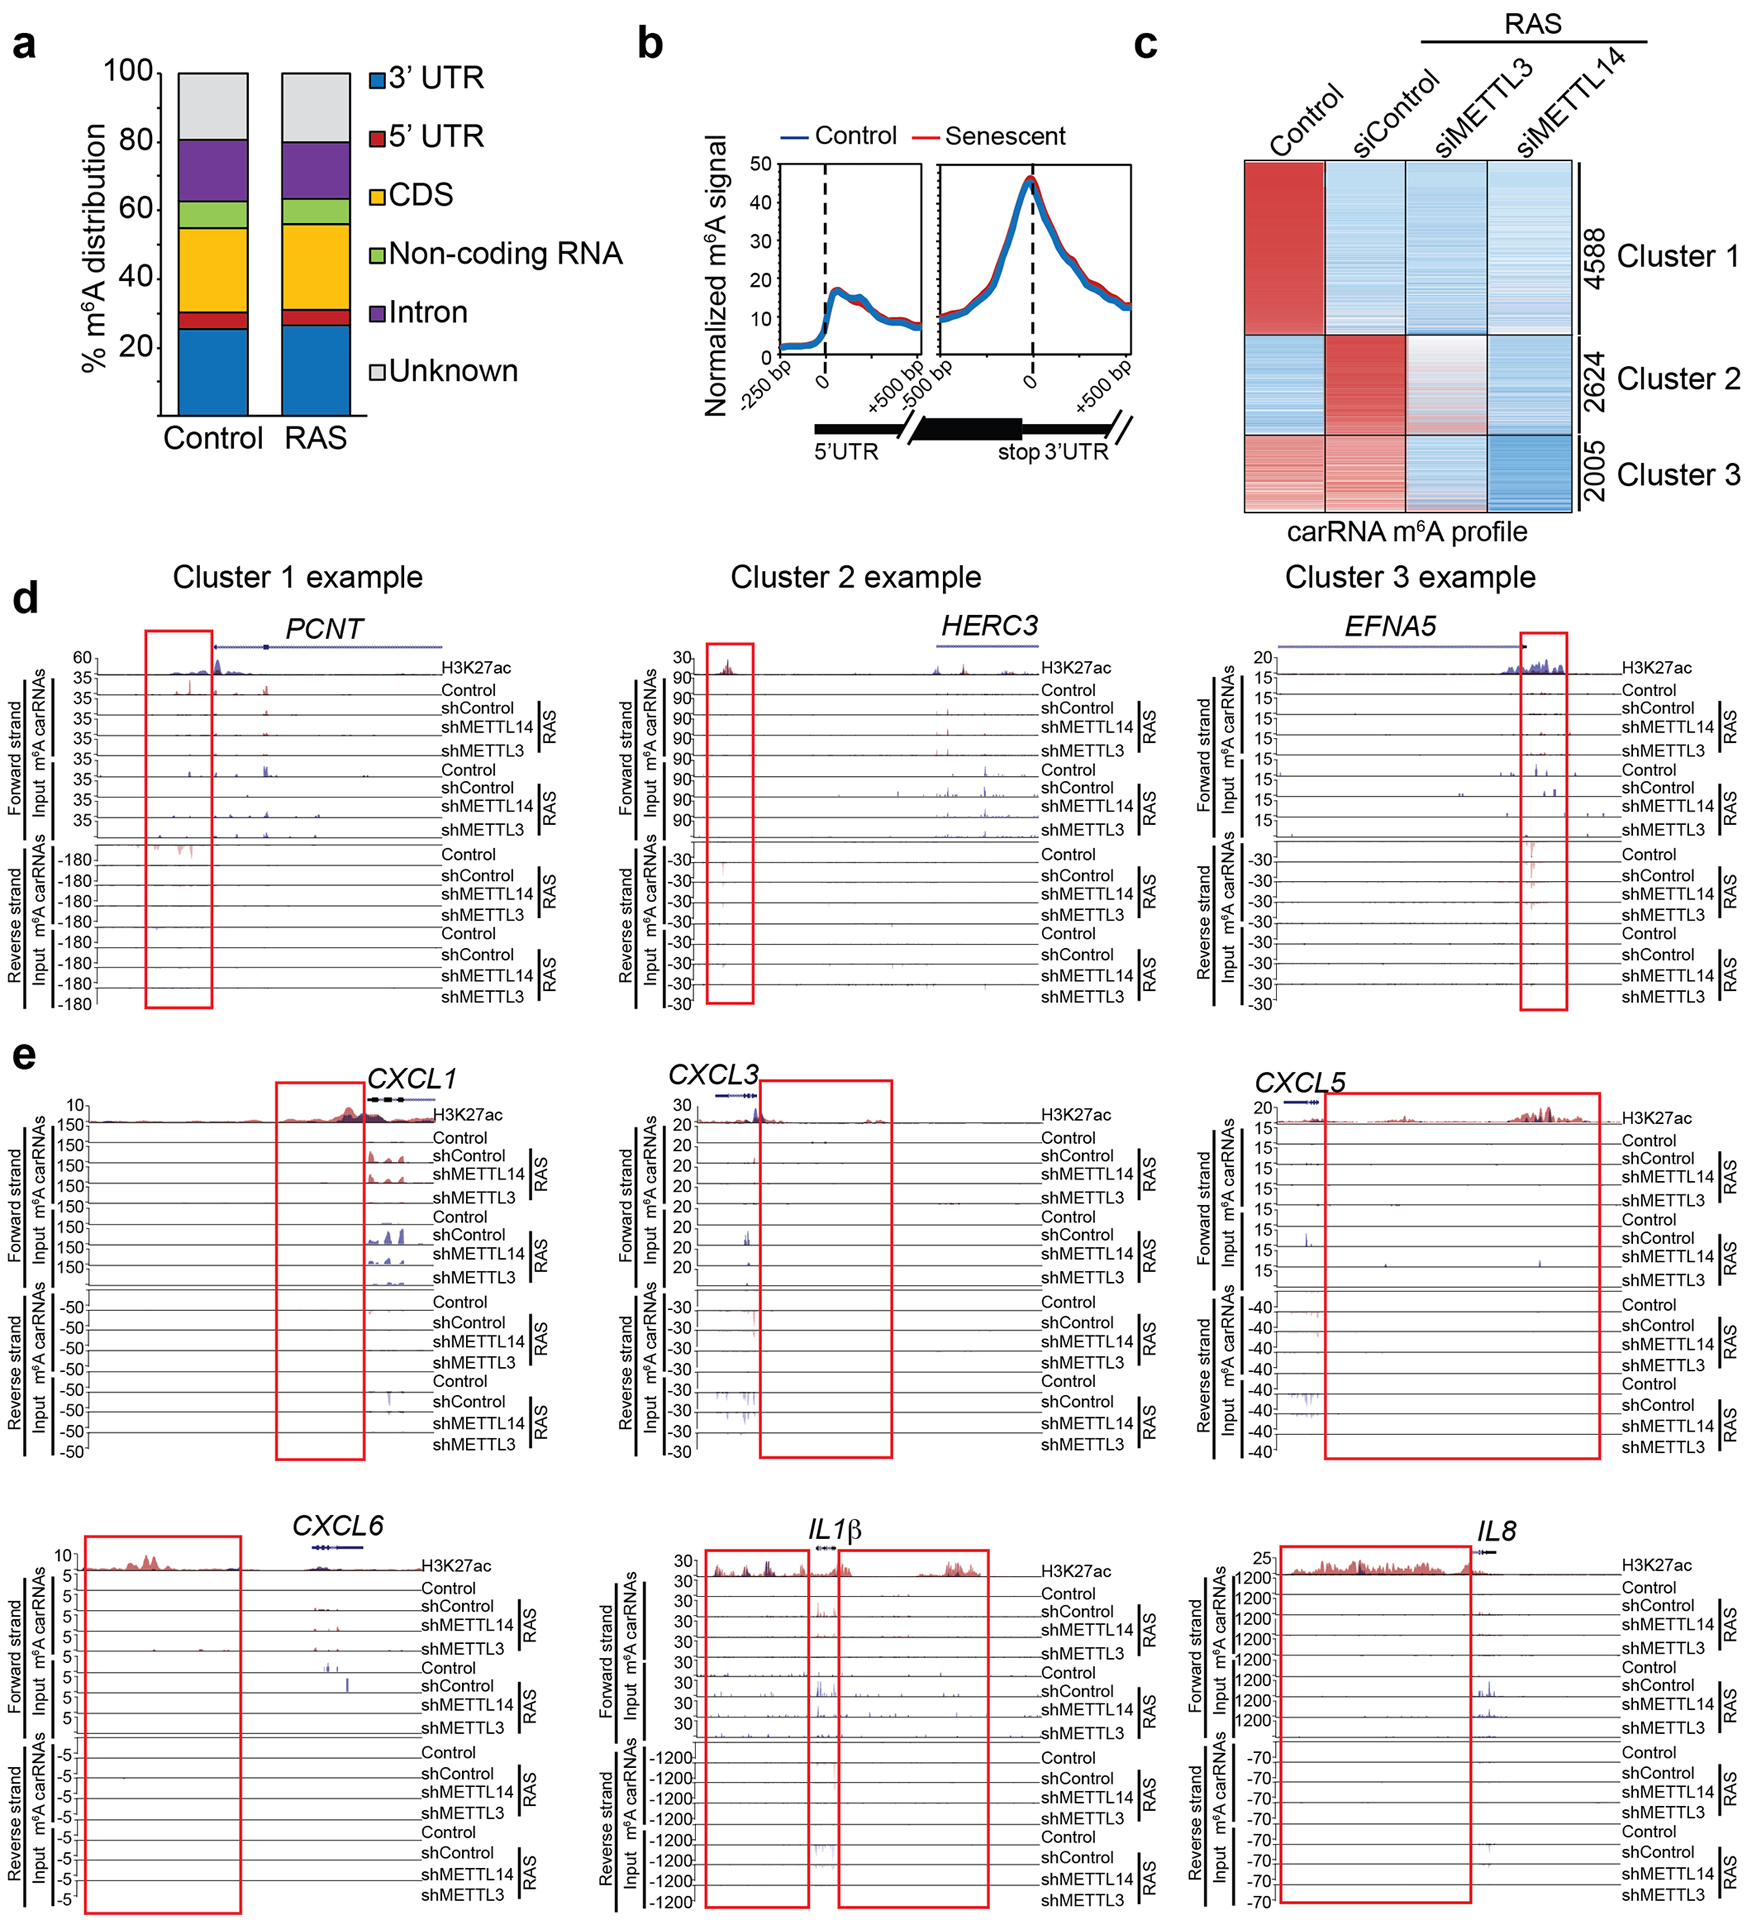
a, Distribution of m6A peaks across the indicated gene structure in control and RAS-induced senescent cells. b, Metagene m6A signal profile illustrating no global changes in m6A modifications around 5’ and 3’ end UTRs between control and RAS-induced senescent cells. c, Heatmap of changes in m6A modification on carRNAs in control and oncogenic RAS-induced senescent cells with or without knockdown of METTL3 or METTL14. d, Examples of m6A tracks at the boxed carRNAs that belong to each of the three indicated clusters with both forward and reverse strands indicated. H3K27ac modification levels in control (in blue) and senescent (in red) cells were used to identify the regulatory chromatin region (enhancer/promoter-associated RNAs). e, m6A tracks at the indicated SASP genes for both forward and reverse strands. Boxes indicated H3K27ac modification levels in control (red) and senescent (blue) cells used to identify the regulatory chromatin region. Please note that the changes in the gene body reflect changes in gene expression and specifically upregulation of SASP genes in senescent cells (and the associated increase in m6A modification was a reflection of an increase in input mRNA expression of these genes).
Extended Data Fig. 8. METTL3 redistribution to SASP gene promoters.
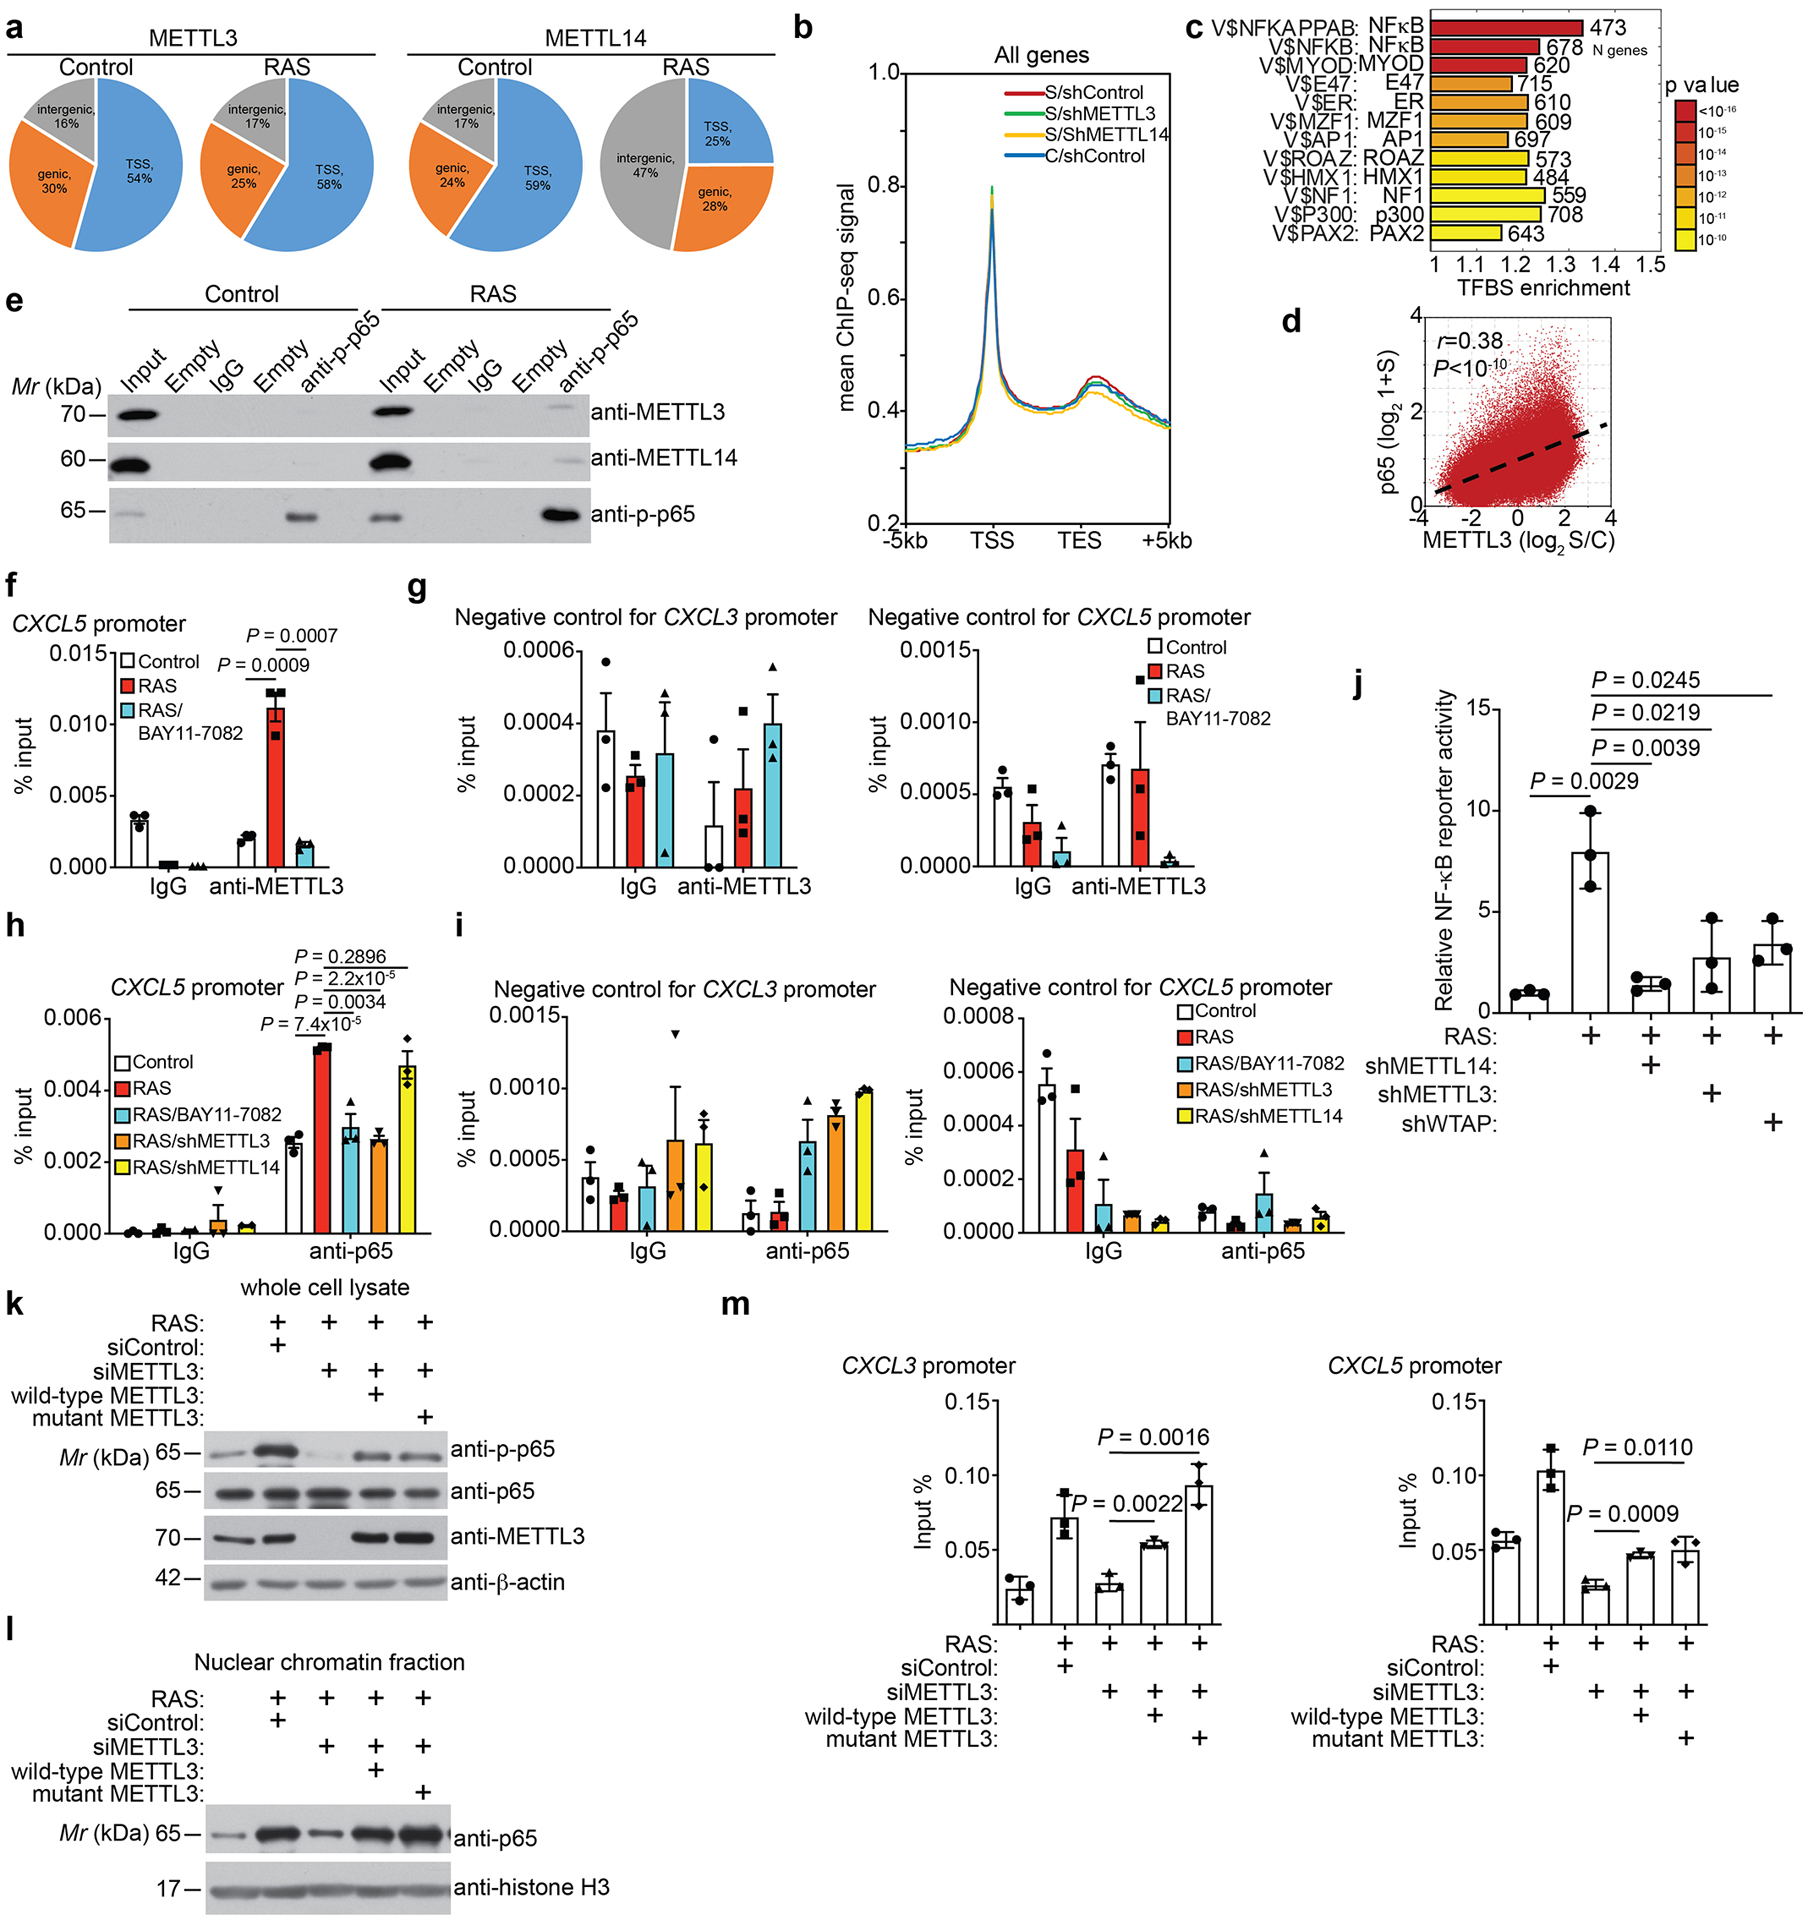
a, Distribution of METTL3 and METTL14 in the indicated genomic regions in control and RAS-induced senescent cells. b, Average binding signal from ChIP-seq analysis of RNA polymerase II occupancy on all genes in control and senescent cells without or with knockdown of METTL3 or METTL14. c, Transcription factor binding site enrichment analysis of increased cut-and-run peaks of METTL3 in senescent cells. d, Correlation between changes in binding signal of METTL3 (senescent vs. control) and NF-κB p65 binding signal in senescent cells. e, Co-immunoprecipitation analysis between NF-κB p65 subunit and METTL3 or METTL14 in the indicated cells. The experiment was repeated three times independently with similar results. f-g, ChIP–qPCR analysis of association of METTL3 on the CXCL5 promoter (f) or negative control regions of CXCL3 or CXCL5 gene promoters in the indicated cells (g). h-i, ChIP–qPCR analysis of association of NFκB p65 on the CXCL5 promoter (h) or negative control regions of CXCL3 or CXCL5 gene promoters in the indicated cells (i). j, NFκB reporter activity was determined in the indicated cells. k-m, The indicated ER:RAS IMR90 cells were induced by 4-OHT. Cells were harvested and analyzed for expression of the indicated proteins by immunoblot (k), nuclear chromatin fraction of p65 (l), or association of p65 with the promoters of the indicated SASP genes by ChIP-qPCR assay (m). Data represent mean ± s.d. except for 8j mean ± s.e.m. of three biologically independent experiments. P values were calculated using a two-tailed t-test and a two-tailed Spearman correlation analysis for 8d. Uncropped blots for 8e, 8k and 8l and numerical source data for 8f, 8g, 8h, 8i, 8j and 8m are provided.
Extended Data Fig. 9. METTL14 regulates SASP gene enhancers.
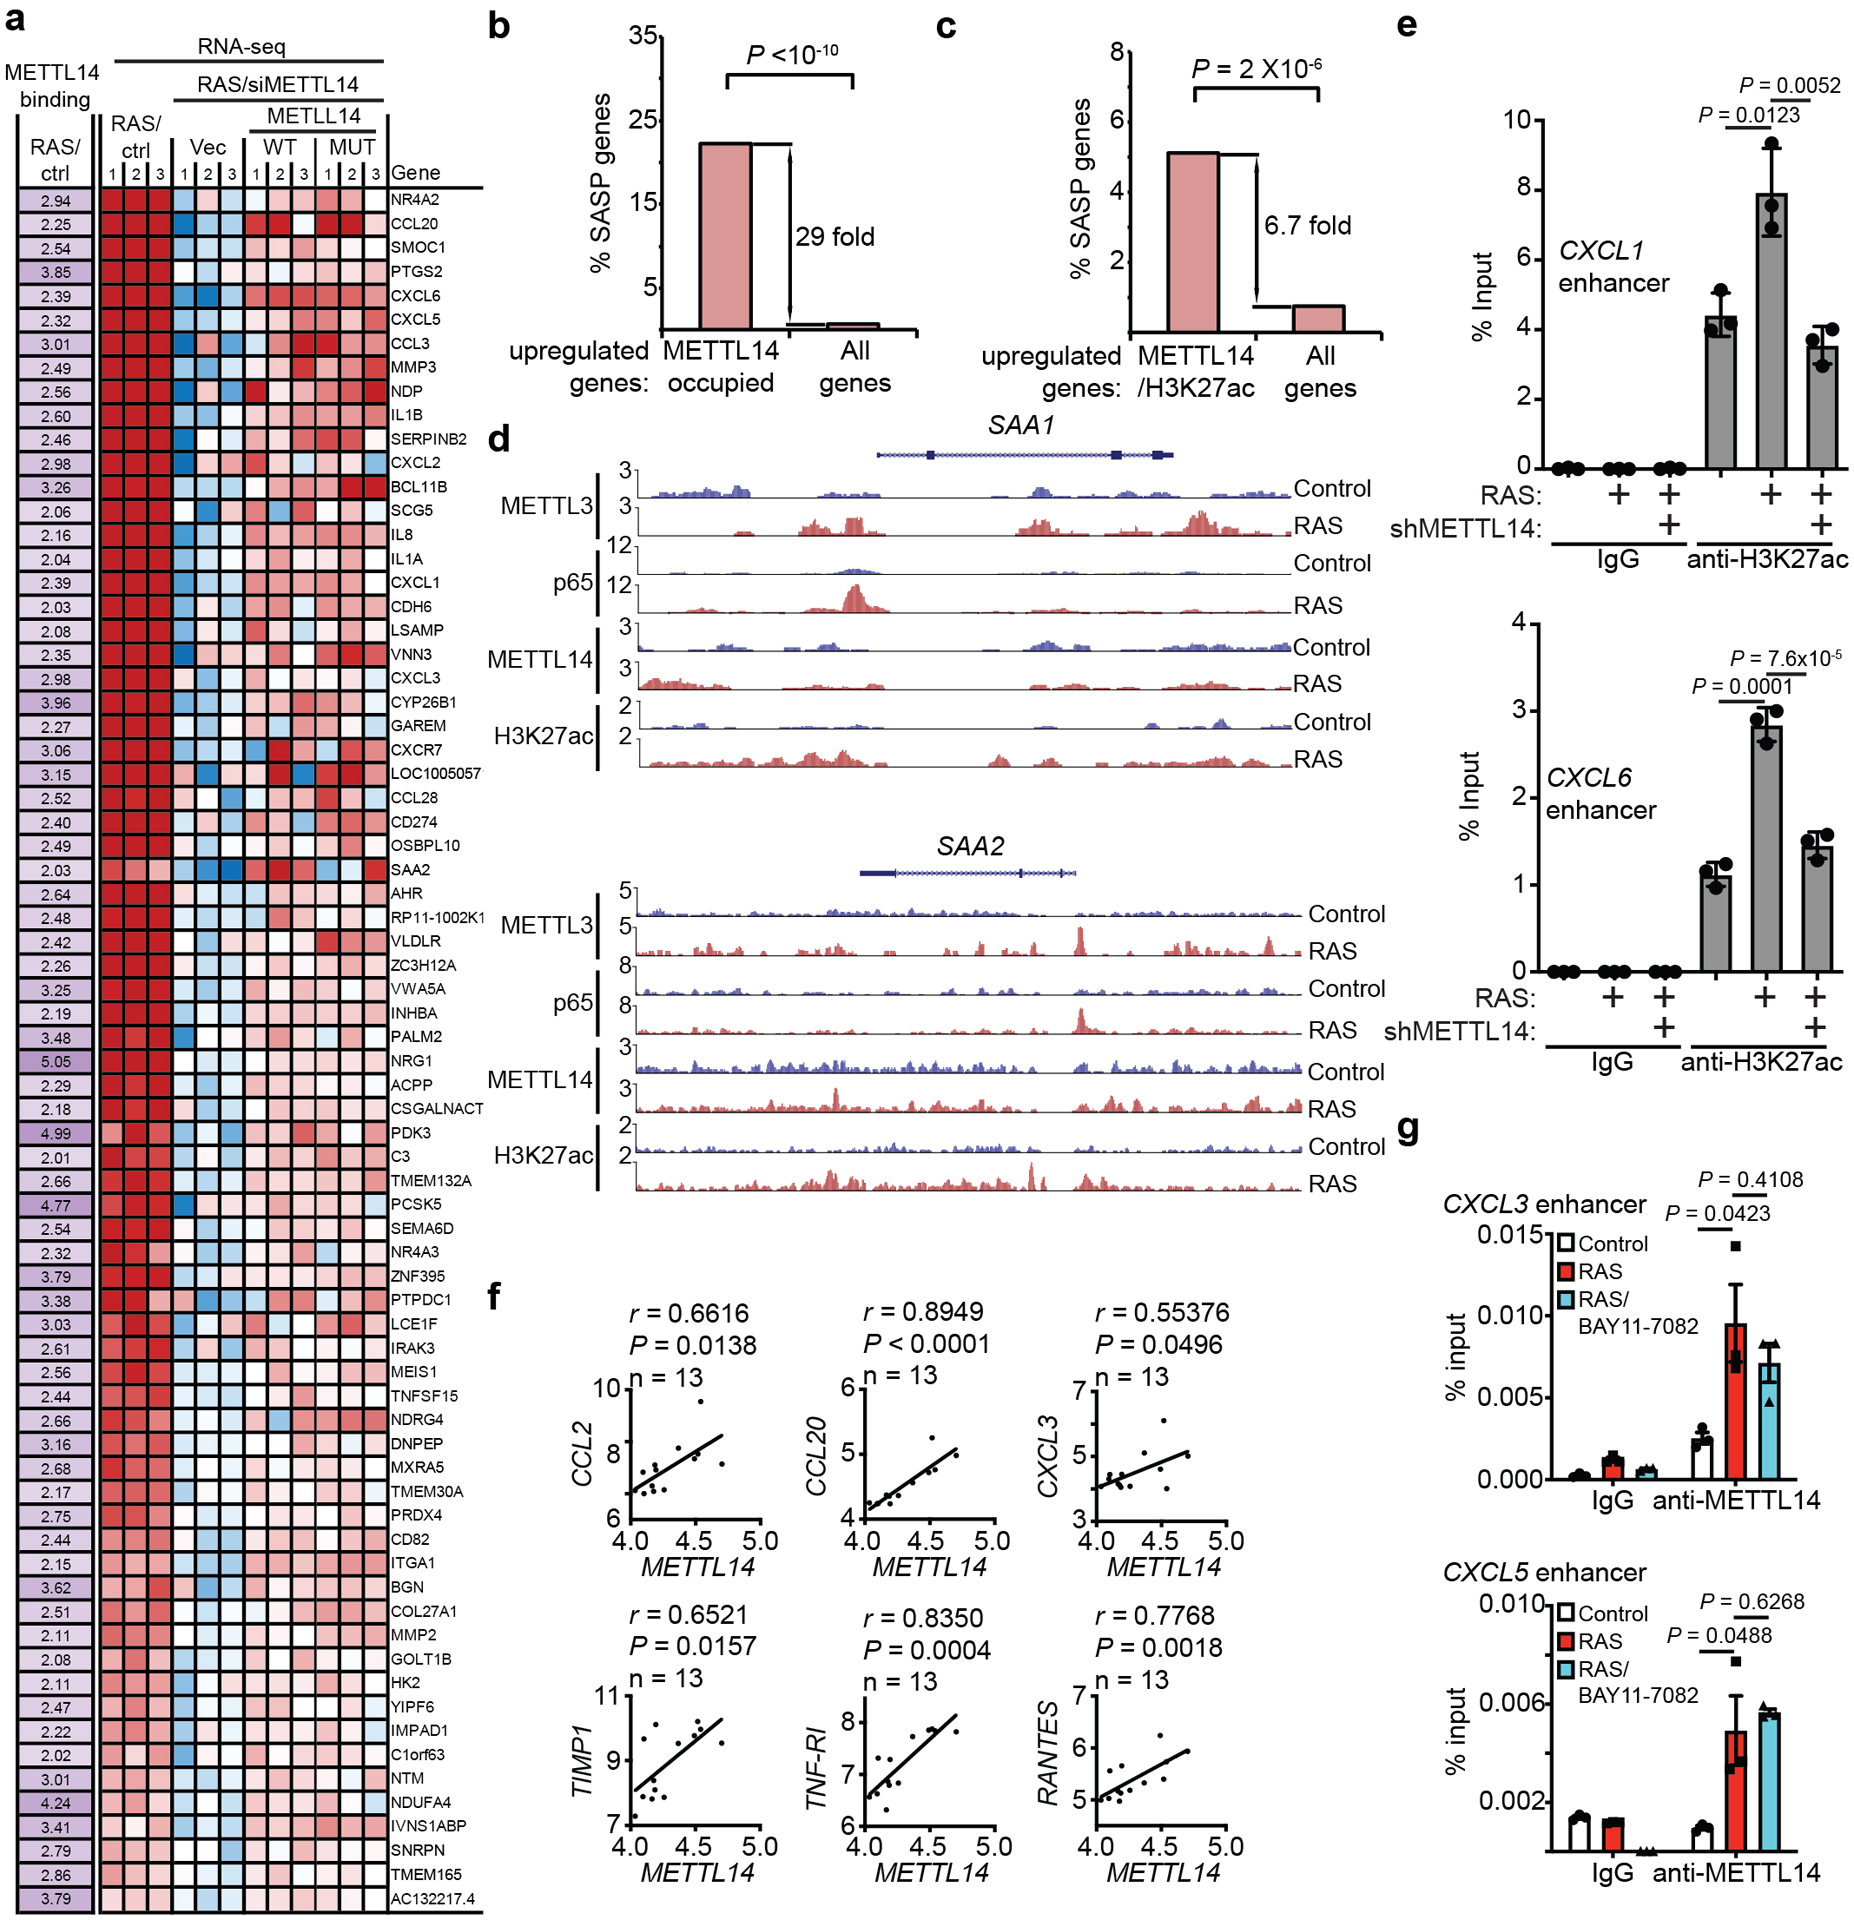
a, List of direct METTL14 target genes that are upregulated in senescent cells, downregulated by METTL14 knockdown and rescued by both wildtype and the R298P mutant METTL14 with increased binding of METTL14 (≥2 fold) in senescent cells. b, Enrichment of SASP genes among direct METTL14 target genes. c, Enrichment of SASP genes among genes with increased binding of co-localized METTL14 and H3K27ac in senescent cells compared with control cells (≥2 fold). d, Cut-and-run peaks of METTL3, NF-κB p65, METTL14 and H3K27ac on the SAA1 and SAA2 gene loci in control and RAS-induced senescent cells. e, ChIP-qPCR analysis of the association of H3K27ac with enhancers of the indicated SASP gene loci in control and senescent cells with or without METTL14 knockdown. f, Pearson correlation analysis of METTL14 with the indicated SASP genes in human laser captured and micro-dissected PanIN lesion samples based on the GSE43288 dataset. n = 13 biologically independent samples. P values were calculated using a Pearson correlation analysis. g, ChIP–qPCR analysis of the association of METTL14 with enhancers of the indicated SASP genes in control and senescent cells with or without IKK inhibitor Bay 11–7082 (5 μM) treatment for 48 hrs. Data represent mean ± s.d. in 9e and mean ± s.e.m. in 9g of three biologically independent experiments. P values were calculated using a two-tailed t-test except in 9b-c by a two-tailed Fisher exact test and a two-tailed Pearson correlation analysis in 9f. Numerical source data for 9e, 9f and 9g are provided.
Extended Data Fig. 10. MTC is required for immune surveillance function of the SASP.
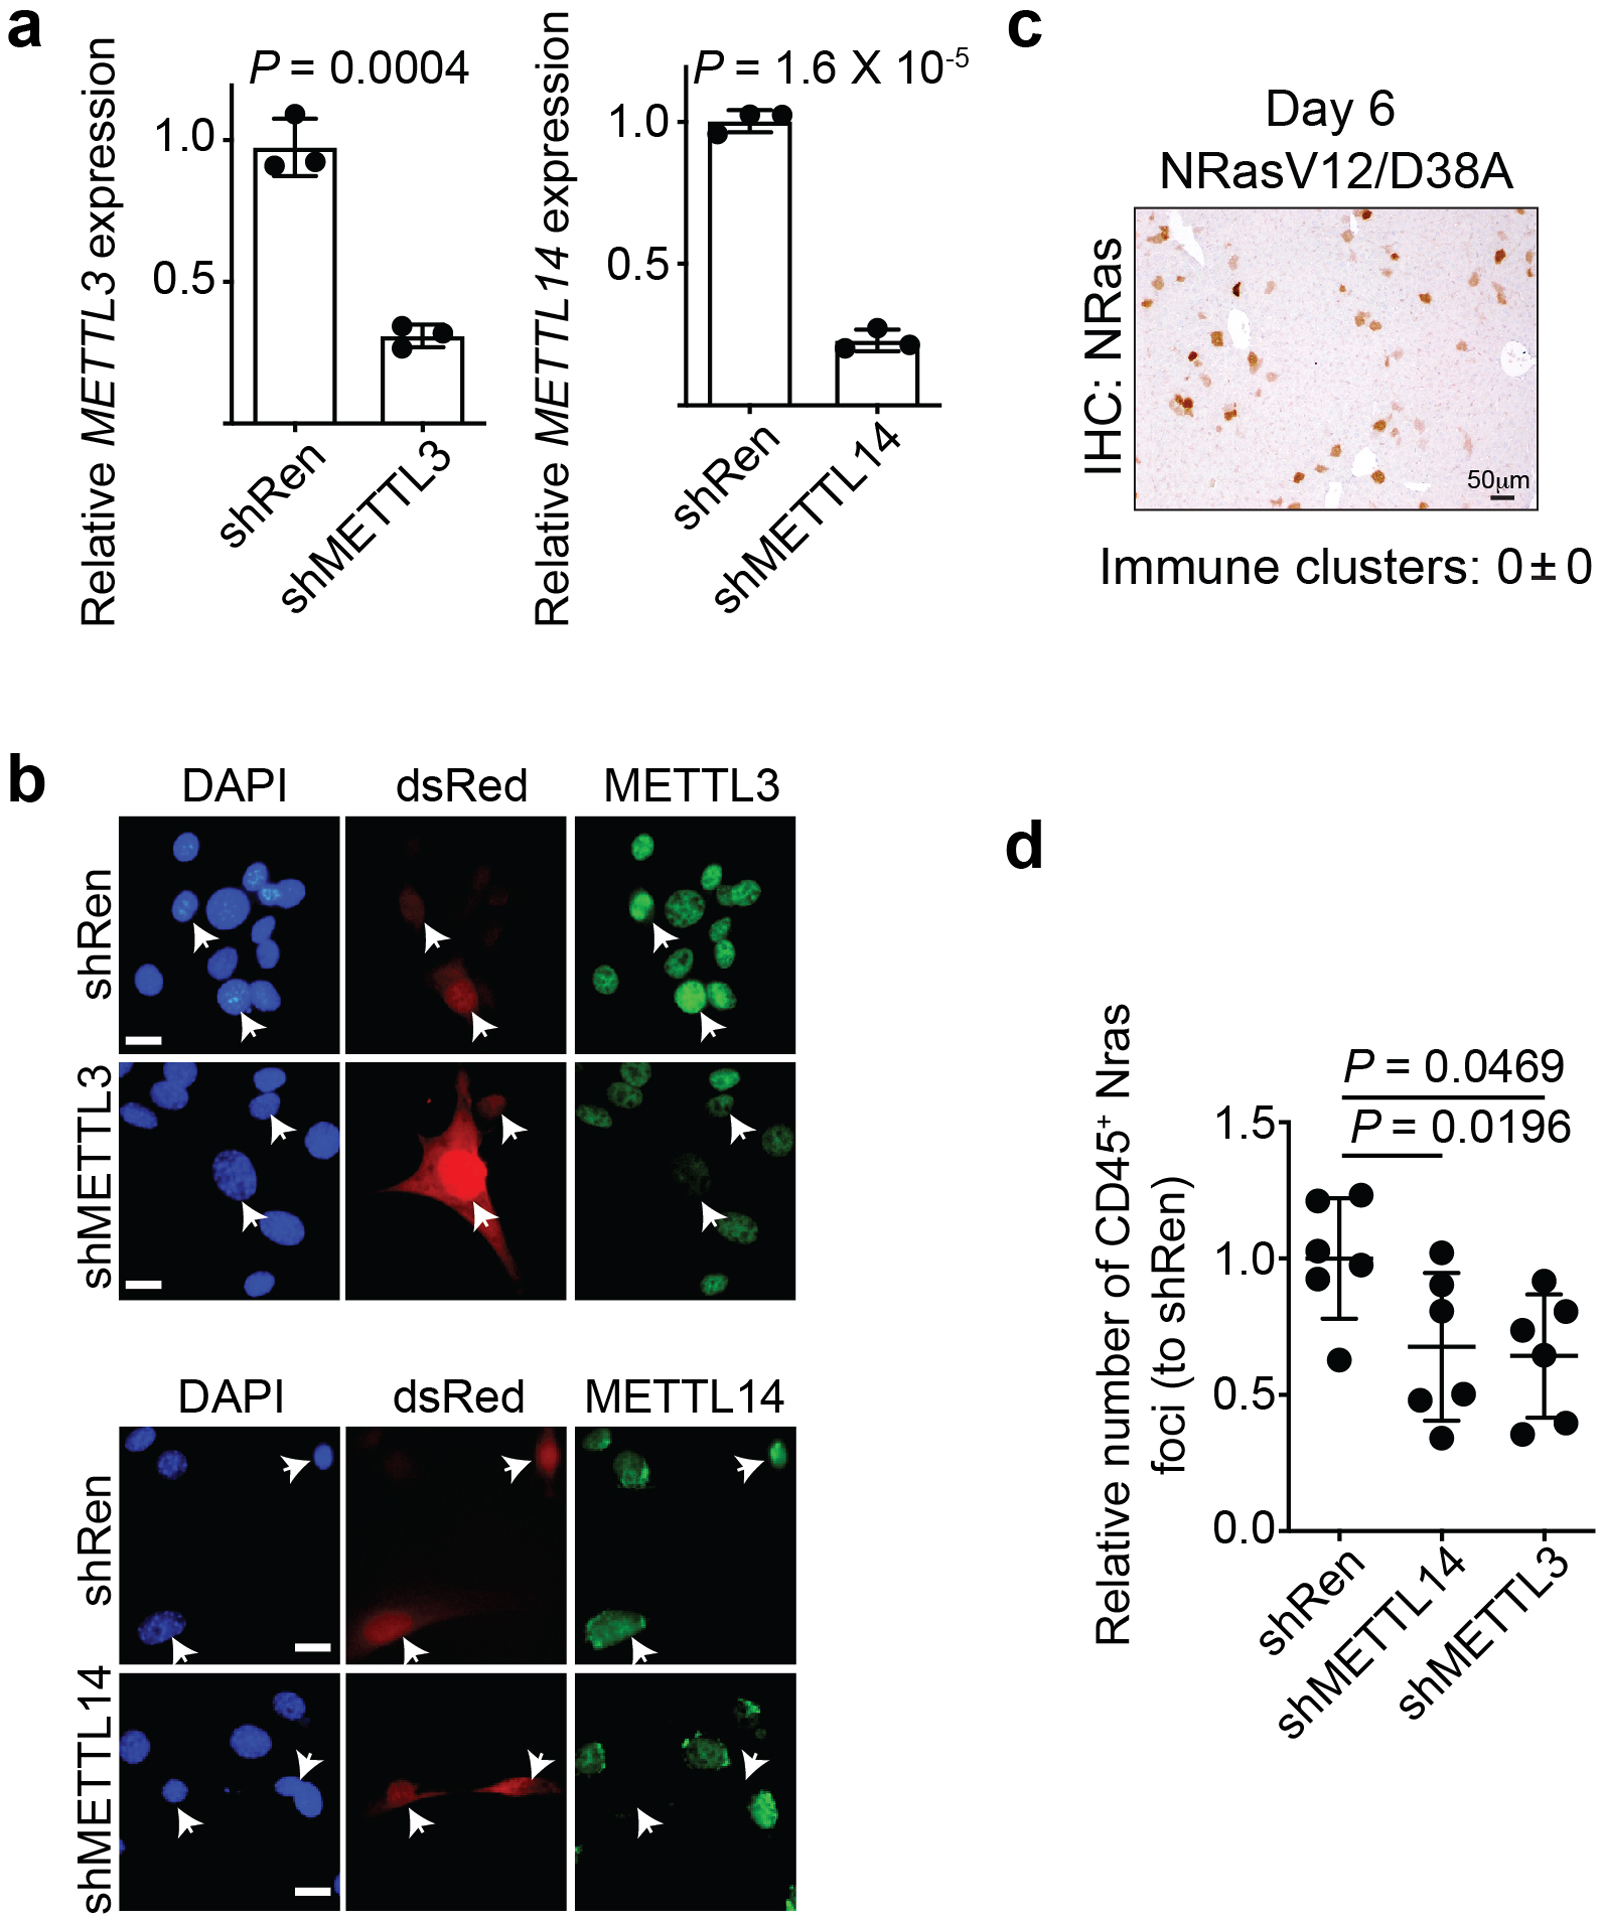
a, Validation of METTL3 and METTL14 knockdown by qRT-PCR analysis in mouse NIH3T3 cells. n=3 biologically independent experiments. b, Validation of METTL3 and METTL14 knockdown by immunofluorescence analysis in mouse NIH3T3 cells. Arrows point to dsRed-expressing shRen control, shMETTL3 or shMETTL14. Bar = 10 μm. The experiment was repeated two times independently with similar results. c, Immunohistochemical staining of NRas in liver tissues injected with a mutant NRasV12/D38A that is incapable of inducing senescence at day 6. The experiment was repeated in 3 biologically independent mice with similar results. Bar = 50 μm. d, Quantification of CD45+/NRas+ foci in the livers isolated from the indicated mice at day 6. n = 6 biologically independent mice per group. Data represent mean ± s.d. P values were calculated using a two-tailed t-test. Numerical source data for 10a and 10d are provided.
Supplementary Material
Acknowledgement
This work was supported by US National Institutes of Health grants (R01CA160331, R01CA163377, R01CA202919, R01CA239128 and R01CA243142 to R.Z., P01AG031862 to R.Z., P50CA228991 to R.Z. and R50CA211199 to A.V.K.), US Department of Defense (OC180109 and OC190181 to R.Z.), The Honorable Tina Brozman Foundation for Ovarian Cancer Research and The Tina Brozman Ovarian Cancer Research Consortium 2.0 (to R.Z.) and Ovarian Cancer Research Alliance (Collaborative Research Development Grant #596552 to R.Z. and Ann and Sol Schreiber Mentored Investigator Award #649658 to J.L.). Support of Core Facilities was provided by Cancer Centre Support Grant (CCSG) CA010815 to The Wistar Institute.
Footnotes
Financial and non-Financial Competing Interests
The authors have no financial and non-financial competing interests.
Cited References
- 1.Roundtree IA, Evans ME, Pan T & He C Dynamic RNA Modifications in Gene Expression Regulation. Cell 169, 1187–1200 (2017). [DOI] [PMC free article] [PubMed] [Google Scholar]
- 2.Yue Y, Liu J & He C RNA N6-methyladenosine methylation in post-transcriptional gene expression regulation. Genes Dev 29, 1343–1355 (2015). [DOI] [PMC free article] [PubMed] [Google Scholar]
- 3.Ping XL et al. Mammalian WTAP is a regulatory subunit of the RNA N6-methyladenosine methyltransferase. Cell Res 24, 177–189 (2014). [DOI] [PMC free article] [PubMed] [Google Scholar]
- 4.Knuckles P et al. RNA fate determination through cotranscriptional adenosine methylation and microprocessor binding. Nat Struct Mol Biol 24, 561–569 (2017). [DOI] [PubMed] [Google Scholar]
- 5.Xiang Y et al. RNA m(6)A methylation regulates the ultraviolet-induced DNA damage response. Nature 543, 573–576 (2017). [DOI] [PMC free article] [PubMed] [Google Scholar]
- 6.Bertero A et al. The SMAD2/3 interactome reveals that TGFbeta controls m(6)A mRNA methylation in pluripotency. Nature 555, 256–259 (2018). [DOI] [PMC free article] [PubMed] [Google Scholar]
- 7.Barbieri I et al. Promoter-bound METTL3 maintains myeloid leukaemia by m(6)A-dependent translation control. Nature 552, 126–131 (2017). [DOI] [PMC free article] [PubMed] [Google Scholar]
- 8.Huang H et al. Histone H3 trimethylation at lysine 36 guides m(6)A RNA modification co-transcriptionally. Nature 567, 414–419 (2019). [DOI] [PMC free article] [PubMed] [Google Scholar]
- 9.Liu J et al. N (6)-methyladenosine of chromosome-associated regulatory RNA regulates chromatin state and transcription. Science 367, 580–586 (2020). [DOI] [PMC free article] [PubMed] [Google Scholar]
- 10.Campisi J Aging, cellular senescence, and cancer. Annu Rev Physiol 75, 685–705 (2013). [DOI] [PMC free article] [PubMed] [Google Scholar]
- 11.Childs BG et al. Senescent cells: an emerging target for diseases of ageing. Nat Rev Drug Discov 16, 718–735 (2017). [DOI] [PMC free article] [PubMed] [Google Scholar]
- 12.Herranz N & Gil J Mechanisms and functions of cellular senescence. J Clin Invest 128, 1238–1246 (2018). [DOI] [PMC free article] [PubMed] [Google Scholar]
- 13.Rodier F & Campisi J Four faces of cellular senescence. J Cell Biol 192, 547–556 (2011). [DOI] [PMC free article] [PubMed] [Google Scholar]
- 14.Coppe JP et al. Senescence-associated secretory phenotypes reveal cell-nonautonomous functions of oncogenic RAS and the p53 tumor suppressor. PLoS Biol 6, 2853–2868 (2008). [DOI] [PMC free article] [PubMed] [Google Scholar]
- 15.Zaccara S, Ries RJ & Jaffrey SR Reading, writing and erasing mRNA methylation. Nat Rev Mol Cell Biol 20, 608–624 (2019). [DOI] [PubMed] [Google Scholar]
- 16.Wang P, Doxtader KA & Nam Y Structural Basis for Cooperative Function of Mettl3 and Mettl14 Methyltransferases. Mol Cell 63, 306–317 (2016). [DOI] [PMC free article] [PubMed] [Google Scholar]
- 17.Wang X et al. Structural basis of N(6)-adenosine methylation by the METTL3-METTL14 complex. Nature 534, 575–578 (2016). [DOI] [PubMed] [Google Scholar]
- 18.Fustin JM et al. RNA-methylation-dependent RNA processing controls the speed of the circadian clock. Cell 155, 793–806 (2013). [DOI] [PubMed] [Google Scholar]
- 19.Acosta JC et al. A complex secretory program orchestrated by the inflammasome controls paracrine senescence. Nat Cell Biol 15, 978–990 (2013). [DOI] [PMC free article] [PubMed] [Google Scholar]
- 20.Dou Z et al. Cytoplasmic chromatin triggers inflammation in senescence and cancer. Nature 550, 402–406 (2017). [DOI] [PMC free article] [PubMed] [Google Scholar]
- 21.De Cecco M et al. L1 drives IFN in senescent cells and promotes age-associated inflammation. Nature 566, 73–78 (2019). [DOI] [PMC free article] [PubMed] [Google Scholar]
- 22.Liu J et al. m(6)A mRNA methylation regulates AKT activity to promote the proliferation and tumorigenicity of endometrial cancer. Nat Cell Biol 20, 1074–1083 (2018). [DOI] [PMC free article] [PubMed] [Google Scholar]
- 23.Tasdemir N et al. BRD4 Connects Enhancer Remodeling to Senescence Immune Surveillance. Cancer Discov 6, 612–629 (2016). [DOI] [PMC free article] [PubMed] [Google Scholar]
- 24.Hari P et al. The innate immune sensor Toll-like receptor 2 controls the senescence-associated secretory phenotype. Sci Adv 5, eaaw0254 (2019). [DOI] [PMC free article] [PubMed] [Google Scholar]
- 25.Guerra C et al. Pancreatitis-induced inflammation contributes to pancreatic cancer by inhibiting oncogene-induced senescence. Cancer Cell 19, 728–739 (2011). [DOI] [PMC free article] [PubMed] [Google Scholar]
- 26.Rao SS et al. A 3D map of the human genome at kilobase resolution reveals principles of chromatin looping. Cell 159, 1665–1680 (2014). [DOI] [PMC free article] [PubMed] [Google Scholar]
- 27.Kang TW et al. Senescence surveillance of pre-malignant hepatocytes limits liver cancer development. Nature 479, 547–551 (2011). [DOI] [PubMed] [Google Scholar]
- 28.Lan Q et al. The Critical Role of RNA m(6)A Methylation in Cancer. Cancer Res 79, 1285–1292 (2019). [DOI] [PubMed] [Google Scholar]
- 29.Lin S, Choe J, Du P, Triboulet R & Gregory RI The m(6)A Methyltransferase METTL3 Promotes Translation in Human Cancer Cells. Molecular cell 62, 335–345 (2016). [DOI] [PMC free article] [PubMed] [Google Scholar]
- 30.Choe J et al. mRNA circularization by METTL3-eIF3h enhances translation and promotes oncogenesis. Nature 561, 556–560 (2018). [DOI] [PMC free article] [PubMed] [Google Scholar]
- 31.Dow LE et al. A pipeline for the generation of shRNA transgenic mice. Nat Protoc 7, 374–393 (2012). [DOI] [PMC free article] [PubMed] [Google Scholar]
- 32.Wang Y et al. N6-methyladenosine modification destabilizes developmental regulators in embryonic stem cells. Nat Cell Biol 16, 191–198 (2014). [DOI] [PMC free article] [PubMed] [Google Scholar]
- 33.Yoon KJ et al. Temporal Control of Mammalian Cortical Neurogenesis by m(6)A Methylation. Cell 171, 877–889 e817 (2017). [DOI] [PMC free article] [PubMed] [Google Scholar]
- 34.Zhang R et al. Formation of MacroH2A-containing senescence-associated heterochromatin foci and senescence driven by ASF1a and HIRA. Dev Cell 8, 19–30 (2005). [DOI] [PubMed] [Google Scholar]
- 35.Nacarelli T et al. NAD(+) metabolism governs the proinflammatory senescence-associated secretome. Nat Cell Biol 21, 397–407 (2019). [DOI] [PMC free article] [PubMed] [Google Scholar]
- 36.Krizhanovsky V et al. Senescence of activated stellate cells limits liver fibrosis. Cell 134, 657–667 (2008). [DOI] [PMC free article] [PubMed] [Google Scholar]
- 37.Dominissini D, Moshitch-Moshkovitz S, Salmon-Divon M, Amariglio N & Rechavi G Transcriptome-wide mapping of N(6)-methyladenosine by m(6)A-seq based on immunocapturing and massively parallel sequencing. Nat Protoc 8, 176–189 (2013). [DOI] [PubMed] [Google Scholar]
- 38.Fukumoto T et al. N(6)-Methylation of Adenosine of FZD10 mRNA Contributes to PARP Inhibitor Resistance. Cancer Res 79, 2812–2820 (2019). [DOI] [PMC free article] [PubMed] [Google Scholar]
- 39.Zeng Y et al. Refined RIP-seq protocol for epitranscriptome analysis with low input materials. PLoS Biol 16, e2006092 (2018). [DOI] [PMC free article] [PubMed] [Google Scholar]
- 40.Skene PJ, Henikoff JG & Henikoff S Targeted in situ genome-wide profiling with high efficiency for low cell numbers. Nat Protoc 13, 1006–1019 (2018). [DOI] [PubMed] [Google Scholar]
- 41.Hagege H et al. Quantitative analysis of chromosome conformation capture assays (3C-qPCR). Nat Protoc 2, 1722–1733 (2007). [DOI] [PubMed] [Google Scholar]
- 42.Wu S et al. ARID1A spatially partitions interphase chromosomes. Sci Adv 5, eaaw5294 (2019). [DOI] [PMC free article] [PubMed] [Google Scholar]
- 43.Aird KM et al. HMGB2 orchestrates the chromatin landscape of senescence-associated secretory phenotype gene loci. J Cell Biol 215, 325–334 (2016). [DOI] [PMC free article] [PubMed] [Google Scholar]
- 44.Langmead B & Salzberg SL Fast gapped-read alignment with Bowtie 2. Nat Methods 9, 357–359 (2012). [DOI] [PMC free article] [PubMed] [Google Scholar]
- 45.Heinz S et al. Simple combinations of lineage-determining transcription factors prime cis-regulatory elements required for macrophage and B cell identities. Mol Cell 38, 576–589 (2010). [DOI] [PMC free article] [PubMed] [Google Scholar]
- 46.Kent WJ, Zweig AS, Barber G, Hinrichs AS & Karolchik D BigWig and BigBed: enabling browsing of large distributed datasets. Bioinformatics 26, 2204–2207 (2010). [DOI] [PMC free article] [PubMed] [Google Scholar]
- 47.Li B & Dewey CN RSEM: accurate transcript quantification from RNA-Seq data with or without a reference genome. BMC Bioinformatics 12, 323 (2011). [DOI] [PMC free article] [PubMed] [Google Scholar]
- 48.Love MI, Huber W & Anders S Moderated estimation of fold change and dispersion for RNA-seq data with DESeq2. Genome Biol 15, 550 (2014). [DOI] [PMC free article] [PubMed] [Google Scholar]
- 49.Langmead B, Trapnell C, Pop M & Salzberg SL Ultrafast and memory-efficient alignment of short DNA sequences to the human genome. Genome Biol 10, R25 (2009). [DOI] [PMC free article] [PubMed] [Google Scholar]
Associated Data
This section collects any data citations, data availability statements, or supplementary materials included in this article.
Supplementary Materials
Data Availability Statement
Cut-and-run, ChIP-seq and RNA-seq data that support the findings of this study have been deposited in the Gene Expression Omnibus (GEO) under accession number: GSE141944 (RNA-seq for METTL3 knockdown and rescue: GSE159551; RNA-seq for METTL14 knockdown and rescue: GSE141991; cut-and-run and ChIP-seq: GSE141992; m6A-seq: GSE141993; and carRNA m6A-seq: GSE159550). For the correlation analysis between METTL14 and SASP genes in human laser capture and microdissected PanIN lesion samples, gene expression data were obtained from GEO (under accession code GSE43288). Source data for unprocessed immunoblots for Fig. 1a, 1e, 1h, 4c and Extended Data Fig. 4d, 5a, 5f, 6a, 8e, 8k, 8l and source data used for statistical analyses have been provided as Source Data files. All other data supporting the findings of this study are available from the corresponding author on reasonable request.


